


 nueva página del texto (beta)
 Inglés (pdf)
 Artículo en XML
 Referencias del artículo
 Enviar artículo por email
 Citado por SciELO
  Similares en
SciELO
Similares en
SciELO 
 Permalink
1 Introduction
In the evolving landscape of digital finance, cryptocurrencies represent a paradigm shift, reshaping traditional monetary exchange and financial privacy frameworks. Among these, Bitcoin, as the progenitor, symbolizes the dawn of decentralized finance with its blockchain technology. However, the transparency of Bitcoin’s ledger—while facilitating transaction traceability—also obscures the identities of participants, posing a dual-edged sword.
This paper endeavors to penetrate this veil of anonymity by applying data science techniques, thereby unveiling transactional behaviors within the network. This research focuses on the utilization of Graph Neural Networks (GNNs), which merge graph theory with machine learning to effectively interpret complex data structures.
Specifically, Graph Attention Networks (GATs) are employed to classify Bitcoin addresses by analyzing the transaction history encapsulated within a graph structure, thereby allowing the identification of patterns and address classification.
To address the problem, this study limits the transaction graph to data solely from 2022, justified by a comparative analysis over a decade, which shows that recent data more effectively reflects the dynamic nature of the network and improves classification performance.
This limitation points to a broader discussion on the adaptability of GNNs to evolving data landscapes and their capacity to capture nuanced transactional behaviors in Bitcoin’s rapidly changing environment.
In terms of industry standards and metrics, the model’s performance is quantified through accuracy, precision, recall, and F1 score—metrics widely recognized in data science for evaluating classification models.
This paper also introduces an innovative Extract, Transform, Load (ETL) process using Bitcoin Core software, significantly enhancing the practicality and accessibility of blockchain data analysis for cryptocurrency analytics.
Within the structured framework of a graph, we conceptualize the Bitcoin transaction network as follows:
where
The main challenge lies in classifying each node
Mathematically, the problem is defined by the goal of learning a function
– The graph
– Feature vectors
– Class labels within
2 Related Work
Despite the potential for democratizing finance, Bitcoin’s pseudo-anonymity has also made it a favored medium for illicit activities. Bitcoin’s design, which champions privacy and anonymity, has been exploited for transactions that elude traditional law enforcement and regulatory oversight.
High-profile cases like the Silk Road marketplace highlighted the use of Bitcoin in black markets, where it was used to obfuscate the transfer of illicit goods [1].
Further complicating the regulatory landscape are methods like ”mixing” or ”tumbling,” which obscure the origins of Bitcoin to launder money from criminal activities. These methodologies pose significant challenges for financial regulators and law enforcement agencies in tracing illicit funds.
The advent of graph theory applications in blockchain analysis, as demonstrated by Fleder et al. [1], provides a powerful tool for tracing transactions and understanding the complex web of transfers, enhancing the ability to track, monitor, and regulate the flow of Bitcoin across the network.
The work of Weber et al. highlights the application of Graph Convolutional Networks for financial forensics, using the Elliptic Data Set to distinguish between licit and illicit transactions [5].
This study exemplifies the practical applications of advanced machine learning techniques in regulatory frameworks, offering robust tools that can significantly improve the transparency and integrity of blockchain transactions.
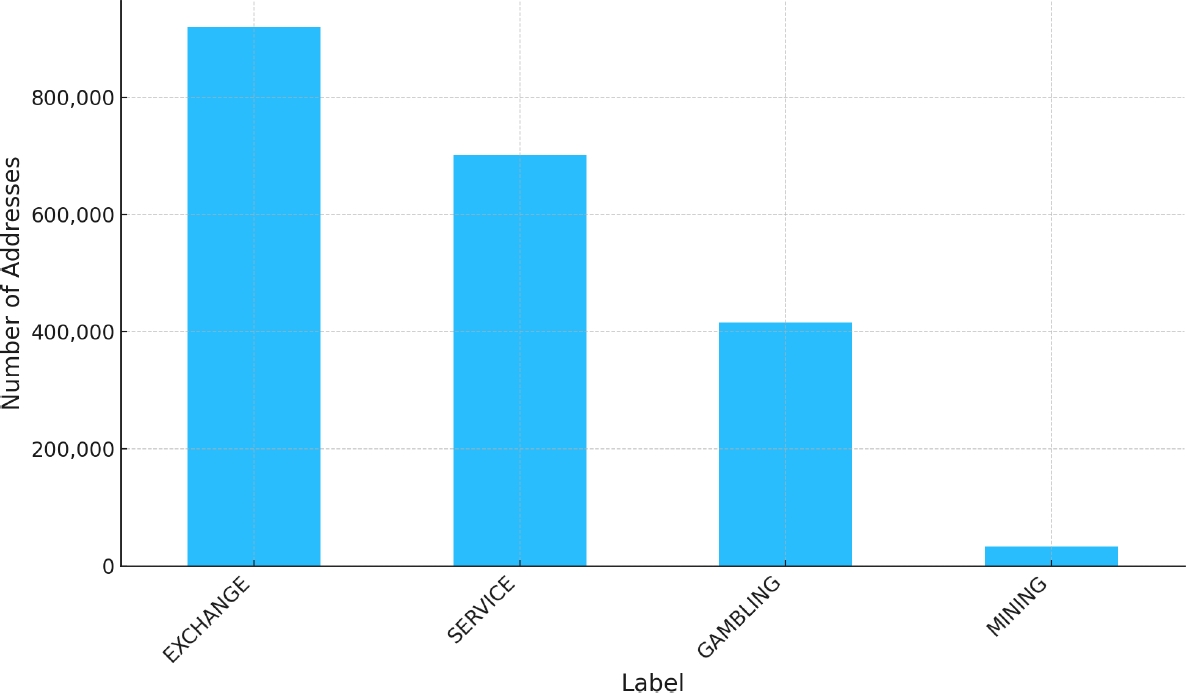
Huang et al. [2]: Huang and colleagues introduced the BAClassifier, a framework utilizing GNNs to categorize Bitcoin addresses into behavioral patterns such as exchanges, mining, and gambling. Their research is particularly noteworthy not only for its application of GNNs but also for its open and extensive dataset of over 2 million real-world Bitcoin addresses.
This paper utilizes the same dataset, enhancing the continuity and comparability of research findings in this domain. However, unlike Huang et al., who leverage a combination of GNNs with Long Short-Term Memory (LSTM) networks and Multilayer Perceptrons (MLP) for feature extraction and classification, this work employs a more streamlined model focusing solely on GATs to harness the dynamic and interconnected nature of transactional data, thus simplifying the computational process.
Now, while their work is foundational, the methodology in our paper extends their dataset’s utility by integrating it into a novel ETL process developed using Bitcoin Core software. This approach not only ensures a more transparent and reproducible data extraction process but also enhances the accessibility and integrity of the data used for analysis.
The ability to extract and process raw transaction data directly from a synchronized node presents a significant methodological improvement that democratizes data access and mitigates reliance on third-party data providers. Pocher et al. [3]: This study explores the effectiveness of GCNs and GATs in classifying Bitcoin transactions for anti-money laundering and counter-financing of terrorism (AML/CFT).
Their use of the Elliptic Data Set to classify transactions based on their licitness provides a valuable parallel to this paper. Both studies underscore the enhanced capability of GATs over traditional machine learning methods in identifying complex relational patterns within transaction data.
This paper differentiates itself by conducting a comparative year-over-year analysis, revealing that data from 2022 offers a more centralized and interconnected transaction network, which significantly boosts the model’s performance.
The inclusion of a benchmark analysis elucidates the reasons behind the varying effectiveness of GATs across different temporal datasets, a perspective not covered by Pocher et al. This insight is crucial for understanding the impact of network evolution on model efficacy and can guide future applications of GNNs in financial forensics. Veličković et al. [4]:
The introduction of Graph Attention Networks by Veličković et al. provides the technical foundation for both the aforementioned studies and this paper. Their development of GATs introduced a novel approach to node interaction within graphs, enabling dynamic weighting of node importance, which enhances the model’s sensitivity to the subtleties of transactional relationships.
Building on Veličković et al.’s work, this paper applies GATs specifically tailored to the nuanced dynamics of the Bitcoin transaction network. By leveraging a simpler yet highly effective model configuration, this work achieves performance metrics that are comparable to the works referenced in this section, especially when analyzing the more recent and structurally distinct 2022 data.
3 Data and Methods
We built an end-to-end ETL process that will provide us with free and full access to the desired Bitcoin Blockchain data and set it up in the correct format for a Data Science analysis. This process is one of the main contributions of this work, it leverages the Bitcoin Core v25.0.0 client, one of the most popular clients, to synchronize a full node of the Bitcoin network.
Then, through the client’s RPC API, we extracted all the relevant information required to generate a dataset representation of the Bitcoin Blockchain; the complete ETL process is thoroughly documented in the following GitHub repository1. The final dataset, showed on Table 1, built from the genesis of the blockchain up to the cut-off date for this analysis (Decembrer-2022) has the following structure:
– Blocks: The Blockchain contains a series of cryptographically connected Blocks that in turn contain a verified list of transactions. These blocks will have two parts: the header, containing general information about the contents of the block, and the body, containing the list of transactions. This table will contain only the header.
– Transactions: Contains the aforementioned body of the blocks, a list of the verified transactions existing in the blockchain.
– Inputs: Nested into each transaction a list of inputs will provide us with the reference of the precedence of the bitcoins, which is the most relevant characteristic of having an open ledger such as the Bitcoin Blockchain. This table will only contain non-coinbase transactions, as coinbase blocks (newly mined blocks) will have no inputs.
– Outputs: The final destination of the bitcoins to be transferred. Pay-to-public-key transactions (P2PK) worked from the genesis of the blockchain (January 3, 2009) up to January 16 of the same year, Pay-to-public-key-hash transactions (P2PKH) and posterior protocols, show the destination address as such.
Table 1 Source dataset descriptions
| FILE(S) | COLUMN | DATA TYPE |
| _blocks.parquet | block_hash | object |
| 768,333 rows | height | int32 |
| 1 file (44.28 MB) | time | int32 |
| tx_count | int32 | |
| _transactions_parquets | txid | object |
| 789’789,238 rows | block_hash | object |
| 60 files (48.64 GB) | is_coinbase | bool |
| _vin_parquets | txid | object |
| 2,082’564,677 rows | vin_txid | object |
| 140 files (175.99 GB) | vout | int32 |
| _vout_parquets | txid | object |
| 2,161’264,786 rows | value | float64 |
| 134 files (134.14 GB) | n | int32 |
| addresses | object |
Is important to note that going forward the input information does not contain the origin address of the bitcoins, which is a fundamental piece for the graph that we will build, so this needs to be discovered by generating a data cross with the outputs table, as every input is the output of a previous transaction.
This process will provide us with the correct mapping of the ‘origin address’ and ‘destination address’. With this completed mapping we use the labeled dataset to safely add the labels to both the origin and destination addresses of each transaction and filter only the transactions of the 2 million labeled addresses.
3.1 Graph Construction
In the process of constructing the transaction graph for analysis, several pivotal decisions and pre-processing steps were taken:
-
– Temporal Scope Restriction: Given the computational challenges associated with processing the entire dataset and the observed predictive value of recent transactions, the graph
– Label Encoding: Let
-
– Graph Definition: The graph is defined as follows:
–
–
–
-
– Time-decay Weighting: A key innovation in our approach is the introduction of a time-decay weight
– Node Feature Preparation: Each node
– Node Label Assignment: A subset of nodes
-
– Graph Data Representation: The finalized graph data structure
The graph representation should be extended to tensor form to facilitate efficient computation in the GNN model. For instance, the node feature matrix
Represents the feature vector of the node
This tensorial representation is particularly beneficial when extending the model to include multiple types of relations or temporal dynamics where a third dimension could represent time steps or different relation types between nodes.
3.2 Centrality Metrics
We employed the following: In-Degree Centrality, Out-Degree Centrality, and Betweenness Centrality. These metrics are the most relevant for a directed graph and our use case.
– In-degree Centrality quantifies the number of incoming edges to a node, indicating its popularity or receiver status within the network. Mathematically, it is defined for a node
where
– Out-degree Centrality measures the number of outgoing edges from a node, reflecting its influence or broadcaster role. It is given by:
– Betweenness Centrality captures the extent to which a node lies on the shortest paths between other nodes, serving as a bridge within the network. It is calculated as:
where
3.3 GNN Model Architecture
Velickovic et al. introduced Graph Attention Networks (GATs), which are innovative convolutional neural networks tailored for graph-structured data, utilizing masked self-attentional layers. These graph attentional layers are designed to be computationally efficient, avoiding expensive matrix operations and enabling parallelization across all graph nodes. This efficiency facilitates the implicit assignment of varying importances to nodes within a neighborhood, regardless of the neighborhood’s size, and circumvents the need for complete graph structure knowledge beforehand.
Such capabilities address several theoretical limitations of prior spectral-based methods. Furthermore, models incorporating these attention mechanisms have demonstrated superior or comparable performance to state-of-the-art results in four well-known node classification benchmarks, encompassing both transductive and inductive tasks, and including scenarios with entirely unseen graphs during testing [4].
The GAT includes an attention mechanism that dynamically assigns significance to the features of neighboring nodes, which enhances the model’s capacity to discern relevant transactional patterns, as show in Equation 5:
where:
– |
represents the feature vector of node |
– |
denotes the attention coefficient between node |
– |
is a learnable weight vector. |
– |
is a transformation weight matrix. |
– |
represents the activation function, and |
– |
represents concatenation. |
The softmax function is applied across all neighbors
where
This characteristic is crucial for maintaining gradient flow during backpropagation, especially in the computation of attention scores
Furthermore, the LeakyReLU ensures that the attention mechanism remains responsive to both positive and negative inputs, enriching the model’s ability to differentiate between various transactional relationships. Softmax normalization, defined as:
Applies to the attention coefficients, transforming them into a distribution over the neighbors of each node. This process not only makes the attention coefficients
3.4 Model Training
The training and evaluation methodology entails a structured sequence designed to optimize the model’s performance on classifying Bitcoin transactions. The process unfolds as follows:
1. The graph data is partitioned into training, validation, and test subsets, adhering to a specified ratio to balance learning efficacy and evaluation integrity. This partitioning ensures diverse representation across the subsets for comprehensive learning and assessment.
2. Utilizing the GAT model, node features propagate through the network, leveraging the attention mechanism to dynamically weight the importance of neighboring nodes. This process is instrumental in refining the output predictions for each node, focusing on relevant transactional patterns.
3. The loss for nodes in the training subset is calculated using the negative log-likelihood loss function, formulated as:
where
4. Backpropagation is employed to update the model parameters
5. The model’s efficacy is evaluated on the test subset by determining the accuracy, defined as the ratio of correctly predicted labels to the total number of test nodes:
where
Additionally, the integration of the Optuna framework for hyperparameter optimization plays a pivotal role in fine-tuning the GAT model’s configuration.
This process involves defining a search space for key parameters, such as the number of hidden units, dropout rate, learning rate, and weight decay, and iteratively evaluating the model’s performance across a range of trials to identify the optimal parameter set.
The objective function, centered around maximizing the accuracy on a validation subset, guides the selection of hyperparameters
that contribute to the model’s generalizability and effectiveness.
4 Results and Discussion
4.1 Centrality Metrics
The tables below enumerate the top three nodes according to each centrality metric. The focus on the top three nodes is due to their significantly higher centrality values, indicating a dominant role in the network’s transaction dynamics. Specifically, Figure 2 incorporates the top 100 nodes based on In-Degree centrality to produce a coherent and manageable graph visualization.
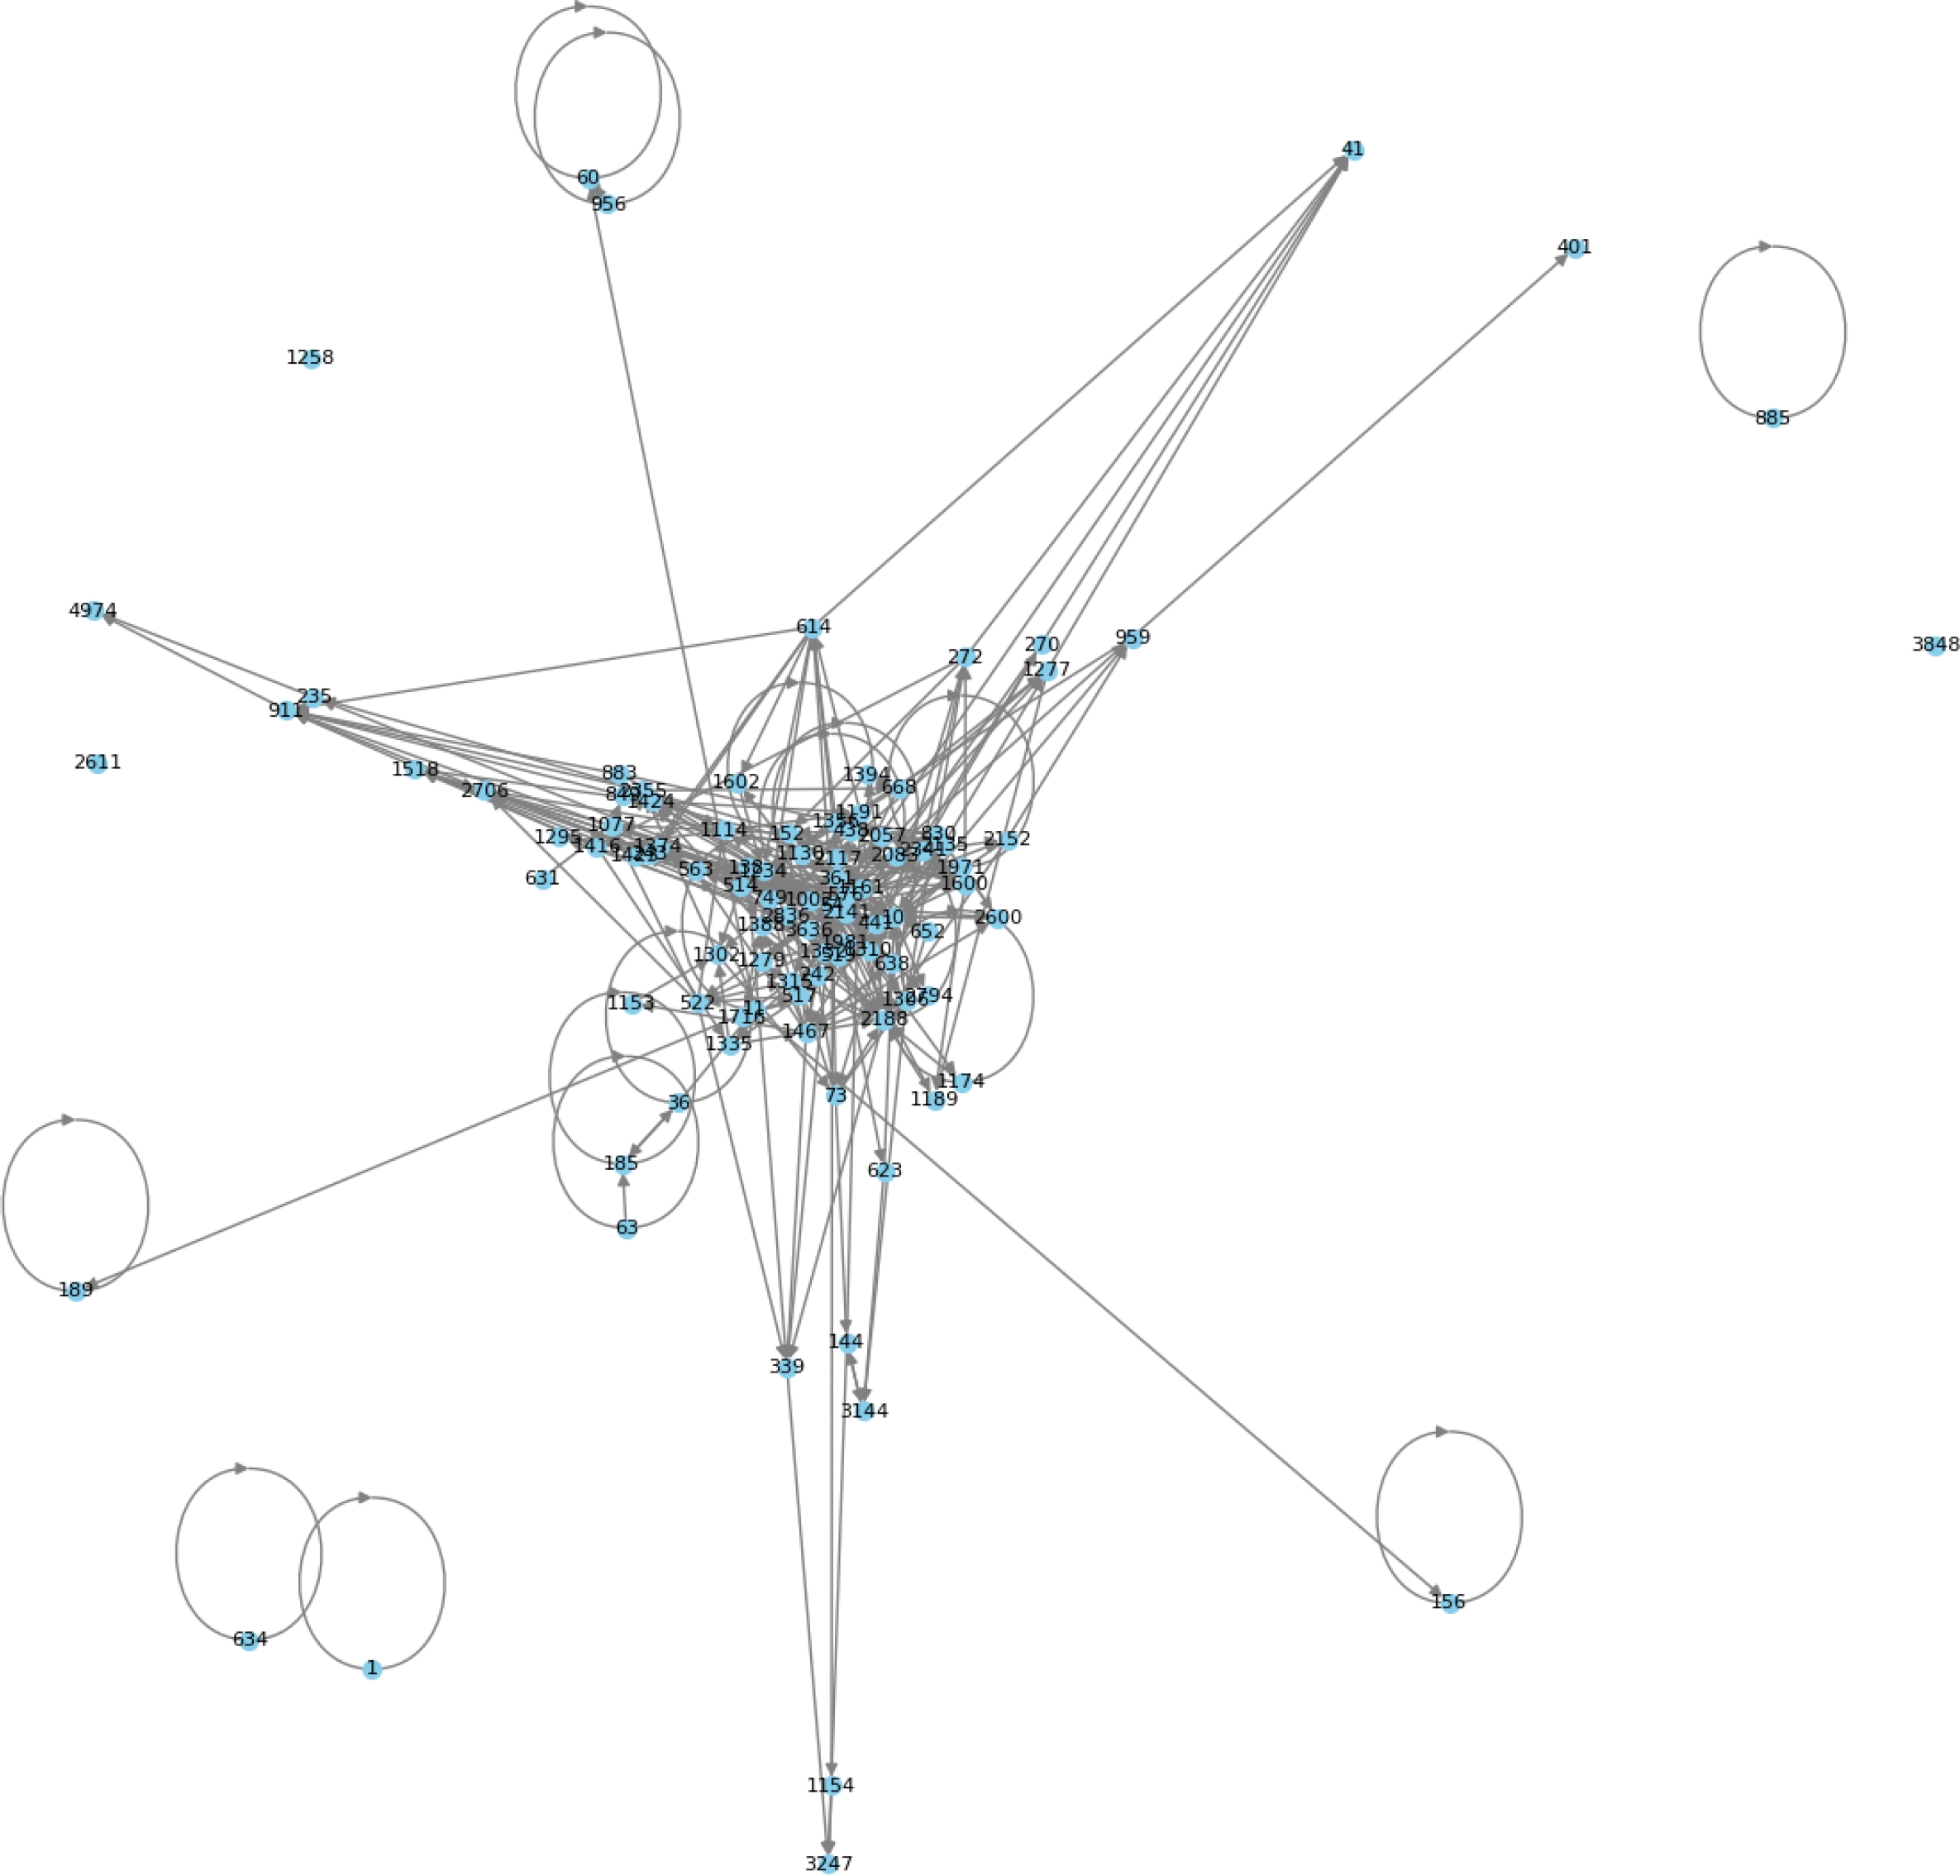
This approach avoids over-saturation of the visual representation, which is a standard practice in graph theory when dealing with large and interconnected networks.
4.2 Model Performance
The model’s training was conducted using hyperparameters optimized via Optuna, resulting in the following configuration: 64 hidden units, a dropout rate of 0.1478, a learning rate of 0.0835, and a weight decay of 0.000156. The outcomes after training for 500 epochs are encapsulated in the images shown in Figures 3, 4, and 5.
– Final Training Loss: 0.3273.
– Test Accuracy: 0.9287.
– Precision: 0.8935.
– Recall: 0.9287.
– F1 Score: 0.9017.
– Average Maximum Probability: 0.92.
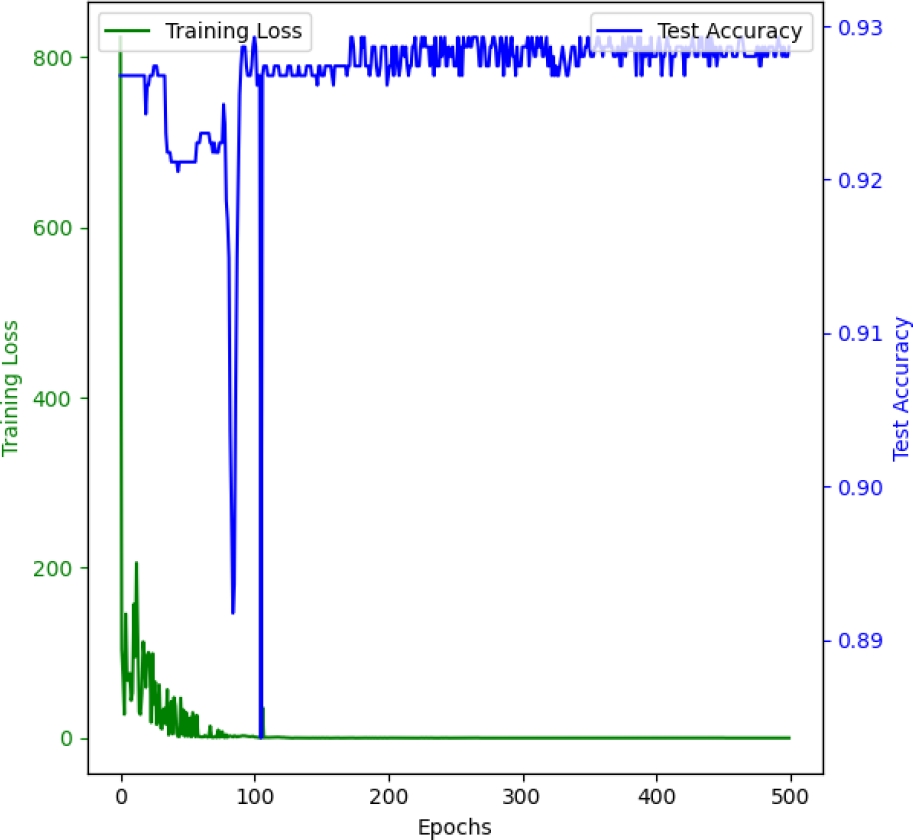
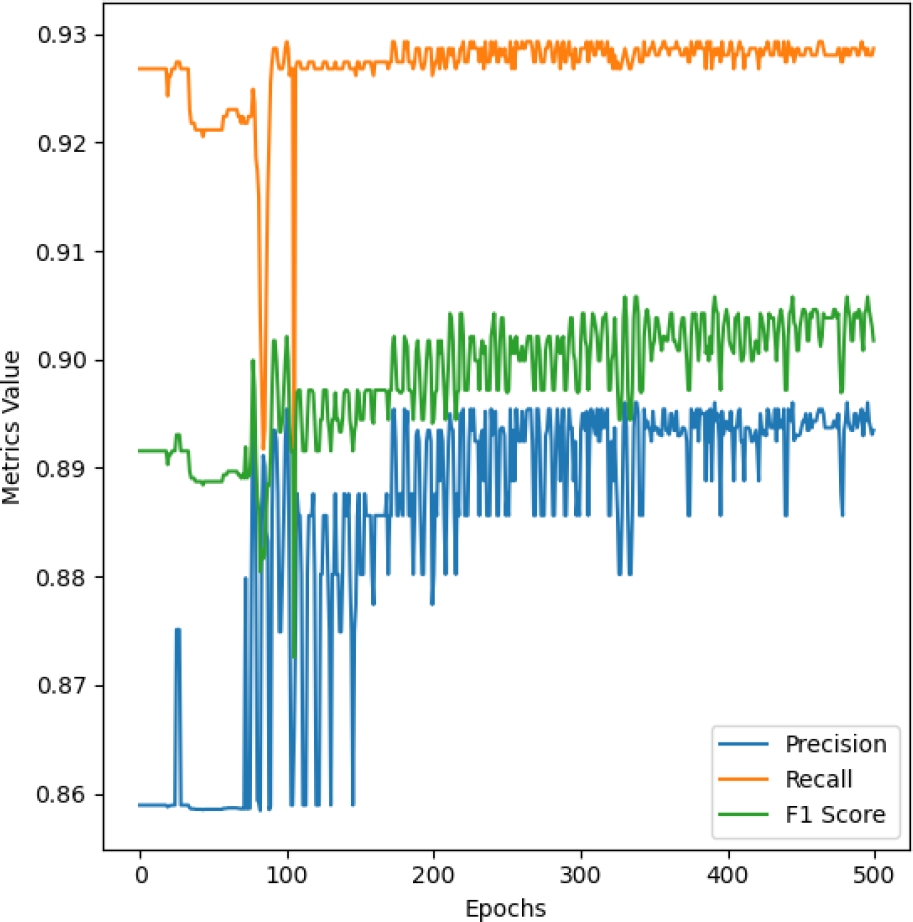
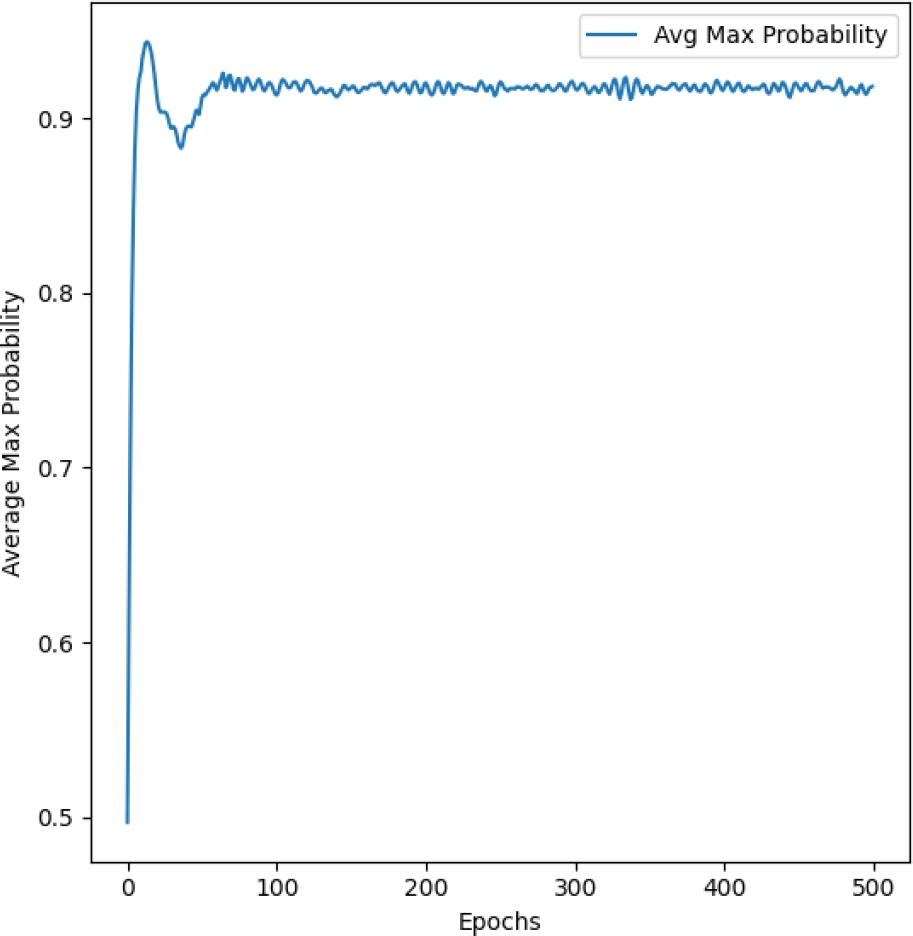
These metrics are visualized in mentioned Figures, which depicts the training loss and test accuracy (3), precision, recall, and F1 score (4), and the average maximum probability over epochs on (5). Each graph represents the progression of the respective metrics over the training period.
4.3 Ten-year Benchmark
This section illustrates a decade-long analysis of the Bitcoin transaction network through various graphical representations. Each figure is detailed below to guide interpretation without drawing any conclusions. Figure 6 displays three key metrics: the number of nodes and edges within the Bitcoin network over the years, and the average value of transactions per year.
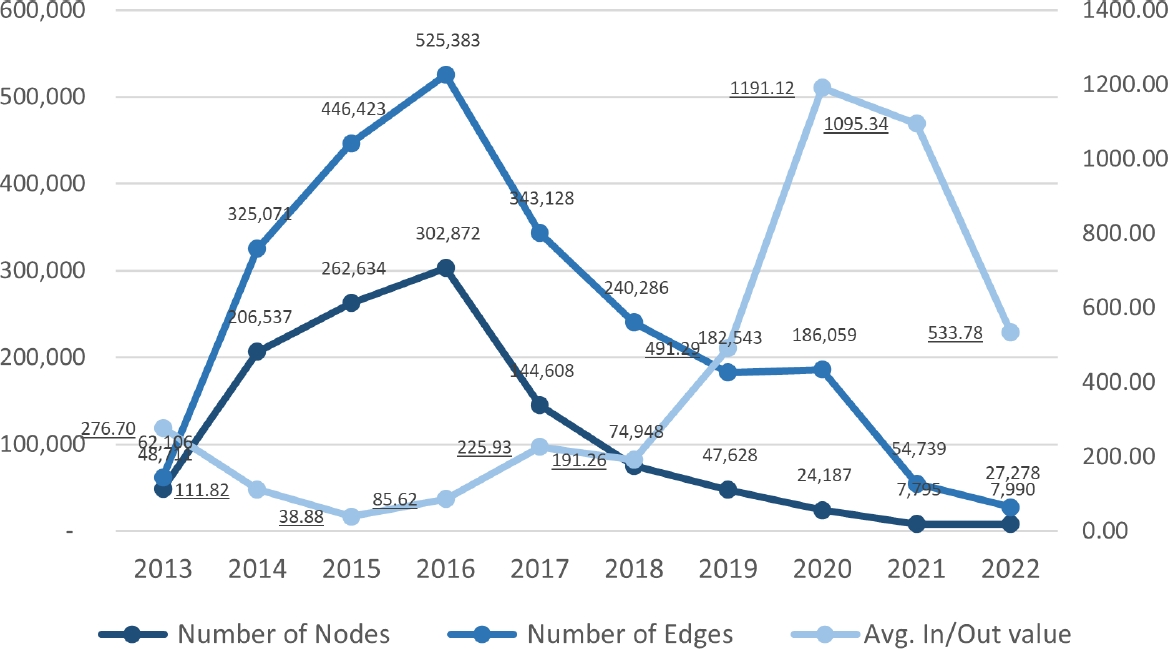
The lines indicate the growth or decline of these metrics, with scales provided on the left and right y-axes respectively. Figure 7 tracks three network characteristics: average degree, average path length, and density of the network each year. These lines represent the connectivity, efficiency, and compactness of the network respectively, with detailed yearly metrics shown on the graph.
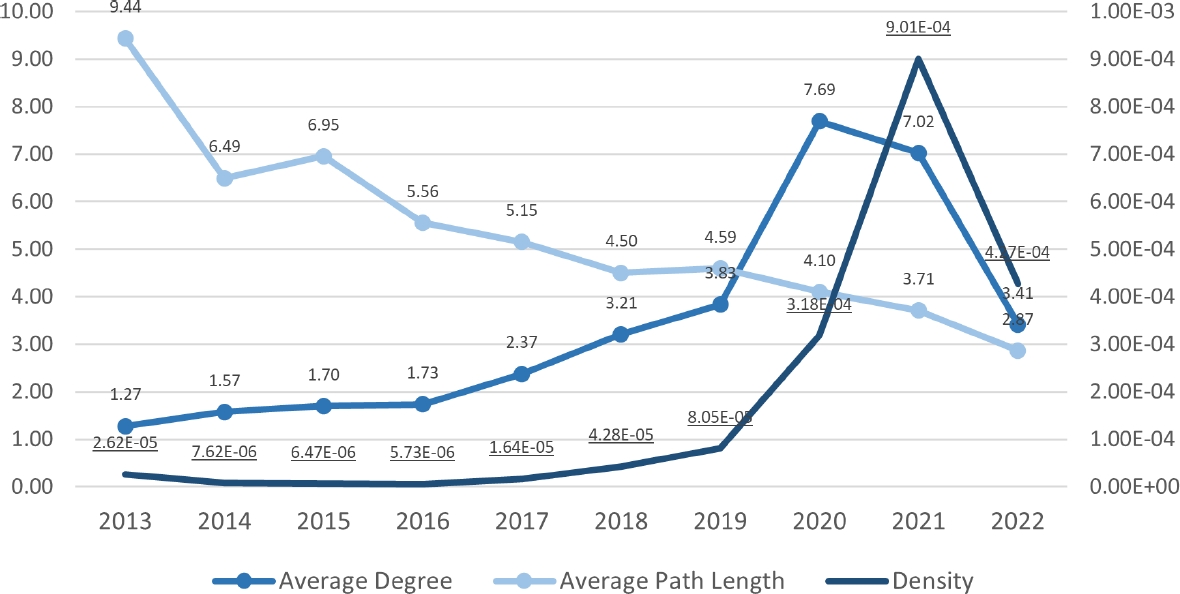
Fig. 7 Network metrics highlighting changes in average degree, path length, and density from 2013 to 2022
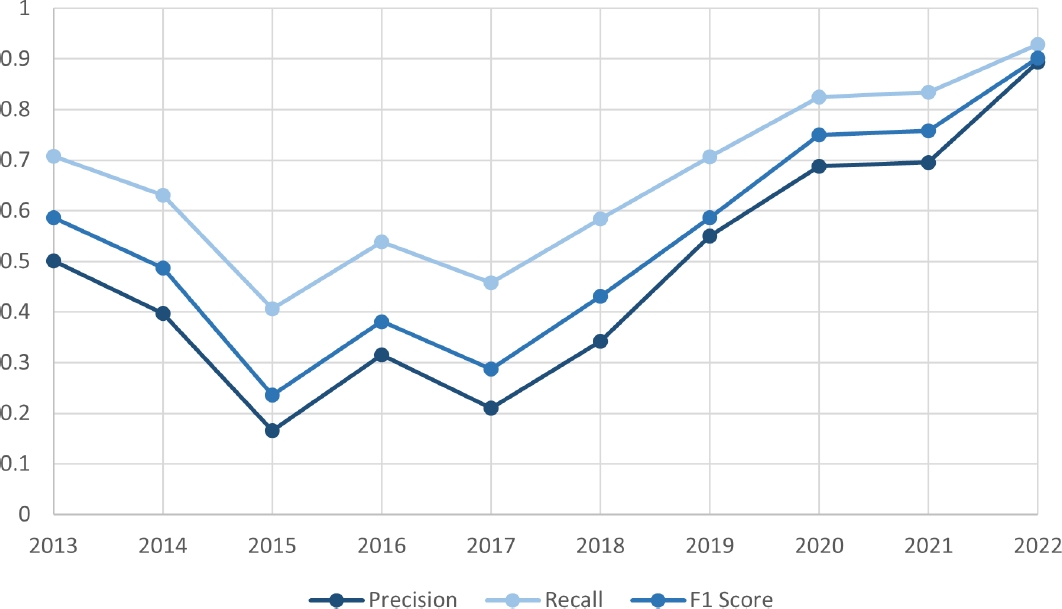
Figure 8 presents the annual performance metrics—precision, recall, and F1 score—of the GAT model when applied to the Bitcoin transaction networks from 2013 to 2022. The graph plots each metric’s progression over the years, providing a visual representation of the model’s performance trends.
The decision to limit the graph construction to data from the year 2022 can be substantiated, and the results better understood, by an analytical study of the network’s evolution over the past decade. The supporting evidence lies within the structural dynamics of the Bitcoin network, as revealed through a detailed analysis of network size and metrics.
The performance of our Graph Attention Network (GAT) model, as detailed in Table 7, offers insightful comparisons with both traditional ML models and advanced GNNs, reflecting its capabilities within graph-based representations of Bitcoin transactions. Our model’s architecture and operational framework have been intentionally simplified and focused on a single year of data.
Table 2 Base dataset for graph construction
| Column | Data Type | Definition |
| txid | object | Unique transaction identifier |
| from_address | object | Input address calculated from previous output |
| label_x | object | from address label from labeled dataset |
| to_address | object | Output address taken from current txid |
| label_y | object | to_address label from labeled dataset |
| value | float32 | Transaction value |
| date | datetime64 | Transaction date |
Table 3 Statistical summary of dataset for graph construction
| Data Description | Value | Date (dd/mm/yy hh:mm:ss) |
| count | 24,165,278 | 24,165,278 |
| min | 0.00000000 | 08/01/2011 20:35:49 |
| 25% | 0.00933270 | 11/04/2013 04:23:50 |
| 50% | 0.21101490 | 16/12/2015 12:59:20 |
| 75% | 1.23777479 | 31/08/2018 17:29:08 |
| max | 87,318.710937 | 21/12/2022 09:19:52 |
| mean | 8.07634491 | NaN |
| std | 104.65546417 | NaN |
Table 4 Top 3 nodes by in-degree centrality
| Address | In-Degree Centrality |
| 12cgpFdJViXbwHbhrA3TuW1EGnL25Zqc3P | 0.6515 |
| 17ac9tXHxu1nxdLgLu9WYk7vR8ggFN5GkH | 0.0736 |
| 1FpTqAX7URD7akZcLvJQRRaXSm4NUbP7ng | 0.0444 |
Table 5 Top 3 nodes by out-degree centrality
| Address | Out-Degree Centrality |
| 1HckjUpRGcrrRAtFaaCAUaGjsPx9oYmLaZ | 0.0739 |
| 151zHjPneqsceawoDFf9sqDRBWU3pd4LgH | 0.0466 |
| 1L1xSXttdsBAPVjVfyoyCg3RZbdHinT5G5 | 0.0422 |
Table 6 Top 3 nodes by betweenness centrality
| Address | Betweenness Centrality |
| 12cgpFdJViXbwHbhrA3TuW1EGnL25Zqc3P | 0.0871 |
| 151zHjPneqsceawoDFf9sqDRBWU3pd4LgH | 0.0842 |
| 1HckjUpRGcrrRAtFaaCAUaGjsPx9oYmLaZ | 0.0080 |
Table 7 Performance comparison between different graph representation models
| Method | Model | Precision | Recall | F1-score |
| GNNs | GFN (Huang et al.) | 0.9815 | 0.9725 | 0.9769 |
| Diffpool | 0.9218 | 0.9315 | 0.9299 | |
| GCN | 0.9534 | 0.9461 | 0.9514 | |
| GAT (ours) | 0.8935 | 0.9287 0.9017 | ||
| MLs | LR | 0.2208 | 0.3477 | 0.2684 |
| MLP | 0.1011 | 0.2500 | 0.1440 | |
| SVM | 0.8787 | 0.5503 | 0.5574 | |
| Bernoulli NB | 0.5078 | 0.3434 | 0.3047 | |
| Gaussian NB | 0.5342 | 0.4418 | 0.3999 | |
| KNN | 0.8661 | 0.8553 | 0.8598 | |
| Decision Tree | 0.9298 | 0.9178 | 0.9236 | |
| GBDT | 0.9596 | 0.9575 | 0.9585 | |
| XGBoost | 0.9340 | 0.9321 | 0.9329 |
This design choice contrasts with other GNNs that may utilize more complex or multi-year datasets. Despite its straightforward structure, our model achieves a high recall of 0.9287 and an F1-score of 0.9017, demonstrating effective transaction detection capabilities. This performance is particularly notable given the model’s streamlined nature, which not only facilitates understanding and implementation but also enhances the replicability of our research.
The high recall indicates that our model effectively minimizes false negatives—critical for applications requiring stringent security measures such as financial transaction monitoring. Although the precision of 0.8935 does not surpass all other GNN models, it remains competitive, especially when considering the model’s reduced complexity and narrower data scope.
Moreover, the consistent high average maximum probability across training epochs reinforces the reliability of the model’s outputs. This metric, crucial in a softmax output framework, confirms that the model’s predictions are statistically robust, not merely the result of overfitting or underfitting.
Our approach prioritizes transparency and ease of replication, from the comprehensive ETL process to the clear delineation of the modeling steps. This not only supports the scientific validity of our findings but also provides a template for future research, encouraging other scholars and practitioners to replicate and extend our work. The model’s adaptability, coupled with its robust performance, offers significant insights into the potential for using simplified GNN models in complex transaction networks.
4.4 Temporal Scope
The decision to limit the graph construction to data from the year 2022 can be substantiated, and the results better understood, by an analytical study of the network’s evolution over the past decade. The supporting evidence lies within the structural dynamics of the Bitcoin network, as revealed through a detailed analysis of network size and metrics. A descending trend in the number of nodes and edges over the years was observed (Figure 6), with the 2022 graph exhibiting a smaller yet more value-concentrated network.
This trend indicates a move towards higher transaction values being processed through a reduced number of addresses, resulting in a denser and more interconnected network structure. The 2022 network demonstrates an increase in average degree and network density (Figure 7), indicating a more interconnected graph structure with nodes having more direct connections on average.
This increased degree of interconnectivity within a smaller network aligns with the observed enhancement in model performance metrics, suggesting that the more recent and concentrated network structure provides a potent ground for the application of GAT. The optimized model performance in the 2022 network is further corroborated by the re-training of the model using all previous yearly graphs and plotting precision, recall, and F1 score metrics. These metrics collectively suggest that the GAT model is particularly well-suited to a network that has evolved to be more transactionally value-dense and concentrated in influence.
The distilled analysis leads to a better explanation for the selection and results of the 2022 graph as the foundation for the GAT model application within this study. The pronounced concentration of transactional value and connectivity in the latest graph provides an enriched dataset that likely contributes to the improved performance of the classification model.
Future research may delve into the implications of these evolving network characteristics, particularly examining the impact of increasing concentration on the efficacy of transaction pattern analysis tools and their utility in monitoring and regulating digital currency flows.

