


 nueva página del texto (beta)
 Inglés (pdf)
 Artículo en XML
 Referencias del artículo
 Enviar artículo por email
 Citado por SciELO
  Similares en
SciELO
Similares en
SciELO 
 Permalink
1 Introduction
Cardiovascular disease (CVD) is the leading cause of death worldwide, accounting for more deaths than any other known cause. Approximately 80% of these CVD deaths occur in low- and middle-income countries [6]. Early detection, followed by timely treatment of these diseases, has been crucial to preventing premature deaths in higher-income countries.
In this regard, one effective and accessible way to identify potential cardiovascular problems is through the use of electrocardiogram (ECG) signals. These signals, which record the electrical activity of the heart, provide relevant information about how the heart functions.
By detecting irregularities in heart rhythm or electrical conduction, the ECG can alert to conditions such as arrhythmias, myocardial infarctions, and other cardiac disorders that allow healthcare professionals to intervene quickly, providing appropriate treatment that can help prevent serious complications and improve the patient’s cardiovascular health [9].
In this regard, advanced machine learning-based classifiers have been developed and applied for the diagnosis of several conditions by using ECG signals [22]. One of the main problems with the performance of these techniques is the always-present noise acquired due to the nature of their signal acquisition. This scenario hinders the correct classification, even when using robust algorithms.
These artifacts distort the most important features of ECG signals, making accurate identification and interpretation difficult. High levels of noise lead to poor quality data that confuses the model during both training and prediction phases, potentially resulting in misclassifications, such as false positives or false negatives [3].
Additionally, noise can introduce misleading patterns that mimic certain arrhythmias or normal beats, and if present in the training data, can cause the model to overfit to these noisy patterns, reducing its ability to generalize to cleaner data. Relevant work has been done on the preprocessing and denoising of ECG signals [17], given its importance in the accuracy of classification models [20].
Noise in ECG signals can come from multiple sources, such as electromagnetic interference or patient movements [8], which can obscure essential signal features crucial for accurate classification. Most of these databases have already been preprocessed to improve the quality of ECG signals.
However, when developing embedded systems for processing this type of signal, it is observed that these signals are in their original state, that is, without preprocessing and affected by various types of noise, including artifacts. To design a robust system to process these signals, it is essential to simulate the conditions in which they are captured, that is, in their pure state.
According to [21], this is achieved by adding noise to the database signals, thus emulating the artifacts present in the signal capture stage. Once this process is done, preprocessing and classification techniques can be applied. It is proposed to use wavelet transforms for denoising, as presented in [1].
In addition, the use of metaheuristic algorithms to find the optimal threshold for these transforms, such as the particle swarm (PSO) used in [16], is proposed, which allows a finer and adaptive adjustment of the threshold, improving the system’s ability to effectively remove noise without losing important signal information.
In this research, a proposal to improve the efficiency of ECG signal classification by focusing on the denoising stage is presented. First, the Wavelet denoising technique performance is improved by applying a metaheuristic technique to find the optimal denoising value when denoising a publicly available dataset.
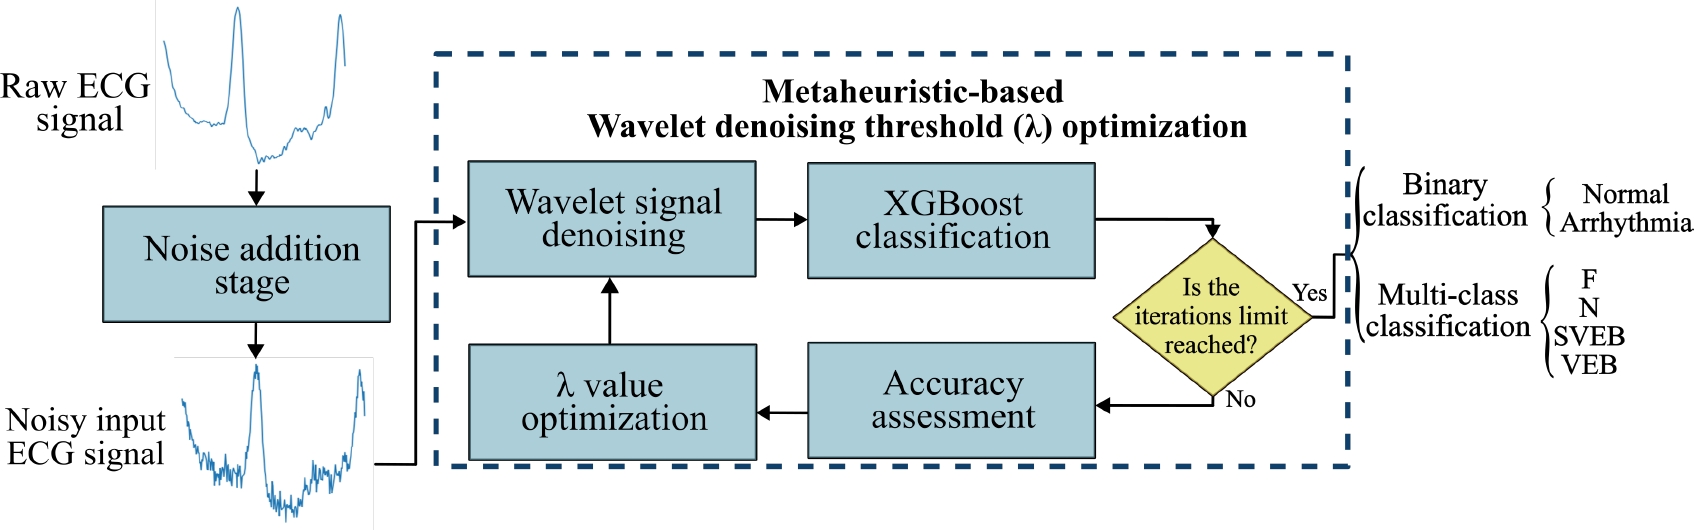
The denoised signals are then classified using the Extreme Gradient Boosting (XGBoost) algorithm to achieve both binary classification (normal vs. arrhythmias) and multiclass classification (Normal (N), fusion (F), supraventricular ectopic beat (SVEB), and ventricular ectopic beat (VEB)).
Different metaheuristic algorithms were tested for a comparison of their performance in this task: Particle Swarm Optimization (PSO), Differential Evolution (DE), and Genetic Algorithms (GA).
This approach allows to evaluate the Wavelet denoise techniques and their hybridization with metaheuristic algorithms for the improvement of the accuracy of ECG signal classification, contributing to a more accurate and reliable diagnosis of cardiac diseases.
2 Preliminar Concepts
This section presents the theoretical aspects underlying this article, which are structured concisely to facilitate the understanding and scope of this article. Starting with a description of the basic aspects related to ECG signals, this section covers Wavelet denoising, the XGBoost classifier, and the metaheuristic algorithms used for the respective tests.
2.1 ECG Signal
An ECG signal is a recording of the heart’s electrical activity, used to study its behavior and detect various cardiac conditions. Although it does not diagnose specific diseases by itself, it provides crucial information to identify conditions such as coronary artery disease, myocardial infarction, cardiac arrhythmias, heart block, ventricular hypertrophy, myocarditis, pericarditis, and congenital heart abnormalities.
The ECG in normal rhythm includes a P wave, a QRS complex and a T wave, each with specific characteristics in duration and amplitude. The P wave marks the beginning of the cardiac cycle, the QRS complex represents the depolarization and repolarization of the heart muscle, and the T wave reflects the final repolarization. The ECG profile varies according to the position of the electrodes, which allows a better appreciation of certain properties of the heart.
2.2 Wavelet Denoising
In general, the wavelet transform decomposes a signal by using the scaled and shifted versions of the selected wavelet. Hence, the wavelet acts as a band pass filter, which only allows the passage of certain components of the signal at a certain frequency [23].
These signals or waveforms have a limited duration and an average value of zero and there are different types of them. The choice of a wavelet will depend on the type of signal to be analyzed, as well as the information to be obtained from it.
In this proposal, the Daubechies wavelets are selected, specifically the Daubechies 4 (db4). These wavelets, based on the work of Ingrid Daubechies [7], constitute a family of orthogonal wavelets that define a discrete wavelet transform and are characterized by having a maximum number of null moments for a given support.
Each type of wavelet in this class is associated with a scaling function (known as a parent wavelet), which generates an orthogonal multiresolution analysis. The db4 wavelet is an orthogonal and biorthogonal wavelet with filters of length 8 and an asymmetric symmetry.
The equations for decomposition and reconstruction using db4 are based on the coefficients of the scaling and wavelet filters. Once the signal is in the wavelet domain, it is then thresholded, so the coefficients are modified and filtered. The thresholding process can be described as follows:
Decomposition: The original signal is decomposed into wavelet coefficients using the wavelet transform and the wavelet db4.
Thresholding: Depending on how it is configured, hard thresholding or soft thresholding can be applied [12]. The soft threshold function sets the specified value of the decomposition coefficient to zero.
This method ensures consistency in the post-algorithm decomposition coefficient but loses some of the high-frequency coefficients that exceed the threshold. Considering:
where
3. Reconstruction: Reconstruct the signal from the thresholded coefficients by applying the inverse wavelet transform.
This
2.3 Extreme Gradient Boosting (XGBoost)
The XGBoost [5] is an algorithm renowned for its efficiency and performance in several machine-learning tasks, especially when working with structured data for classification and regression problems [15]. This technique incorporates gradient descent as the primary optimization step and regularization techniques to prevent overfitting and improve generalization, such as
XGBoost constructs an ensemble of trees and is trained on the residual errors of the combined prediction of all previous trees. This algorithm predicts the target variable for new instances by aggregating the predictions from all trees in the ensemble and provides insights into feature importance, highlighting the most important features in the prediction process. The objective of XGBoost is to minimize the following
where
where
where
The optimization of
2.4 Metaheuristic Optimization
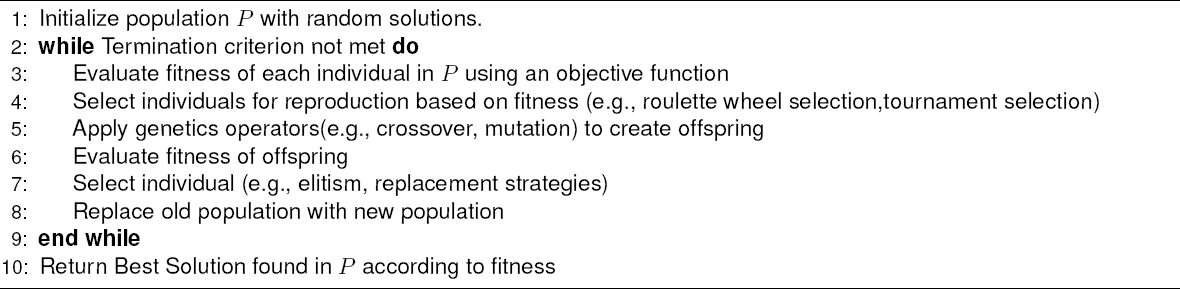
2.4.1 GA
A subtype of evolutionary computing is genetic algorithms (GA). This branch of artificial intelligence focuses on solving optimization problems. The mechanism of genetic algorithms is based on the natural evolution and natural selection of living organisms. The genetic algorithms were developed by John Holland in the 1970s [11]. The algorithm’s pseudo-code is shown in Algorithm 1 to depict the main structure of GA.
2.4.2 DE
DE is a popular optimization algorithm that can solve a wide range of problems [10]. It operates through four main stages: Initialization, Mutation, Crossover, and Selection.
DE is a stochastic population-based search technique sensitive to parameters like crossover rate
– Initialization: In the first phase, a population of candidate solutions is randomly generated within specified bounds. Each solution, represented as a vector
– Mutation: DE implements a perturbation process, producing a mutant vector
– Crossover: Crossover increases population diversity, controlled by the constant
where
2.4.3 PSO
Particle Swarm Optimization (PSO) algorithm simulates a swarm of individuals like a flock of birds [13]. PSO algorithm emulates a collective behavior that, in nature, has two main components: velocity and location targets of food sources. Each individual is a particle in the PSO algorithm, denoted by
Each particle is conformed by considering its current position in the search space (denoted by
In PSO, two knowledge influences are involved: the individual best position
3 Proposed Method
The general scheme of this proposal includes the following: first, noise is added to the dataset above described to emulate real scenarios of ECG signal. Then, this dataset is denoised by the optimized WD (Wavelet Denoising), which implies the optimization of the variable
3.1 Dataset
The MIT-BIH Arrhythmia Database [11] is used for the present case study, developed by the Division of Science and Technology of the University of California, Berkeley, USA. Arrhythmia Database [18], developed by the Health Sciences and Technology Division of the Massachusetts Institute of Technology (MIT) and Harvard University.
The MIT-BIH arrhythmia database contains 48 half-hourly excerpts of two-channel ambulatory ECG recordings obtained from 47 subjects studied by the BIH Arrhythmia Laboratory between 1975 and 1979. Twenty-three recordings were randomly selected from a set of 4000 ECGs from a mixed population of inpatients (about 60%) and outpatients (about 40%) at Beth Israel Hospital in Boston.
The remaining 25 recordings were selected from the same set to include less common but clinically significant arrhythmias that would not be well represented in a small random sample. Two or more cardiologists independently annotated each recording; disagreements were resolved to obtain computer-readable reference annotations for each beat (approximately 110,000 annotations in total) included in the database.
This database was chosen since it is one of the most widely used and recommended by ANSI/AAMI EC57:1998/(R)2008 [2] (AAMI, Association for the Advancement of Medical Instrumentation), which is responsible for specifying and defining the protocol for performing the evaluations to ensure that the experiments are reproducible and comparable.
A total of 15 different classes of heartbeats are identified, which can be organized into two groups NORMAL and ARRHYTMIAS, where the class conforms to the Normal group: Normal (N) with 45,801 beats, and the ARRHYTMIAS group is composed by the classes:
Supraventricular Ectopic Beats (SVEB) with 976 beats, Ventricular Ectopic Beats (VEB) with 3,788 beats, Fusion Beats (F) with 415 beats, and an additional category for unknown beats.
As can be seen, there is an imbalance in the number of beats of the classes and general of the groups of the MIT-BIH database, for this reason, the SMOTE technique [4] was applied. The SMOTE algorithm performs an oversampling approach to rebalance the original training set.
Instead of applying a simple replication of the minority class instances, the key idea of SMOTE is to introduce synthetic examples.
3.2 Noise Addition
The dataset described in Sect. 3.1 is a noise-free set of signals. To prove the robustness of this proposal in noise removal, two common types of noise in these signals are added: electrical and white noise.
One of the most prevalent noises in ECG signal is electrical noise which is typically from alternating current (AC) power lines and appears as a 50 Hz or 60 Hz sinusoidal interference (depending on the local power supply frequency).
On the other hand, by the movement of the electrodes and wires, and the electronic circuitry of the ECG recording equipment, thermal noise and electronic components can also add white noise. The electrical noise
where
where
where
3.3 MAs Parameters Configuration
Due to the variety in the MAs operation nature, each one has an initial parameter configuration. All MAs’ initial parameters were experimentally determined, as presented in Table 1.
Table 1 General and particular parameter settings of the MAs
| Algorithm | Parameter settings |
| General settings | Population size = 10 |
| Maximum iterations = 10 | |
| λ boundaries = [.01, 0.99] | |
| PSO | Inertia weight = 2.0 |
| Personal acceleration coefficient = 2.0 | |
| Social acceleration coefficient = 0.9 | |
| DE | Scaling factor = 0.5 |
| Crossover rate = 0.5 | |
| GA | Crossover probability = 0.5 |
| Mutation probability = 0.9 |
3.4 Performance Metrics
Four metrics are selected to quantitatively assess the performance of the WD optimization: Accuracy, Precision, Recall, and F1 score. First, the accuracy provides a summary measure of the classifier’s performance across both classes. On the other hand, Precision, Recall, and F1 score are crucial for the performance evaluation of the classification model, ensuring high true positive rates, and low false positive and false negative rates. The mathematical definition of these metrics is presented in Eq. 13 through 16:
where True Positives (TP) represent correctly predicted instances of a class, True Negatives (TN) are instances correctly predicted as not belonging to the class, False Positives (FP) are instances incorrectly predicted as belonging to the class, and False Negatives (FN) are instances of the class incorrectly predicted as belonging to another class, whether it is binary or multi-class classification.
4 Result and Discussion
In this section, the performance of the metaheuristic algorithms in the denoising step is presented. These techniques were used for optimal denoising for both binary and multiclass classification. All experiments were carried out using the same dataset distribution and allocation, to perform an equitable analysis.
4.1 Binary Classification
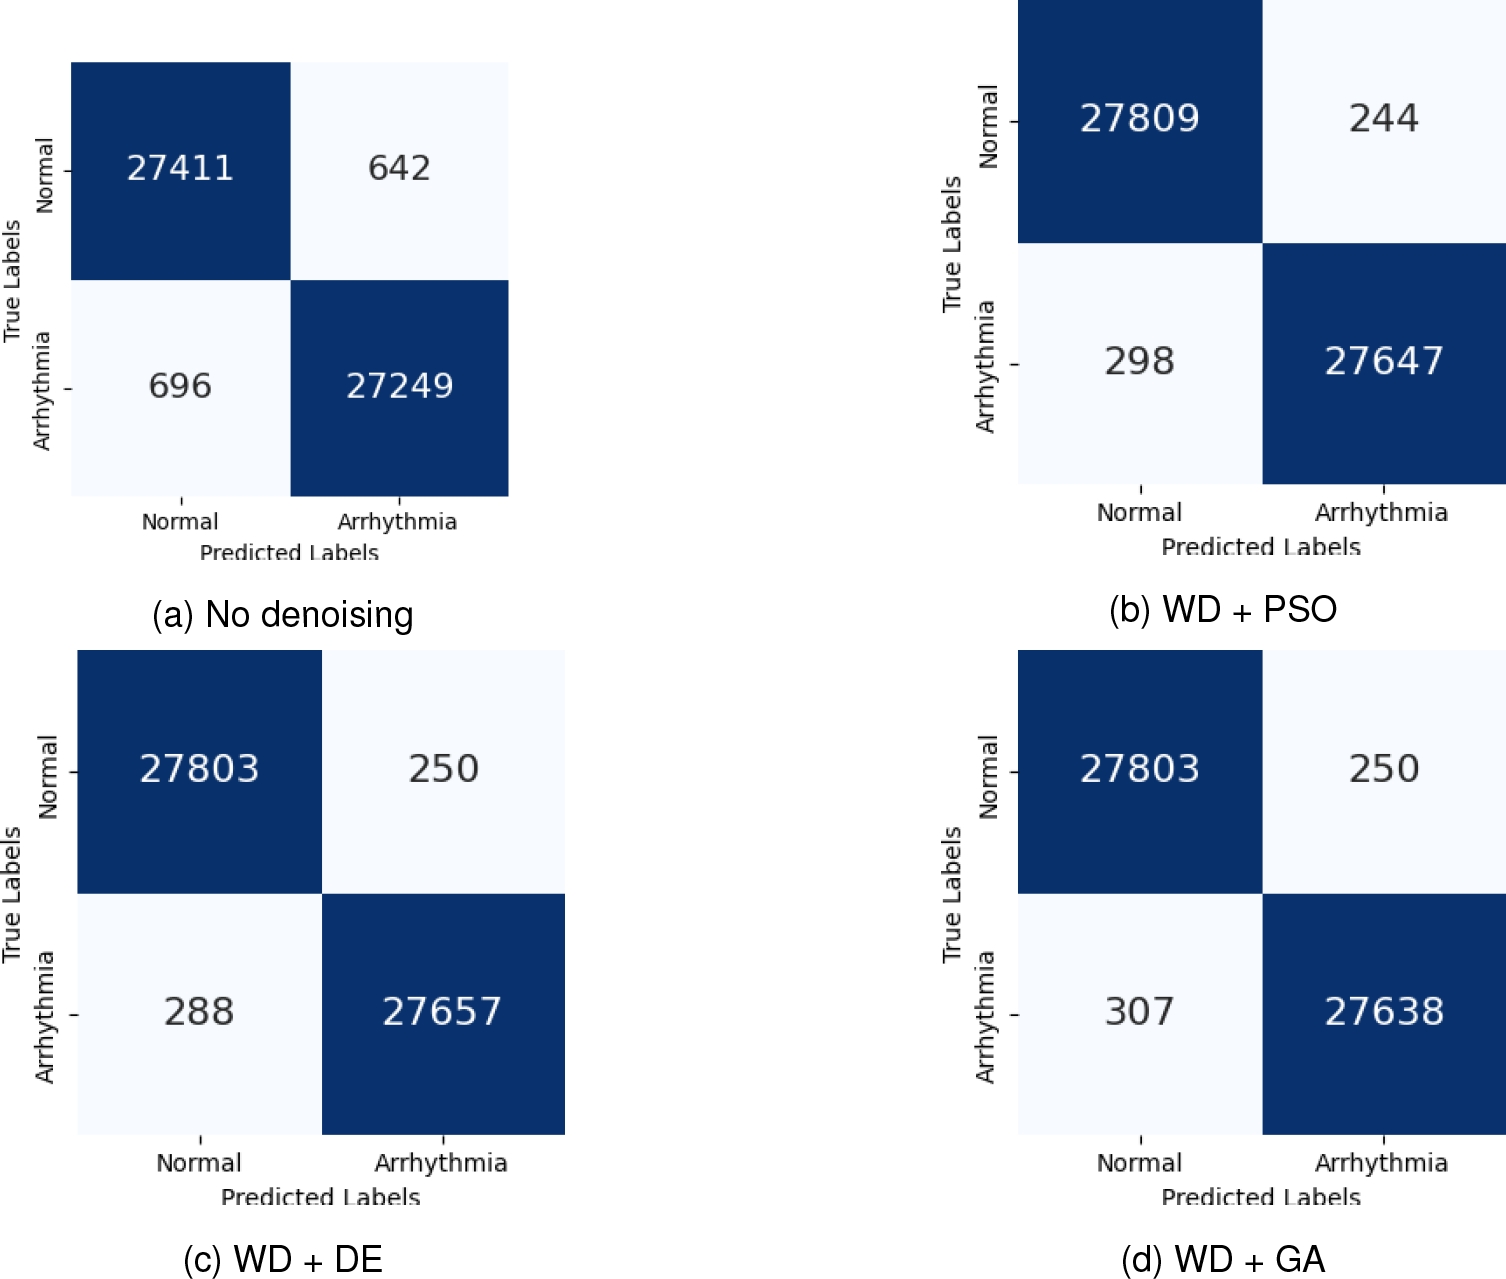
Table 2 presents performance metrics for binary classification of normal and arrhythmia classes, highlighting the highest value for each metric in bold. The XGBoost without denoising achieves high performance in all metrics, with an overall accuracy of 97.61%, but is surpassed by denoising techniques combined with optimization algorithms, where the PSO and DE obtain the same highest accuracy of 99.04%. Specifically, the combination of WD with PSO and WD with DE achieved the highest overall accuracy and F1 scores (99.04%) in the arrhythmia ECG signal, indicating superior performance. The WD + PSO obtains the highest recall and F1 score for the arrhythmia class (99.12% and 99.04%, respectively) and the highest precision for the normal class (99.11%).
Table 2 Performance metrics on binary classification, Accuracy values are expressed in percentages (%)
| Normal | Arrhythmia | ||||||
| Precision | Recall | F1 score | Precision | Recall | F1 score | Accuracy | |
| No denoising | 97.70 | 97.51 | 97.60 | 97.52 | 97.71 | 97.62 | 97.61 |
| WD + PSO | 99.11 | 98.96 | 99.03 | 98.96 | 99.12 | 99.04 | 99.04 |
| WD + DE | 99.10 | 98.97 | 99.04 | 98.97 | 99.11 | 99.04 | 99.04 |
| WD + GA | 99.10 | 98.90 | 99.00 | 98.91 | 99.11 | 99.01 | 99.01 |
While wavelet denoising combined with a genetic algorithm (WD + GA) likewise considerably increases performance, it does not surpass the PSO and DE performance, but it still significantly improves the performance without denoising. Overall, incorporating the WD with optimization algorithms significantly enhances binary classification performance, with PSO and DE showing the best and similar results.
In Fig. 2, the confusion matrix of the binary classification of each proposal is presented. As presented, the PSO provides a lower false positive classification of arrhythmias, while DE a lower false negative of normal beats.
4.2 Multi Class Classification
The data in Table 3 shows the performance of multi-class classification for N, F, SVEB, and VEB. The highest values for each metric are bolded. The XGBoost without denoising reaches an overall accuracy of 97.89%, which is outperformed by denoising methods hybridized with optimization algorithms.
Table 3 Performance metrics on multi-class classification, Accuracy values are expressed in percentages (%)
| No denoising | WD + PSO | |||||||
| Precision | Recall | F1 score | Accuracy | Precision | Recall | F1 score | Accuracy | |
| F | 99.05 | 98.00 | 98.52 | 97.89 | 99.45 | 99.50 | 99.47 | 99.12 |
| N | 97.98 | 98.30 | 98.14 | 99.20 | 99.19 | 99.19 | ||
| SVEB | 95.91 | 96.41 | 96.16 | 98.29 | 98.39 | 98.34 | ||
| VEB | 99.31 | 98.45 | 98.88 | 99.69 | 99.56 | 99.63 | ||
| WD + DE | WD + GA | |||||||
| Precision | Recall | F1 score | Accuracy | Precision | Recall | F1 score | Accuracy | |
| F | 99.54 | 99.43 | 99.49 | 99.11 | 99.43 | 99.56 | 99.50 | 99.09 |
| N | 99.18 | 99.18 | 99.18 | 99.14 | 99.18 | 99.16 | ||
| SVEB | 98.20 | 98.43 | 98.31 | 98.20 | 98.31 | 98.25 | ||
| VEB | 99.73 | 99.53 | 99.63 | 99.77 | 99.44 | 99.61 | ||
The WD + PSO combination achieves the top overall accuracy of 99.12% and exhibits substantial enhancements across all metrics compared to no denoising. Furthermore, WD + DE demonstrates great performance with the highest overall accuracy of 99.11%.
Although WD + GA notably enhances performance compared to no denoising, it falls short of WD + PSO and WD + DE results. In essence, the WD denoising paired with optimization algorithms, especially PSO and DE, boosts XGBoost’s performance in multi-class ECG signal classification.
This enhancement is reflected in higher accuracy, precision, recall, and F1 scores across different classes compared to scenarios without denoising. On the other hand, in Fig. 3 the confusion matrices of multiclass classification are presented.
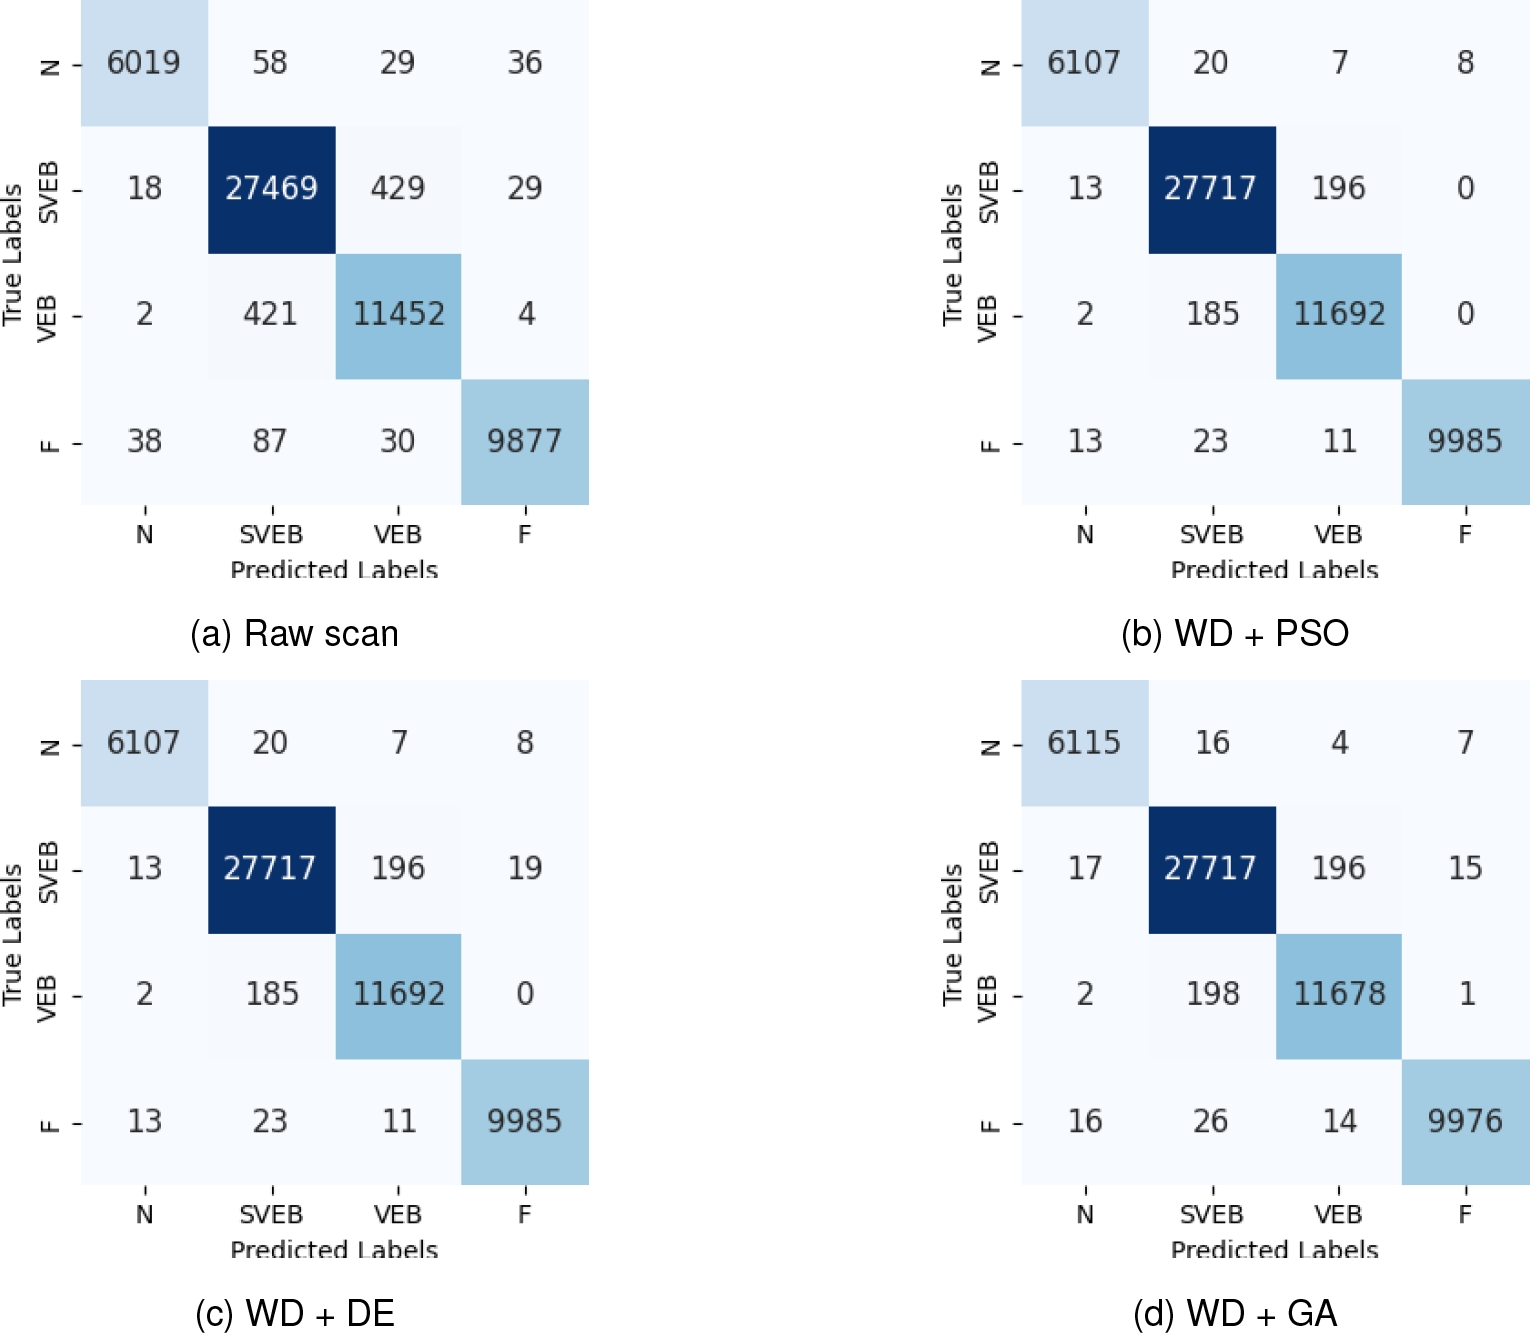
As can be seen, WD + GA presents a better N classification than WD + PSO and WD + DE performance but falls in the SVEB and VEB performance. For visual analysis of the result of the noise/denoising process, Fig. 4 presents an example of the original signal, its noise-added version, and the optimal denoised signal.
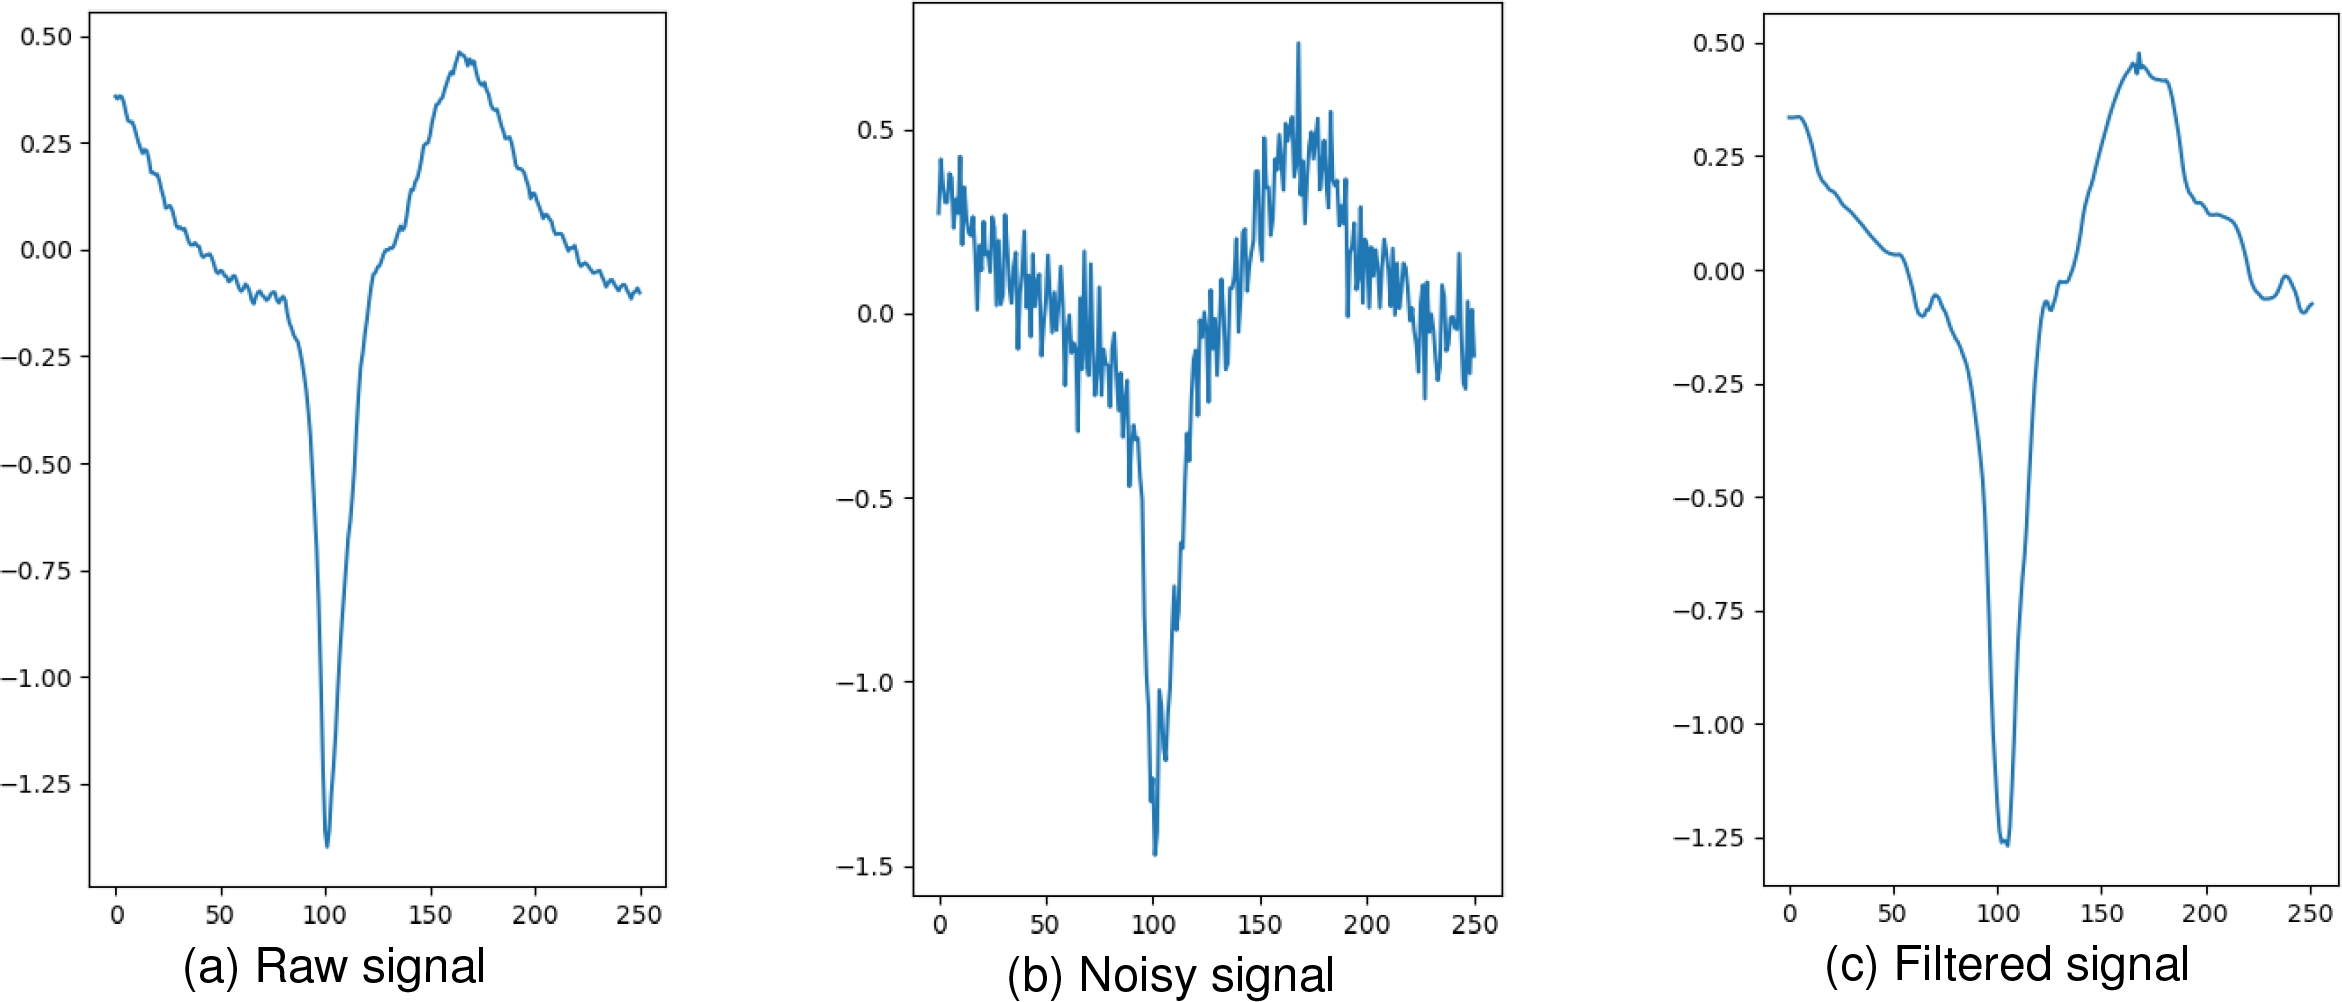
As observed, the denoised signal keeps the original slopes of the ECG, while removing high-frequency components. This best threshold
5 Conclusions and Future Work
This study developed an optimized Wavelet denoising through metaheuristic techniques combined with XGBoost to classify ECG beats using the MIT-BIH database. Noises were added to these signals to simulate real conditions of direct patient acquisition, including typical artifacts present during measurement.
Subsequently, Daubechies wavelets (db4) were applied for signal denoising. The selection of the threshold of the wavelets, which was the target variable in our approach, was optimized using metaheuristic algorithms such as PSO (Particle Swarm Optimization), DE (Differential Evolution), and GA (Genetic Algorithm).
The results show that the use of db4 wavelets combined with metaheuristic optimization techniques significantly improves the quality of the denoised signals, which in turn allows better performance of the XGBoost convolutional network model in ECG beat classification.
Among the metaheuristic algorithms used, PSO presented the best results, closely followed by DE and, finally, GA. However, compared to XGBoost without denoising, the system improves considerably when wavelets are applied.
This approach demonstrates the effectiveness of integrating advanced signal processing methods and machine learning techniques to improve accuracy in diagnosing cardiac arrhythmias, even in the presence of noise and artifacts.
This methodology can be extended and applied to other types of wavelets and classifiers, offering considerable potential for developing robust artificial intelligence-assisted medical diagnostic systems. In future work, the following lines of research and development are contemplated:
– Exploration of Metaheuristic Algorithms: Extend the research by testing a wider variety of metaheuristic algorithms to optimize the threshold parameters in the denoising algorithm using wavelets.
-
– Statistical Analysis: Propose the implementation of rigorous statistical analyses, such as Friedman or Holm tests, to more accurately assess significant differences in the performance of different metaheuristic algorithms applied to ECG signal denoising.
– Evaluation of Different Types of Wavelets: Experiment with other types of wavelets, such as Symlet (sym) wavelets and various additional Daubechies wavelets, as performed in [14]. This comparison will allow us to determine which is most efficient for the problem at hand.
– Evaluation With Different Types of Simulated Noises: Analyze the performance of the algorithm with the addition of different types of simulated noise, not just white Gaussian noise, that much more accurately emulate the types of real artifacts that affect the quality of ECG signals. This inclusion will allow the robustness of the algorithm to be evaluated in more realistic scenarios.
– Application of Alternative Classifiers: Test with other classifiers to evaluate how they influence the performance of the overall system. Comparison of different classification approaches will help identify the most suitable for the specific task.
These research directions will contribute to a more complete understanding and continuous improvement of the signal denoising and classification process, optimizing both the selection of wavelets and the classification methods used.

