


 nueva página del texto (beta)
 Inglés (pdf)
 Artículo en XML
 Referencias del artículo
 Enviar artículo por email
 Citado por SciELO
  Similares en
SciELO
Similares en
SciELO 
 Permalink
1 Introduction
According to reports in 2019, one in eight people (≈970 million) suffered from a mental disorder [19].
Although studies are being conducted to develop pharmacological treatments, gaps remain in our understanding of neuron physiology. It is crucial to comprehend physiology to grasp normal brain function and mental illness. One technique to comprehend neural physiology is electrophysiology, which requires an experimental protocol to visually analyze and select neurons under a microscope [7, 5].
Currently, microscope images can be observed through the lens and digitized by a camera for analysis on a computer and further process. Nevertheless, the quality of microscope images is affected by factors such as the experimental environment, inherent sample characteristics, and illumination, in which live neurons are particularly sensitive [2, 11]. Also, observing live neurons requires them to be set in a liquid solution, interfering with the definition of acquired images.
The type of microscope is also essential in acquisition. While using advanced devices, such as immersion microscopes, fluorescence microscopes, focused ion beam/scanning electron microscopy (FIB/SEM), confocal microscopes, and bright-field microscopes, among others [17, 16, 6], offer a potential solution, they increase costs significantly, and few laboratories have one. Light microscopes are commonly employed because of their low cost, but their limited resolution makes it challenging to visualize individual neurons and their fine structures. Since neurons are the basic units of the nervous system, it is essential to study characteristics such as morphology to understand their function in trees (sets) and isolation [30]; electrophysiological characteristics, synaptic connectivity, and the ability to process information are also of interest [31].
One of the main challenges in studying neurons is the variability of biological samples (images) and the need for available databases [29]. For this reason, computational tools are relevant to carry out a neuroanatomy analysis that allows investigation of the effects of local geometry on the neuroanatomy [1].
In addition, low-resolution is a relevant factor when automatizing tasks such as neuron segmentation, mainly because of their sensitivity to the noise in the samples. Automatic analysis could also help with misinterpretation of structures, e.g., artifacts caused by the staining process and bias due to subjective interpretation when trying to differentiate among neuron types.
Several works that automate neuron analysis in microscopy images have been reported. Radojevic et al. focused on developing a method for detecting and characterizing critical points, such as junctions and terminations, in fluorescence microscopy images of neurons. The proposed method was developed for the purpose of digital reconstruction of neuronal cell morphology.
This process is crucial for understanding the functionality of neuronal networks [25]. Liu et al. [13] analyze cell images that a lens-free imaging system captures. The obtained images have lower resolution than those collected by traditional light microscopes.
They propose an approach based on a convolutional neural network (CNN) that effectively segmented the cells without requiring manual parameter adjustments, reaching an accuracy of 96%.
Another approach uses the Baysor algorithm, which optimizes cell segmentation based on multiple sources of information that complement information about cell boundaries, such as the spatial density of molecules within the cell, the transcriptional composition of local molecular neighborhoods, and additional information from stainings for nuclei, cell bodies, or cellular membranes.
Even the use of CNNs such as U-Net++ has been proposed for counting neurons in HE-stained histopathological samples [32]. Obtained segmentation allows individual cells in a tissue to be accurately identified and delineated, essential for analyzing gene expression at the cellular level and understanding cellular heterogeneity in a spatial context [23].
The segmentation of images of live cells presents complications in obtaining a high segmentation precision. Even some studies with dead cells previously prepared and fixed for visualization have shown complications even when using recent segmentation techniques.
In [14] proposed using CNNs based on the U-net architecture to segment cells in light sheet microscopy (LSM) images of mouse embryos. The tissue segmentation achieved a macro-average F1-score of 0.84, whereas the inter-observer value was 0.89. The cell segmentation achieved a DSC of 0.57 and 0.56 for nuclear-stained and pHH3-stained images, respectively.
Recently, a method to segment live cells in low-resolution images was reported [10] where Automatic Enhancement Pre-processing (AEP) with Automatic Weighted Ensemble Learning (AWEL) was proposed to improve cell image segmentation using deep learning techniques.
This work highlights the crucial effect that image quality has on the obtained segmentation accuracy. The AEP+AWEL method obtained an SCD of 73.84% in mouse liver cell images obtained by absorption microscopy.
On the other hand, the U-NTCA approach, which combines nnUNet and a nested transformer with channel attention, was proposed for corneal stromal cell segmentation [34] obtained by confocal laser scanning microscopy (HRTIII).
These images present challenges in terms of quality due to uneven illumination. The segmentation results were a Dice of 86.42% for normal cells, 79.33% for cells eroded by viruses, and 73.57% for cells with keratoconus.
Light microscopy images present challenges regarding image quality from various sources related to the camera, the optical setup, and the medium through which the neuron is observed.
In addition, illumination is a relevant factor since live neurons are sensitive to high light levels; therefore, low radiometric resolution and contrast are common in this type of image.
This study comprises the generation of an initial dataset of live neurons since no similar dataset was found available. The aim is to obtain automatic segmentation of a particular type of cell, live pyramidal neurons, due to their crucial role in the functioning of the cortex and their potential implications for consciousness [26].
Edge detectors rely on mathematical operations that are sensitive to data variations in an image, including both real edges and unwanted noise [12]. Therefore, their application on highly noisy images is not recommended.
Since this specific case of interest is addressed over an initial low-resolution dataset, two approaches were tested: a methodology with traditional computer vision techniques and the U-Net Convolutional Neural Network.
The results demonstrate that, despite the low resolution and high noise levels, it is possible to eliminate artifacts and segment the neuron area. The evaluation was performed using the Dice similarity coefficient, and the results were competitive with the closest study reported.
2 Methods
In this section, two proposals are presented to segment NP-CPF in low-resolution images. The first one explores common computer vision techniques, and the second one is a convolutional neural network focused on medical images due to its high precision.
2.1 Classical Image Segmentation
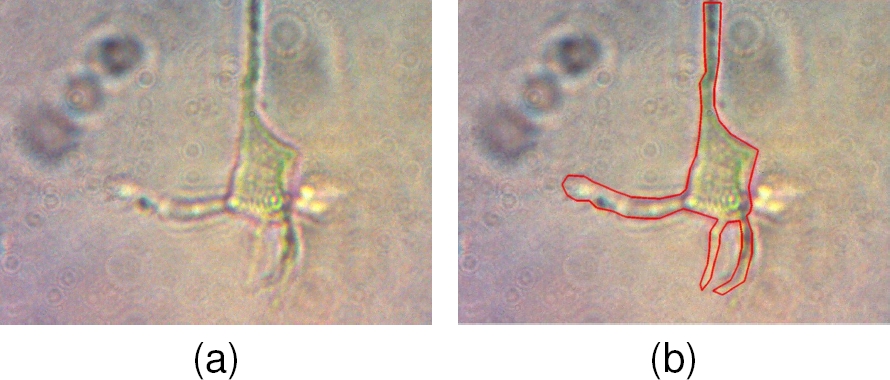
The microscope images are often affected by different noise sources, such as impurities from the microscope, the sample preparation that may contain residues of other neurons or elements of the experimental setup. The latter since the optical path to capture the image included a light source, space (air), the petri dish, neurons fixed to the bottom of the petri dish, the aqueous medium where neurons are kept alive, and the camera. All these factors interact in the sample acquisition of an inverted light microscope generating low-definition images (Fig. 1a). Then, it was necessary to use image processing techniques to obtain a neuron segmentation close to the ground truth (Fig. 1b).
2.1.1 Noise Attenuation
The neuron covers a region of interest (ROI) usually located in the center of the observation field since it is a large cell type with a main body (soma) from which thin elements (dendrites) extend. The original images (Fig. 1) present a general intense speckling noise that must be attenuated to get more uniform regions that help segmentation.
Also, some artifacts corresponding to residues of other cells or impurities of the microscope are also presented. The noise level may not stand out at first sight in the gray level image, but when it is plotted with a high contrast color palette as a 3D surface (Fig. 2a-b), it is observed how the noise is affecting the ROI definition.
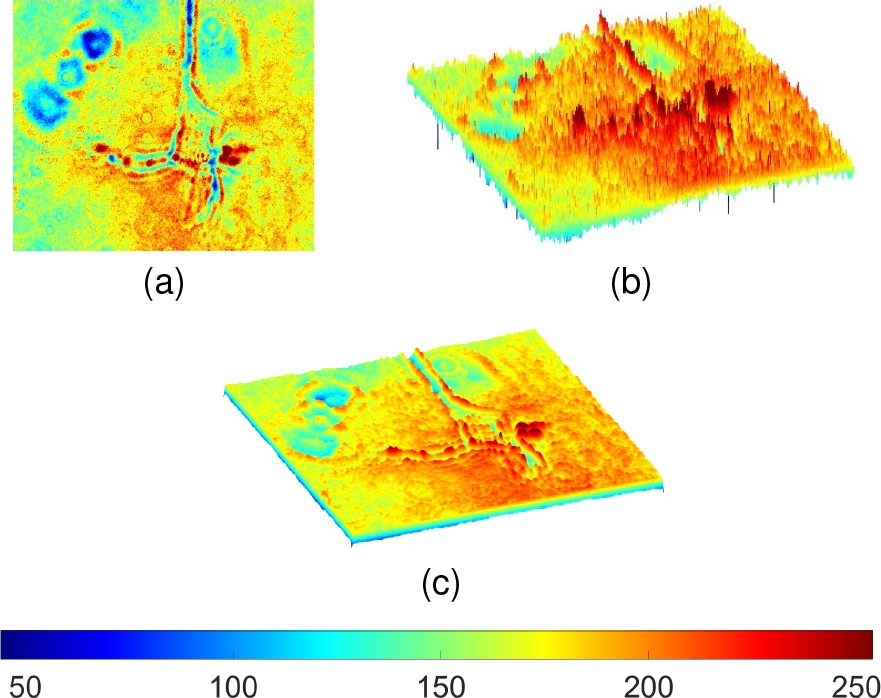
Fig. 2 Representation of Fig. 1 as a 3D surface with a high contrasting color palette in a) Frontal and b) Lateral view, where the high variations of value (noise) in the image are observed and then c) attenuated with a Gaussian filter. The color palette corresponds to a mapping of gray levels
It seeks to reduce noise and homogenize regions without significantly attenuating edges defining the neuron region. Then, a Gaussian filter [20] was applied as a pre-processing step. In this way, the noise is reduced by the influence of the surrounding pixels, allowing to have more homogeneous areas.
2.1.2 Entropy Filter
The texture of an image quantifies the spatial variation of intensity values in an image under some descriptor. It was observed that neurons tend to have a higher texture than the rest of the image. The texture information can then be used to obtain a raw segmentation of the ROI. Entropy is a statistical measure related to the randomness or disorder level of the elements. In digital images, a higher variation (disorder) in values is associated with higher texture in a region, while low variation indicates more homogeneity.
Therefore, entropy can be used to describe the texture in the image and is computed as Eq. 1; where
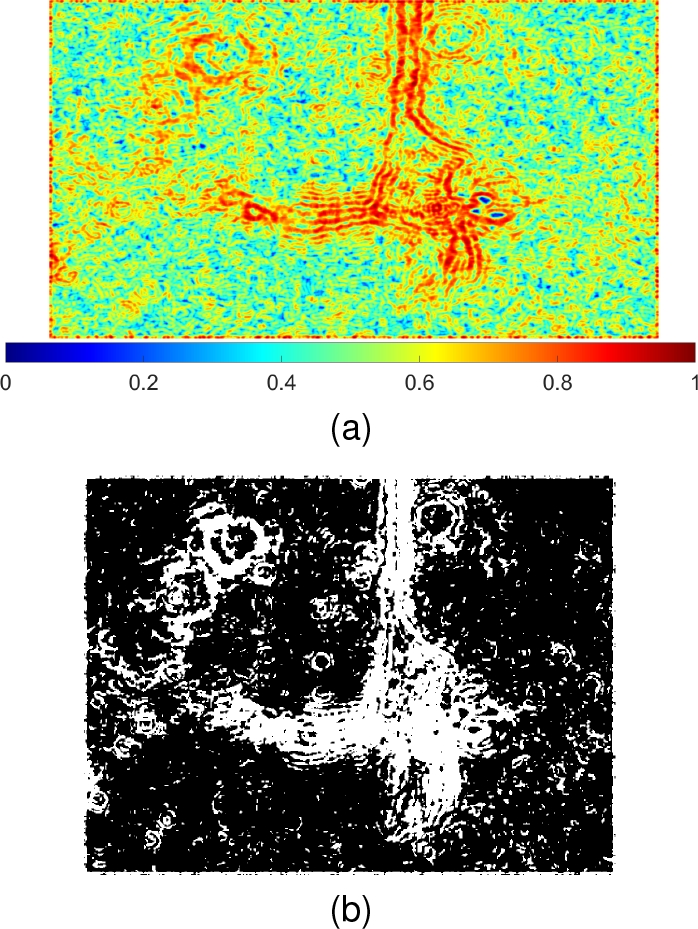
Although that background is observed as noisy, the difference among its pixels is not as large as that among pixels in the edges of the neuron. As observed in Fig. 3, the local entropy was higher in the interior of the soma and inside dendrites.
Therefore, an automatic threshold helps to separate most of the neuron area from the rest of the image [21, 18]. However, many small regions around the neuron remain and must be removed (Fig. 3b).
2.1.3 Mathematical Morphology
Mathematical morphology is a technique used to analyze images through a specific shape called a structural element. There are two basic operators: erosion and dilation [8]. Erosion reduces the area of an element in the image and can be used to eliminate small elements or artifacts that are not part of the ROI. However, the inner spaces in the neuron (Fig. 3b) could be increased with erosion, causing a separation of its regions.
A dilation was applied to avoid this effect, which increased the area of the elements. In this case, the combination of both operations results in a composed operation called opening that restores the erosion effect with a dilation, connecting some edges and filling small spaces.
A circular structural element was used in both operations. Fig. 4a shows that noise structures were removed, remaining only the more significant elements. Since the field of observation is centered over the neuron, this is the largest remaining element in most images. Thus, the area of all elements in the image was calculated and filtered to preserve only the larger one (Fig.4b).
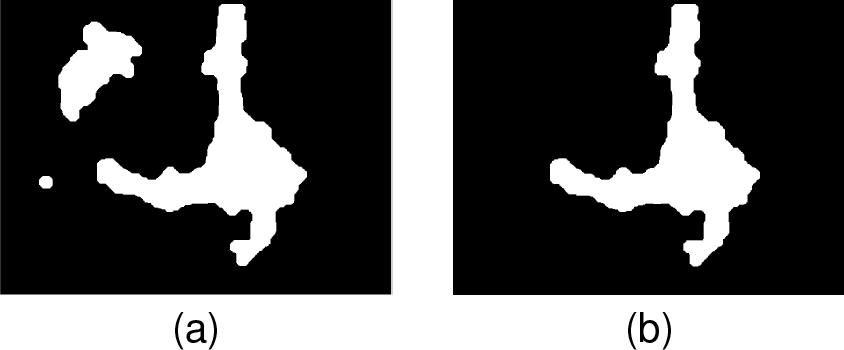
In this way, the neuron was segmented by using basic image processing techniques.
2.2 Convolutional Neural Network: U-Net
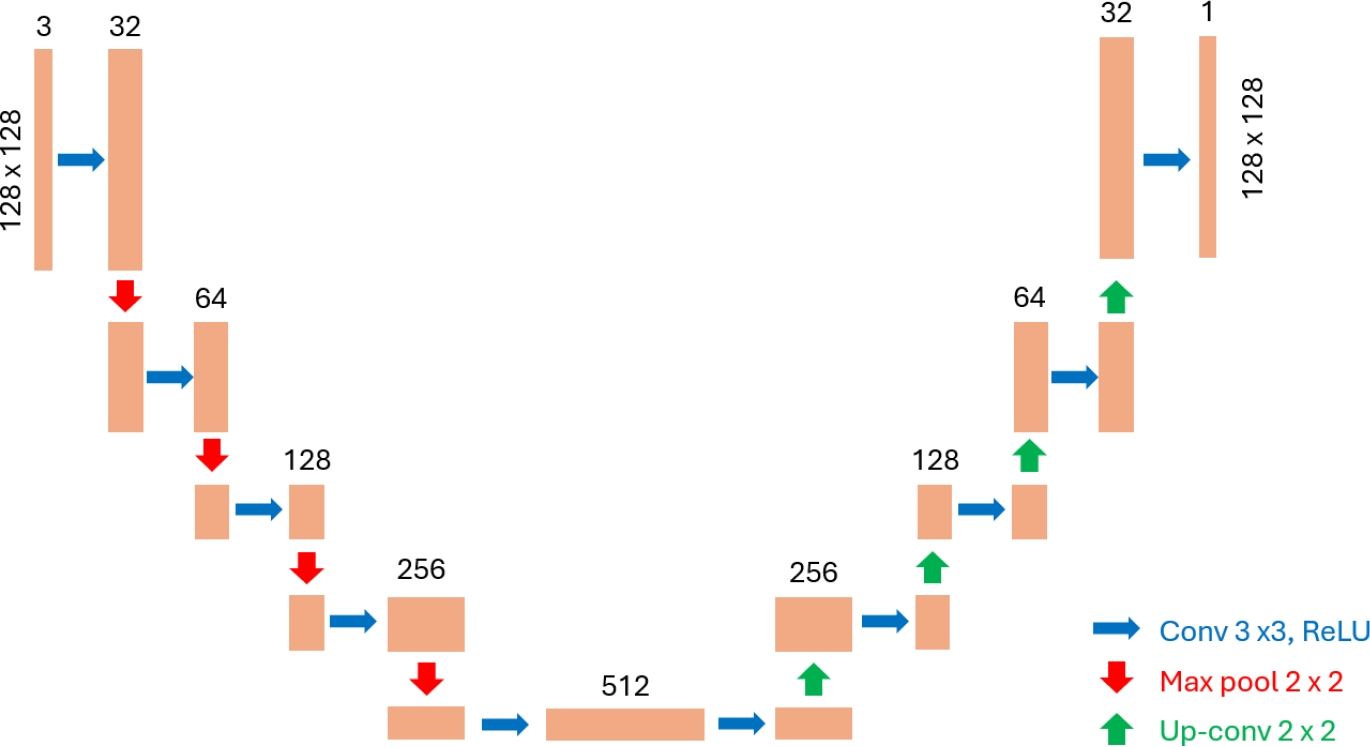
The U-Net architecture has proven highly effective in medical image segmentation due to its ability to capture context information and enable precise localization [22]. The second approach to segment low-resolution images was implementing a U-Net architecture, a convolutional neural network (CNN) widely utilized for image segmentation tasks.
As seen in Fig. 5, the model architecture consists of an encoder comprising five convolutional blocks with ascending filter sizes (32, 64, 128, 256, 512) and max pooling layers employing a stride of 2, each employing a 3×3 kernel, ReLU activation, and same padding; a decoder, with four convolutional blocks employing descending filter sizes (256, 128, 64, 32) and upsampling layers using a stride of 2, similarly configured to the encoder; an output layer consisting of a final convolutional layer with a 1x1 kernel, sigmoid activation, and same padding, yielding a probability map with one channel (binary image).
The model was compiled with the Adam optimizer, sparse categorical cross-entropy loss function, and accuracy metrics. A custom callback was also introduced to halt training when the loss value reached 0.01 or lower.
Overall, this architecture is tailored to address image segmentation, aiming to predict class labels for individual pixels in input images.
2.3 Dice Similarity Coefficient
The Dice similarity coefficient (DSC) computes the overlapping ratio between the predicted result and ground truth. It varies in the range [0,1], where 1 indicates a perfect overlap between the obtained segmentation and the ground truth, and 0 indicates no overlap at all. The formula to calculate the DICE Index, also known as the Dice Coefficient, is as follows:
where
3 Experimental Results
The digital images were acquired from an inverted microscope with a magnification of 40x (Fig. 6a) and saved in JPG format with dimensions
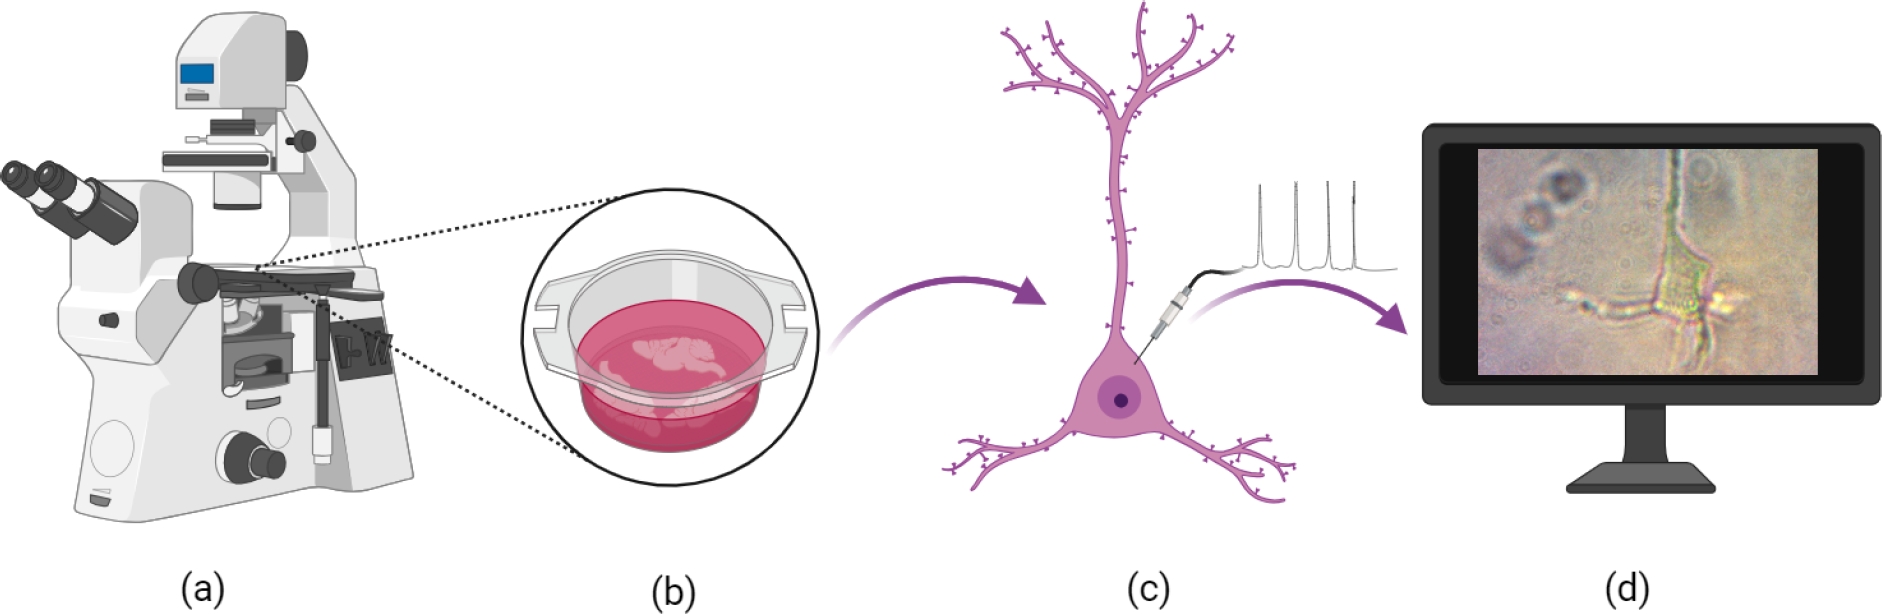
Fig. 6 Sample acquisition: a) Inverted microscope, b) The biological samples obtained after extraction from the brain tissue, c) Isolated neurons in the petri dish, and d) Its digital acquisition
The Claude Bernard Biotery of the Benemérita Universidad Autónoma de Puebla (BUAP, México) provided de biological models and performed the neuron extraction. All procedures followed the Official Mexican Standard for the care and use of laboratory animals (NOM-062-ZOO-1999). Biological-infectious hazardous waste was managed following the NOM-087-ECOL-SSA1-200 standard.
The Neuromodulation Laboratory of the BUAP-Institute of Physiology performed the experiments, generating an initial database with images of rat neurons of different types, such as Pyramidal Neurons from the Prefrontal Cortex (PN-PFC), Dopaminergic Neurons from the Ventral Tegmental Area (DN-VTA), Medium Spiny Neurons (MSN), Cholinergic Giant Neurons (CGN), and Pyramidal Neurons from Hippocampus (PN-H) (Fig. 6d). For the purposes of this study our database will contains only 150 NP-PFC images, which were acquired from a microscope as described above. Likewise, each image has its own groundtruth. These ground truth was created from a hand-drawn outline by the neuroscientific team of the BUAP, who delimited the area of interest in each image.
The result is a binary image, where white represents an ideally segmented neuron and black corresponds to the rest of the image. Fig. 6: Sample acquisition: a) Inverted microscope, b) The biological samples obtained after extraction from the brain tissue, c) Isolated neurons in the petridish, and d) its digital acquisition.
As previously outlined, this study focuses on neuron segmentation to automatize the process and help the expert to speed up the identification and size estimation, which is correlated with neuron diameter.
Such measurements are crucial in live cell culture investigations, providing insights into physiological and pathophysiological phenomena [33]. Understanding the morphology of individual neurons facilitates nuanced analyses of their interactions and contributions within biological neural networks [4].
The two presented approaches were tested using a dataset of 150 images of PN-PFC neurons without any preprocessing and their corresponding groundtruth. The neurons span almost the entirety of the images, prohibiting dataset augmentation through cropping. An experiment of 5-fold cross-validation approach was adopted, allocating 70% of the images for training and 30% for validation.
During training, images were resized to 128×128 pixels to facilitate U-Net training, while traditional segmentation techniques were conducted at the original image size. The Dice coefficient of segmented images in the validation sets was compared for both approaches.
Fig. 7 shows the obtained results and their comparison. The first column contains some examples of neurons in the dataset. As observed, there are variations in the illumination due to the expert’s attempt to improve image contrast without reaching a level that affects them. Then, in general, images do not have high contrast.
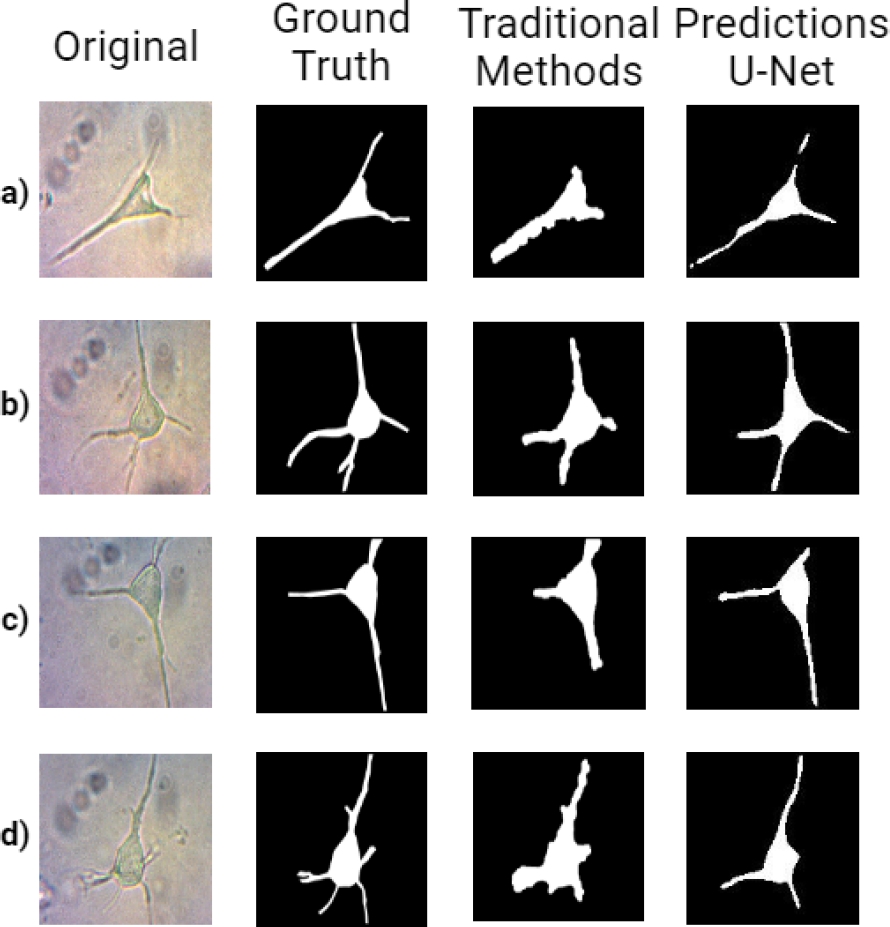
Fig. 7 From left to right: Original neuron samples from the dataset, their corresponding groundtruth, segmentation with the traditional approach and with u-net
Also, the presence of remains of cellular structures and noise around the neuron is observed. The difference among types of dendrites is that some are thick and clearly defined, and some are thin and difficult to perceive. The second column shows the corresponding ground truth where the expert marked the relevant neuron areas, which is used as a reference to evaluate the obtained segmentation.
The segmentation results with a traditional approach are shown in the third column. Most of the neuron soma was correctly segmented, although it presented limitations in dendrites. Dendrite sizes are varied, and their connection with the soma could be affected when opening or area filtering is applied, causing the final segmentation not to include part of them.
Also, when dendrites are close, they are segmented as one. Low contrast generated by dim lighting significantly affected dendrites segmentation. On the other hand, the segmentation with U-Net showed a more integral segmentation even when the illumination varies.
However, in some cases, a) segmented dendrite disconnects from the soma, and b) if some artifact is near enough to dendrite, it can be segmented as part of the ROI. The DSC was calculated to assess the results, obtaining an average of 0.69±0.06 with the traditional approach and 0.73±0.07 with U-Net in raw images.
Also, the experiment was done using as input for U-Net the preprocessed images with the Gaussian and entropy filters; for this experiment, the result was 0.73±0.04, showing that there was no significant change by including the preprocessing. One of the purposes of neuron segmentation was the automatic estimation of the size. The size of neurons is relevant in electrophysiology studies because the study population must contain similar morphological properties. It is possible to estimate the area with the capacitance of the neuron thanks to the physical constant that establishes that the thickness of the lipid bilayer is
Nevertheless, this process of measure implies direct contact with the neuron, which is a complex process and sometimes kills the neuron before obtaining a result. To estimate the neuron size, the image of a circular mark engraved with a high-precision laser in a slide was acquired at the same magnification as the images from the database (40x) and taken as a reference (Fig. 8).
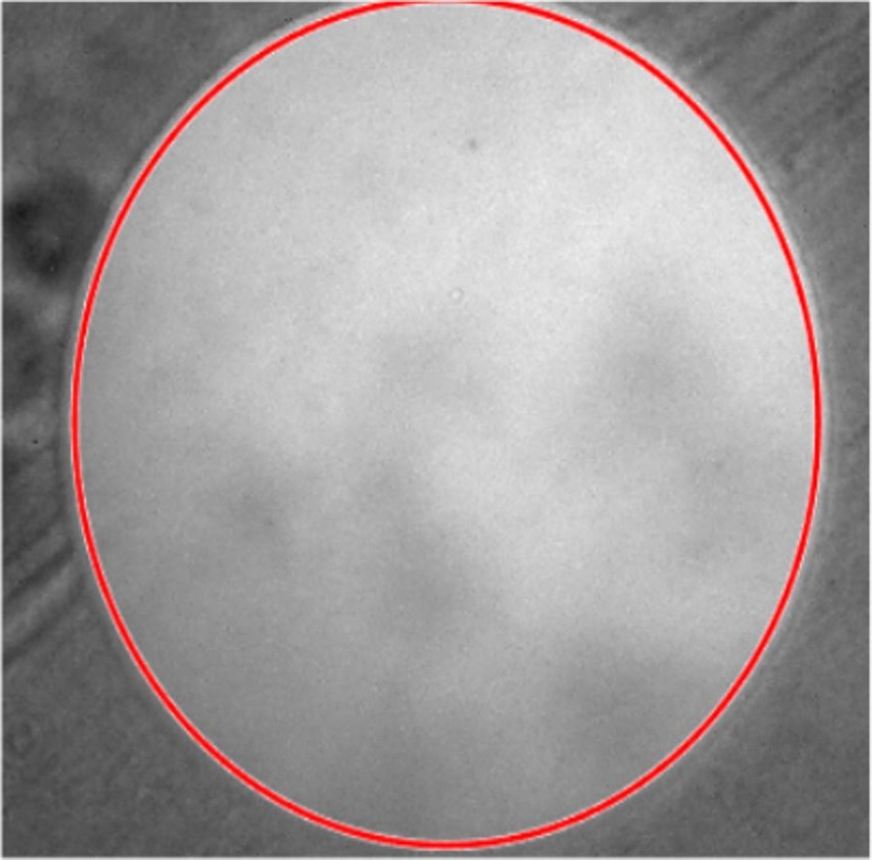
Fig. 8 Image of high-precision laser point in a slide, diameter is calculated and showed with the red circle
The marked circle corresponds to an estimated area of 70
Table 1 Estimated measurements for neurons in Fig. 7 based on the obtained segmentation and their comparison with the expert estimation
| Reference | Traditional Methods | Predictions U-Net | ||||
| Neuron Example |
Area ( |
Radius ( |
Area ( |
Radius ( |
Area ( |
Radius( |
| a) | 435.40 | 11.77 | 555.53 | 13.41 | 412.41 | 11.45 |
| b) | 575.96 | 13.54 | 664.14 | 14.53 | 566.88 | 13.43 |
| c) | 484.36 | 12.41 | 612.03 | 13.95 | 463.77 | 12.15 |
| d) | 535.61 | 13.05 | 794.24 | 15.90 | 507.81 | 12.71 |
4 Discussion
Although the difference in DSC between the two approaches was small, about
When estimations of a physical measure are computed, this difference becomes relevant. Other works reported, specifically for studying PN-PFC, processed images taken from dead neurons or with high-resolution microscopy [27, 9, 3]. Therefore, they are not comparable. Studying live neurons is of interest to the experts since they can test the neuron response under a stimulus (electrical or pharmaceutical).
The closest report was made recently by Kato and Hotta [10], analyzing live cells of mouse liver and human iRPE cells. The study aims to demonstrate the effectiveness of automatic image pre-processing and machine-learning techniques in improving cell segmentation accuracy for microscopy low-quality images.
Their results achieve a DSC of
5 Conclusions and Future Work
5.1 Conclusions
This work addressed the automatic segmentation of live cells in low-resolution images taken from an inverted optical microscope. Traditional and CNN-based approaches were tested to deal with high noise and low contrast conditions, showing that they could segment the neurons suitably. Regarding the traditional approach, it was able to identify the main body of the neuron and eliminate artifacts. However, it had limitations in segmenting dendrites, reaching a DSC of 0.69±0.06. On the other hand, the U-Net model yielded predictions closer to the ground truth, reaching a higher DSC of 0.73±0.07; its main limitation was the misinterpretation of artifacts or stains as part of the neurons. It is worth noting that while the U-Net outperforms the Dice index, it is limited by a small sample number common in biological datasets. This highlights the trade-off between accuracy and data resources. Both approaches have room for improvement and application, and a hybrid approach could be explored in further experiments aiming to increase the DSC. Currently, the dataset is being extended to include other types of neurons.
5.2 Future Work
For future work, we hope to evaluate other U-Net-based methods for segmentation to better recover details that have been lost in fine structures such as dendrites. We are also working on the documentation of the used database to make it open access since we have not found a similar database in the state of the art.

