


 nueva página del texto (beta)
 Inglés (pdf)
 Artículo en XML
 Referencias del artículo
 Enviar artículo por email
 Citado por SciELO
  Similares en
SciELO
Similares en
SciELO 
 Permalink
1 Introduction
Immunotherapy has emerged as a promising study in cancer treatment, focusing on the dynamic interaction between cancer cells and the immune system in a tumor microenvironment. Within this context, hypoxia, a common phenomenon in tumors, has been shown to have a significant impact on tumor growth dynamics and response to therapy [9]. Macrophages, immune system cells that can phagocytize cancer cells, play a crucial role in the immune response against cancer.
However, their function can be influenced by the tumor environment, including oxygen levels [13]. There are limitations when performing in vitro clinical trials on immunotherapy and hypoxia, so it is important to rely on computational simulation [4]. Computational simulation has become an invaluable tool for understanding the complexity of these interactions and their therapeutic implications in immunotherapy [3]. This technology allows researchers to model and analyze various aspects of the immune system’s behavior and its response to different treatments.
The advantages of simulation include saving money and time and the absence of contamination of in vitro [7] cultures. Another significant benefit is the ability to run multiple scenarios and variations in a controlled environment. In this context, this study explores how alterations in oxygen (
Using a simulation environment based on PhysiCell [3], oxygen levels were systematically altered to observe their effect on cancer cell proliferation over time, and immune response was activated on day 13 of each simulation. The results provide crucial information on how hypoxia and immunotherapy interact in the tumor microenvironment and how these findings can inform the development of more effective therapeutic strategies for cancer treatment.
2 Related Work
Some studies investigated how hypoxia may affect the immune response and the efficacy of immunotherapy in vitro. Table 1 summarizes various studies on the effects of hypoxia on different breast cancer cell lines. The studies use different breast cancer cell lines, including MDA-MB-231, MCF-7, and MMTVPyMT, allowing comparison of the effects of hypoxia in different breast cancer models. The use of hypoxia chambers predominates, although the AnaecroGen system is also mentioned, and they vary considerably between studies, both in the duration of intermittent hypoxia cycles and in the periods of acute or chronic hypoxia.
Table 1 Effects of intermittent and acute/chronic hypoxia in in vitro models of breast cancer
| Article | Cell line | Hypoxia Conduction | Intermittent Hypoxia (IH) |
Acute Hypoxia (AH) or Chronic Hypoxia (CH). |
| [8] Liu, L. (2017) | MDA-MB-231 | Hypoxia chamber | 12 h (21 % of hypoxia (1 % |
1 % O2 for 48 h |
| [6] Han J. (2017) | (1) MDA-MB-231. (2) MCF-7 |
Hypoxia chamber | 20 h (21 % of hypoxia (1 % |
1 % |
| [2] Chen (2018) | (1) MMTV-PyMT. (2) MCF-7 |
Hypoxia chamber | 24 h (21 % O2) followed by 24 h of hypoxia (1 % |
1 % |
| [1] Alhawarat FM. (2019) | MCF-7 | AnaecroGen System | h (1 % |
1 % |
All studies use 1 %
Performing these in vitro assays means that if the appropriate protocol is not followed, the cell cultures are sometimes no longer optimal for use in research, so it is important to use other alternatives, such as computational simulations. Table 2 summarizes studies that developed models for immunotherapy in cancer treatment.
Table 2 Models incorporating immunotherapy
| Article | Model | Cell type | Image/Environment |
| [12] Salgia R. (2018) | Deterministic and stochastic | Cancerous | 2D/Matlab. |
| [14] Hsiu-Chuan Wei (2022) | EDO | Cancer, T, B, and MK lymphocytes | 2D/ Matlab. |
| [11] Rojas-Domínguez A. (2022) | Ising Hamiltonian | Cancerous, T | 2D lymphocytes/ Netlogo. |
| [5] Golmankhaneh A. (2023) | Sigmoids, Power Law and Exponential | Cancer cells | 2D/Matlab and WebPlotDigitizer. |
| [10] Polyakov M. (2023) | Diffusion equation | Cancerous tumors | 2D-3D/C++ and Python. |
These studies use a variety of simulation approaches and tools. For example, Salgia (2018) and Golmankhaneh (2023) employ deterministic and stochastic models in MatLab to simulate the behavior of cancer cells in 2D environments.
Wei (2022) uses ordinary differential equations (ODEs) to model different types of immune and cancer cells also in MatLab. Rojas-Domínguez (2022) adopts an approach based on the Ising Hamiltonian model using NetLogo to study the interaction between cancer cells and T lymphocytes.
Polyakov (2023) applies diffusion equations in 2D and 3D environments using C++ and Python to simulate the growth of cancerous tumors. Although these models offer valuable insights into the interaction between cancer cells and immunotherapeutic treatments, they have certain limitations compared to PhysiCell.
Many of these models are restricted to 2D environments, which can limit the accuracy of the simulations by not considering the 3D complexity of tumors. While powerful, the simulation environments, such as MatLab and NetLogo, may not be as efficient or scalable as PhysiCell, specifically optimized for large-scale 3D multicellular simulation.
PhysiCell also provides more robust integration with experimental biological data and is highly adaptable to incorporate new biological features and mechanisms, which is crucial for accurate and up-to-date immunotherapy models.
In addition, oxygen levels can be altered in PhysiCell, which is essential for studying the tumor microenvironment and its impact on the effectiveness of treatments.
3 Methods and Materials
3.1 Cancer Cells
Cancer cells are cells that have undergone genetic transformations that alter their growth and division cycle, allowing them to proliferate in an uncontrolled manner. In that context, the code provided describes the behavior of hanging tumor spheroids in the simulation model, which are very common in breast cancer.
The life cycle details include a continuous growth cycle and two cell death pathways, apoptosis, and necrosis, with specific rates and durations for each process. The cell has a defined total volume with specific proportions of biomass and fluid, and its mechanical dynamics include cell-cell adhesion and repulsion.
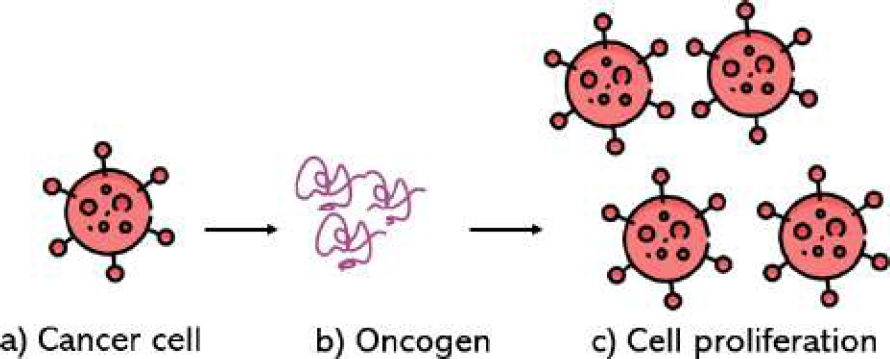
In addition, the cell’s motility is disabled, reflecting its inability to move autonomously. The rates of secretion and uptake of substances such as oxygen, essential for their survival and growth, are also specified. In Fig. 1, the way cancer cells interact with their environment and respond to the oncogene to proliferate uncontrollably is presented.
3.2 Macrophages
A macrophage is a type of white blood cell essential in the immune system, responsible for detecting, engulfing, and destroying pathogens and dead or damaged cells by a process known as phagocytosis. This cell plays a crucial role in the immune response alongside B cells (see Fig. 2). B cells are a type of lymphocyte originating in the bone marrow and playing a crucial role in the humoral immune response.
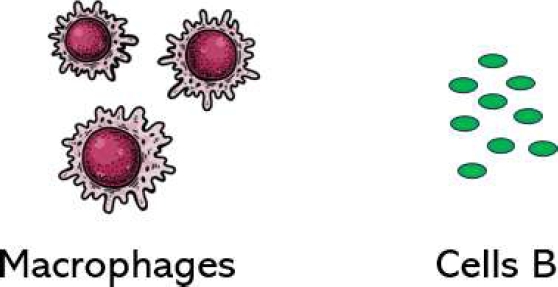
They produce and secrete antibodies, proteins that bind to antigens to neutralize or mark them for destruction by macrophages. Macrophages in simulation have a phenotype that initially disables their motility capabilities, with the speed of movement set at 1 micron per minute and a persistence time of 10 minutes. Migration is partially biased (0.5).
3.3 Multi-agent Simulation
PhysiCell is designed to investigate the dynamics and interactions of thousands or millions of cells in three-dimensional microenvironments with environment-dependent phenotypes. It employs a physical, lattice-free approach to minimize artifacts associated with grids.
After initializing the microenvironment using BioFVM [5] and cells, as well as the current simulation time
The software repeats the main program loop until the maximum simulation time is reached. To learn more about the loop, see [3].
3.4 Biochemical Microenvironment
The BioFVM environment for simulation of the chemical microenvironment uses a vector of reaction-diffusion partial differential equations (PDE). The modeling of the biochemical microenvironment (within a
where:
– |
is the diffusion |
– |
decay |
– |
mass source |
– |
mass uptake |
– |
sources and uptake by cells |
With null flow conditions in
In addition,
Numerically, we solve the solution in time
We mention the parameters for the microenvironment, which are presented in the Table 3. These parameters are associated with the development of cancer cells and can affect their tumor proliferation, specifically in the oxygenation cycle.
Table 3 Generality of microenvironment parameters
| Description | Parameter |
| Diffusion coefficient | oxygen: 100000 micron2/min. |
| Decay rate | oxygen: 0.1 1/min. |
| Initial condition | oxygen: 38 mmHg. |
| Dirichlet boundary condition | oxygen: 38 mmHg True/False activated. |
To facilitate the use of the code, we have provided a link on GitHub where models
4 Implementation
In this work, we define the microenvironment for developing cancer cells with the conditions specified in the section “Microenvironment”. The domain for the visualization of the simulations is in the second and third dimensions, and the configuration for simulation time is in minutes; for example, to simulate 25 days, it is necessary to multiply the number of days by 24 (the number of hours in a day), and then by 60 (minutes in an hour) that is 36 000 minutes.
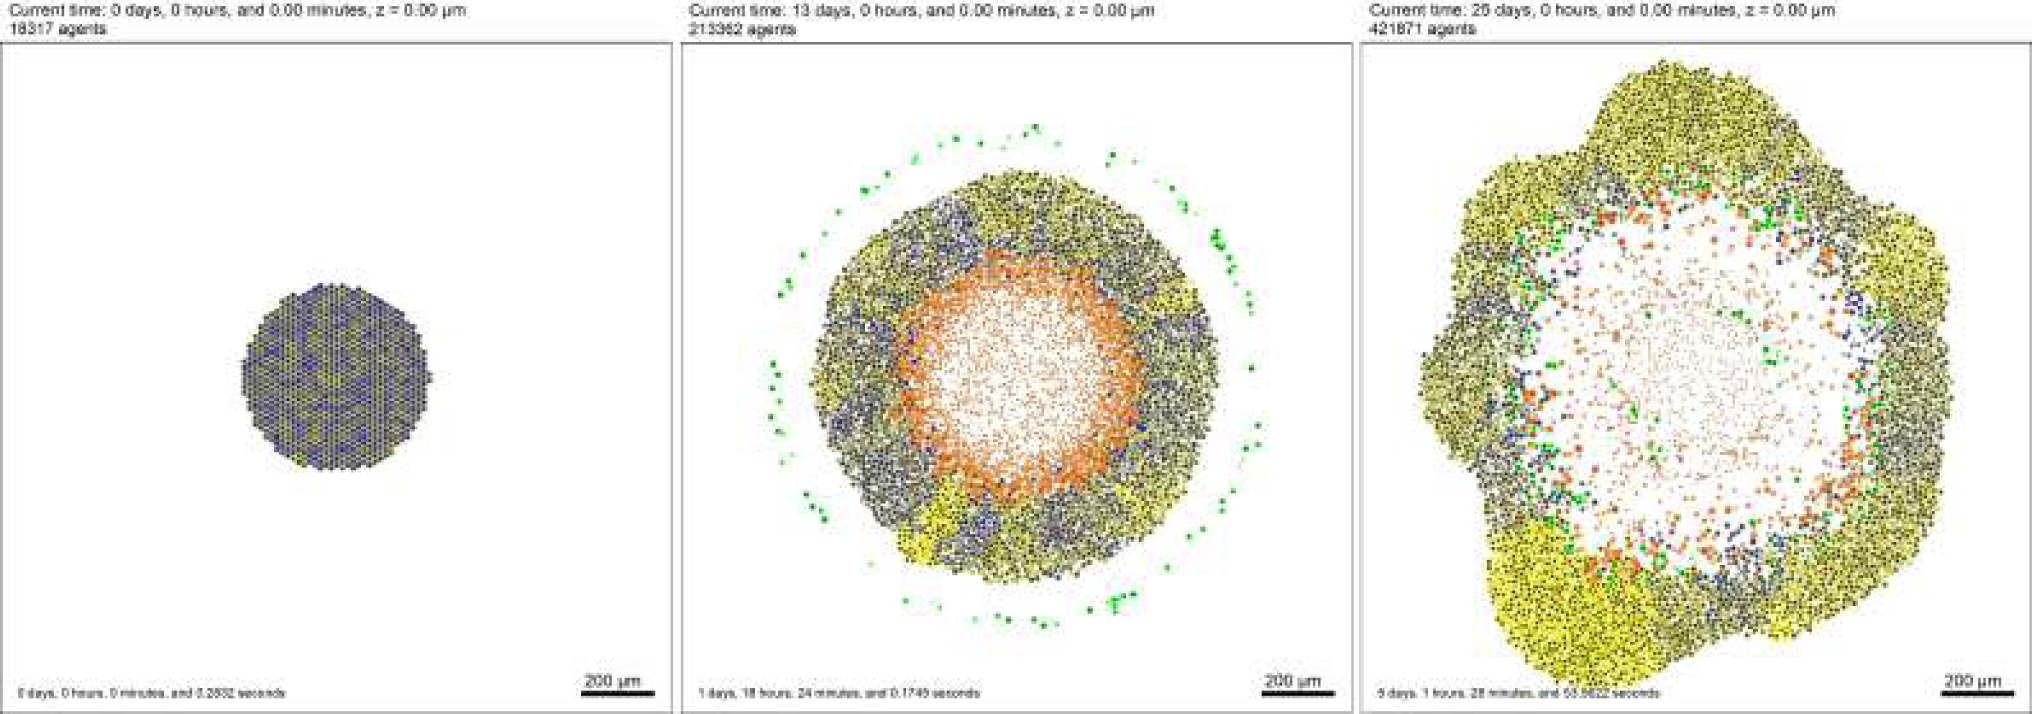
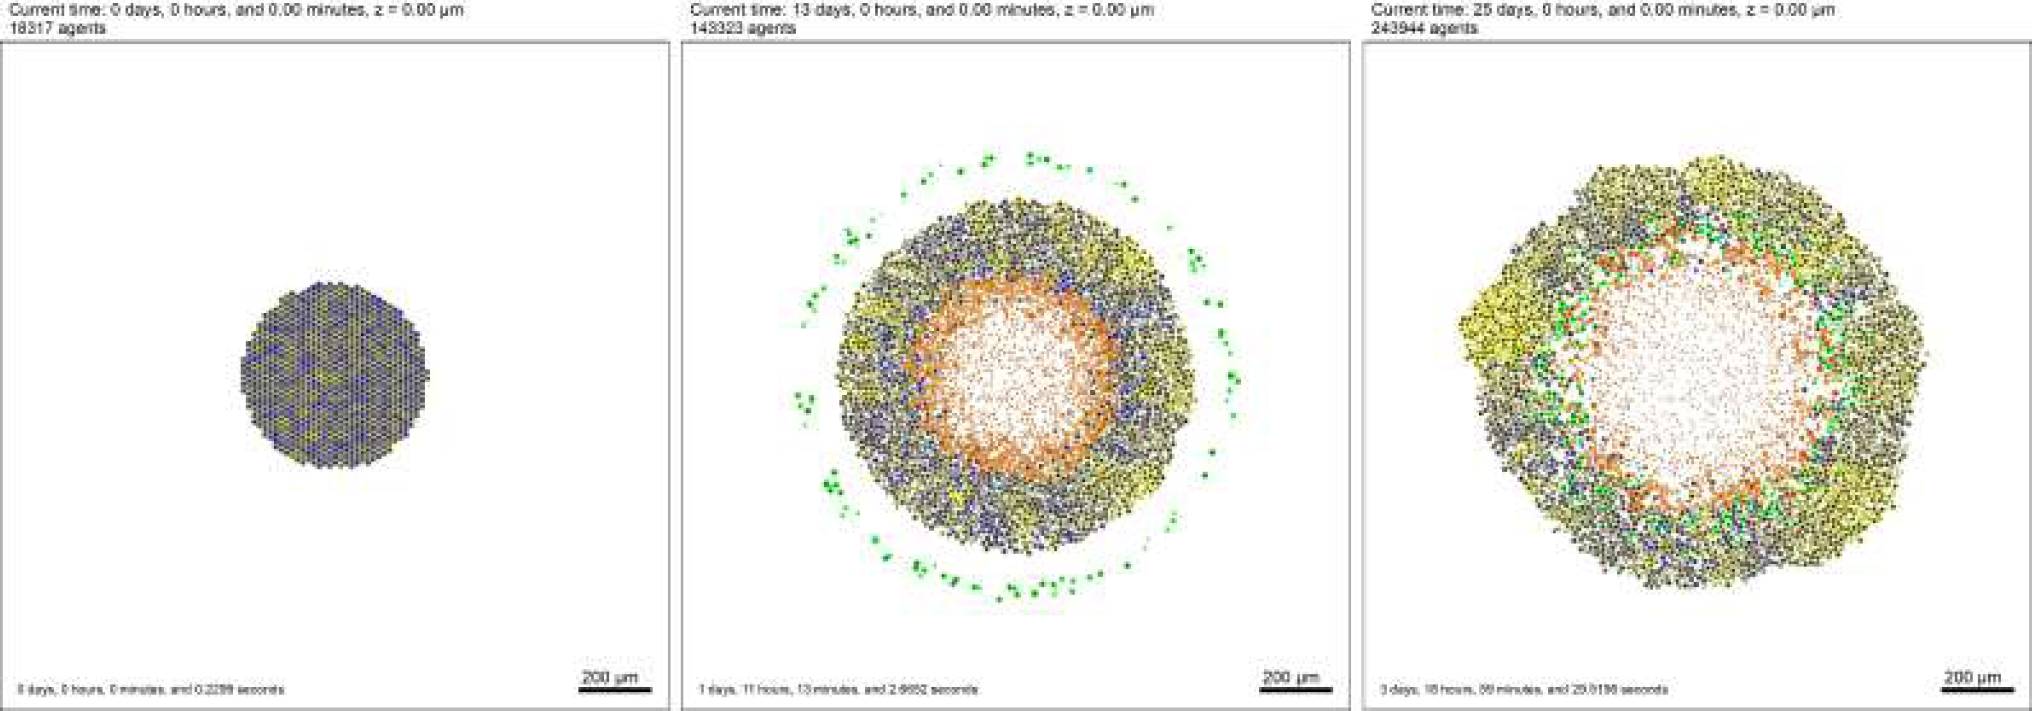
We initially define a set of cancer cells that will proliferate according to the parameters mentioned in section 3.3. Also, macrophages will activate and start phagocytosis from day 13. Simulation
For simulation
Fig. 3 Diagram of a) The interaction between cancer cells and the immune system that starts with the proliferation of cancer cells in the microenvironment, there are B cells that identify the cancer cells and send an activation signal to the macrophages to identify the cancer cells, and b) The interaction between these cells to perform phagocytosis by the macrophages
The immune system activation in
5 Results
Applying the methodology mentioned in section 4, for
Cancer cells represent the blue color; yellow represents an oncogene, black represents the nucleus of each cancer cell, and green represents macrophages. In Fig. 4, the result of
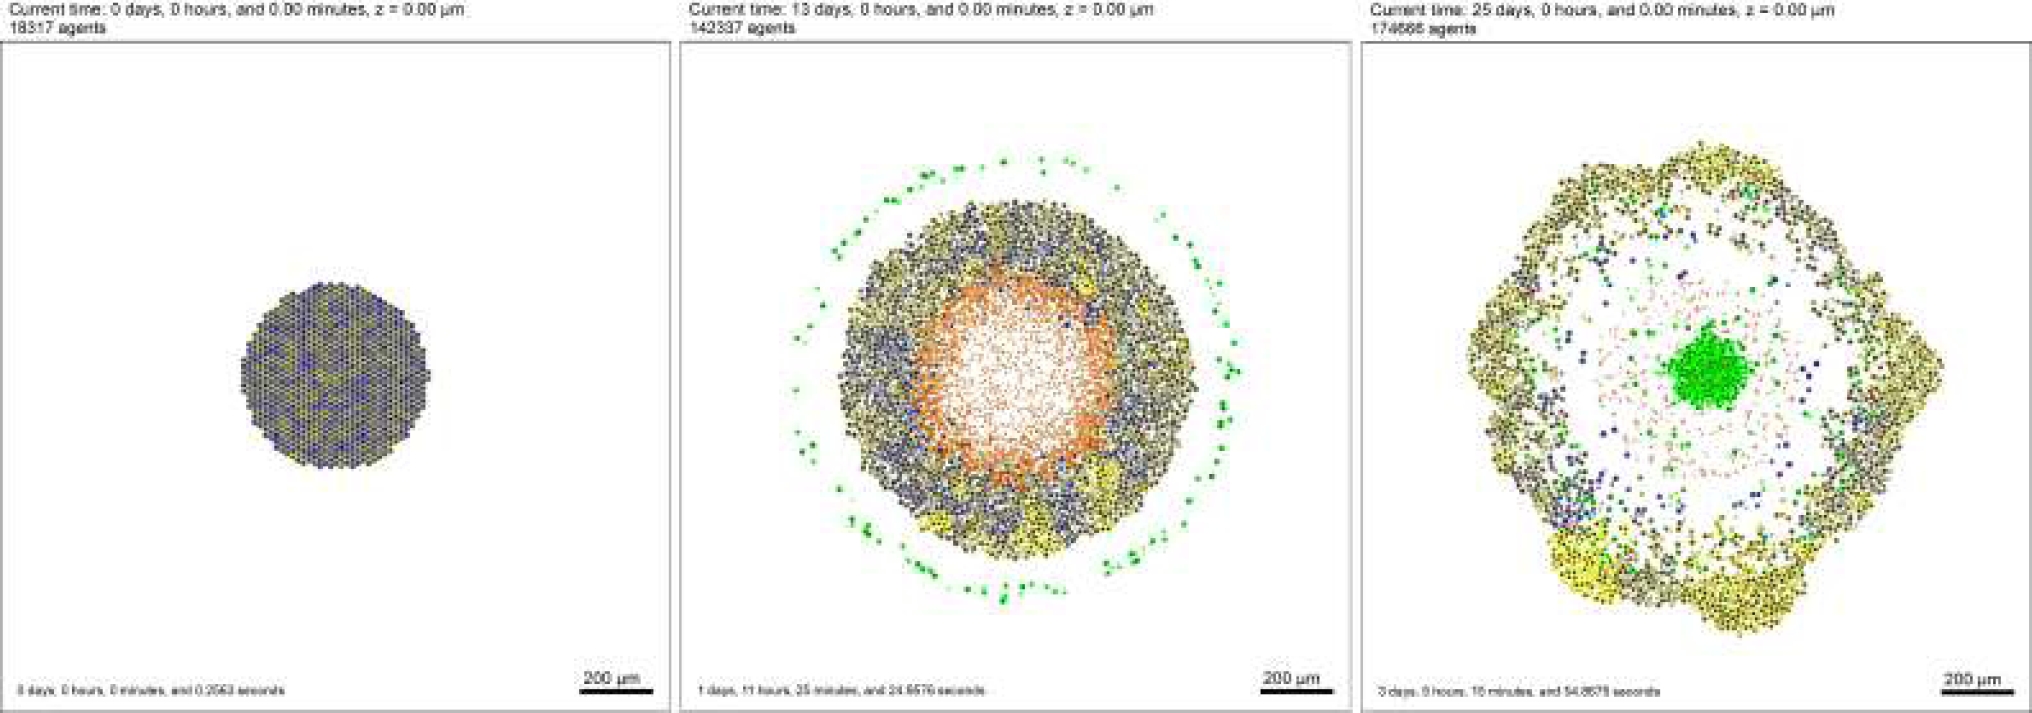
For
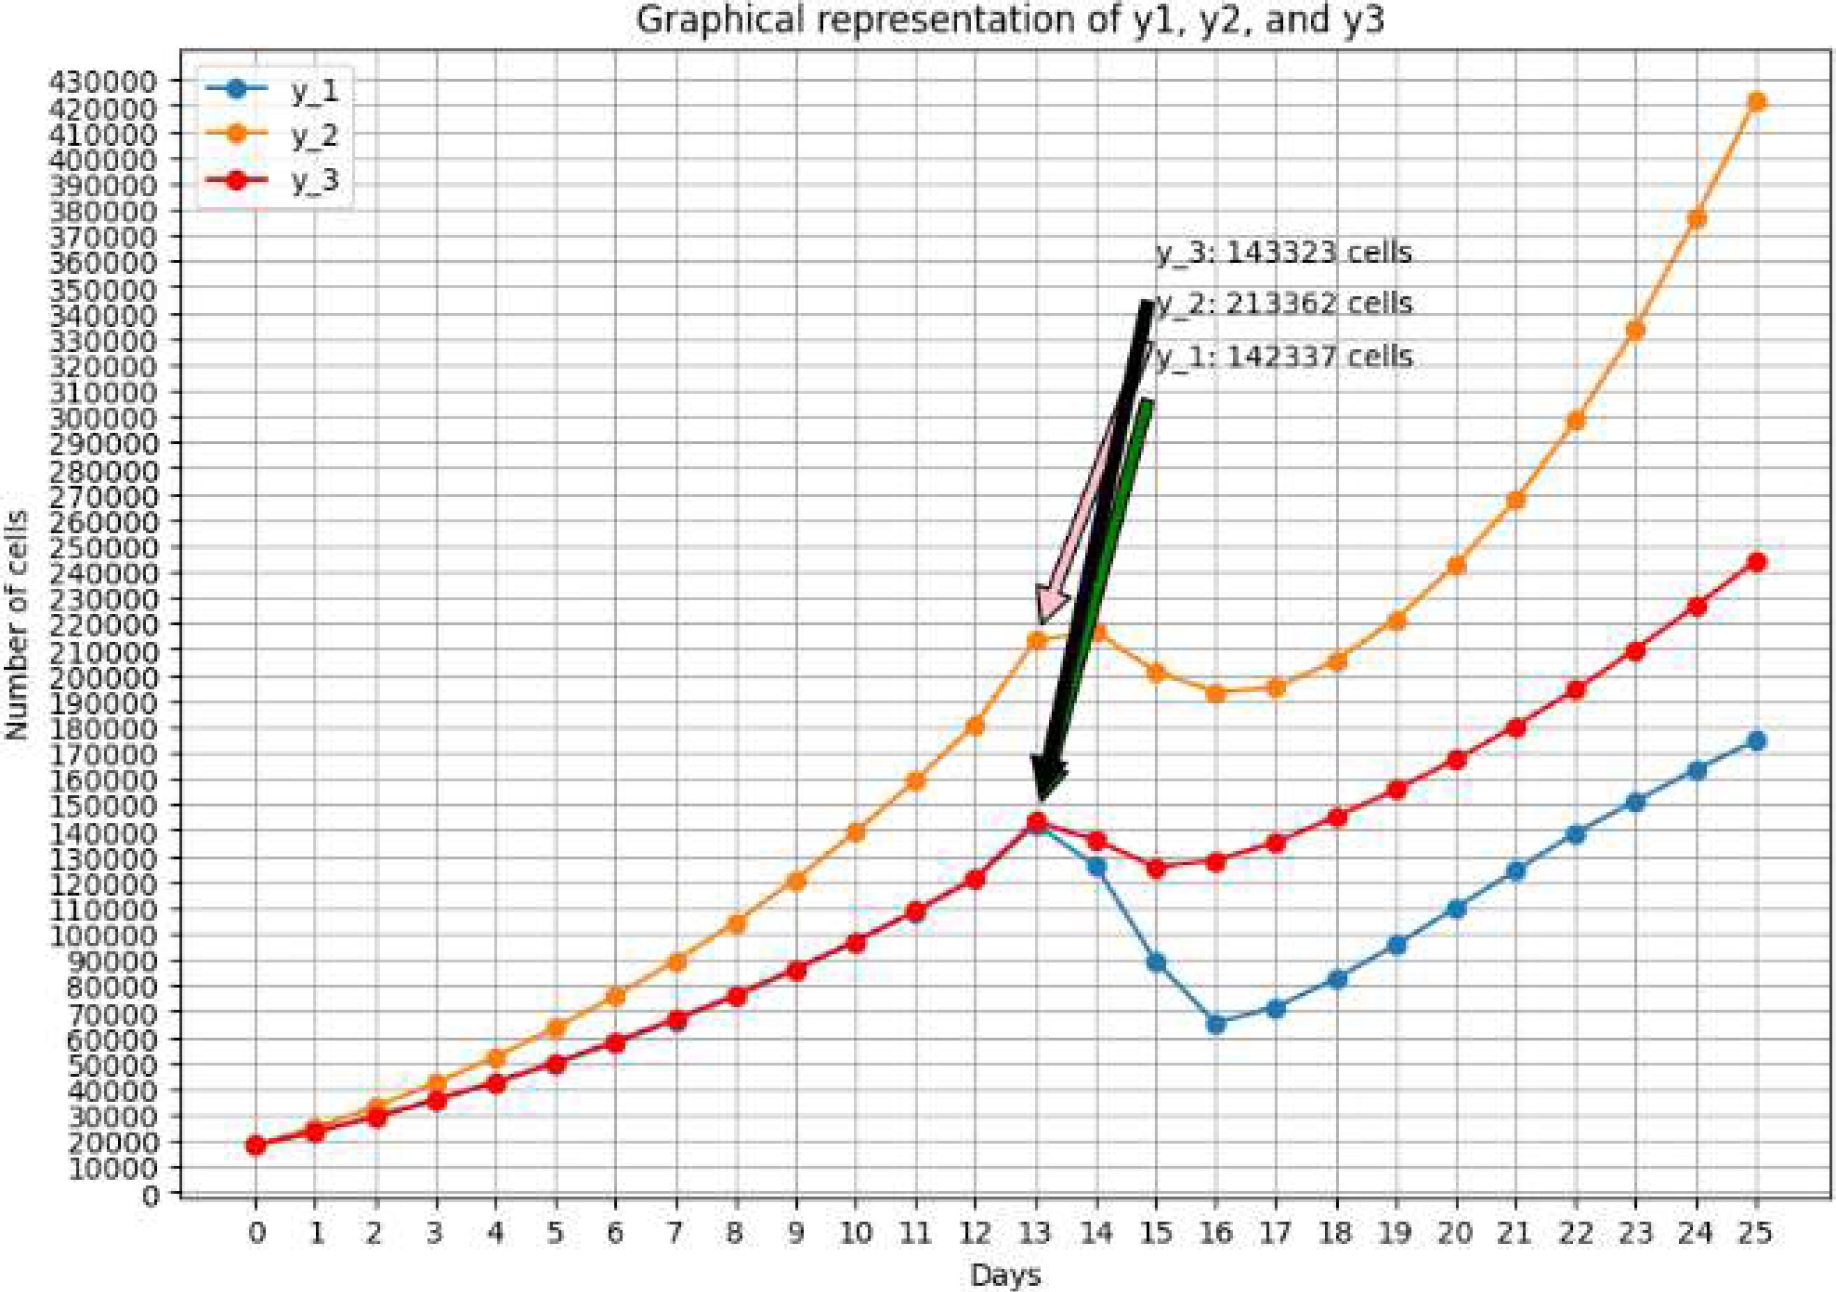
The pairwise correlation coefficient was calculated for each combination obtaining: the correlation coefficient between
Comparison between the diameter of ductal carcinoma in situ (DCIS) and the simulated models reveals that DCIS, with a diameter of
These discrepancies underscore the need to adjust model
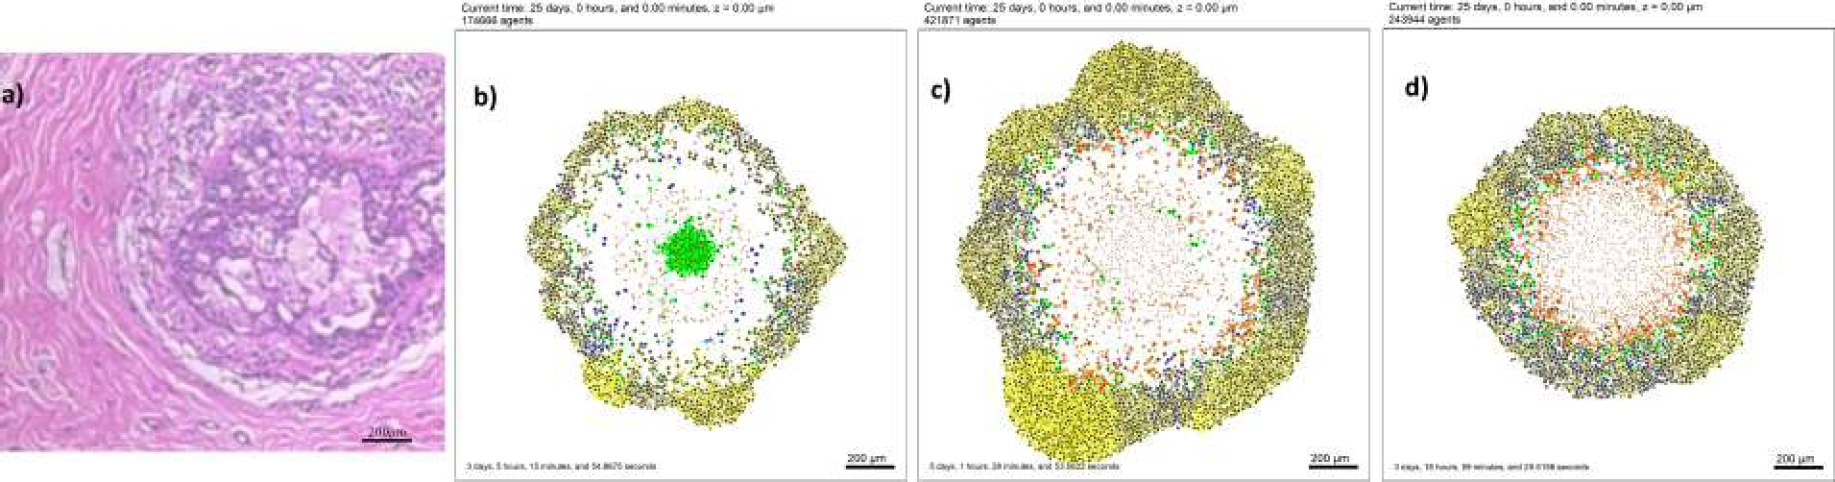
Fig. 8 CDIS representation obtained from a) dataset BreakHis 40x from [15] b)
6 Discussion and Future Work
This research stands out for its interdisciplinary approach, which combines elements of biology, computational modeling, and immunotherapy, a comprehensive understanding of the interaction between the immune system and the tumor microenvironment.
This approach not only offers innovative perspectives on cancer treatment but also underscores the importance of collaboration between different scientific fields to advance the development of more effective therapies.
The lack of significance in the combination of
Overall, these results provide valuable information for tuning models and designing more effective treatments, highlighting the need for a more detailed evaluation of how different combinations of parameters affect cancer progression. In biopsy images, cancer cells can be seen to overlap each other, as shown in Fig. 8 making it difficult to fully visualize all cells, both cancerous and noncancerous.
In our study, we performed 2D simulations, which limits the accuracy in visualizing certain patterns, such as the ellipsoid shape. Therefore, we propose to perform 3D simulations in future work to improve the accuracy of the representation of these patterns.
Tumor growth patterns that experience hypoxia can cause necrosis, and in some types of cancer, such as ductal carcinoma in situ (DCIS), this can lead to the formation of microcalcifications. These microcalcifications in the mammary duct are detectable by mammography and may allow early detection of cancer.
A future approach is to develop models that simulate the formation of microcalcifications from tumor growth, to improve early detection of DCIS on mammography.
Other future work is planned to extend the duration of the simulation beyond 25 days to obtain a complete picture of long-term tumor dynamics and to evaluate how variable oxygen levels sustainably influence cancer progression and treatment effectiveness.
7 Conclusions
The
The high correlation between parameters
Furthermore, the p-value significantly less than 0.05 supports the existence of significant differences between the means of models
These findings underscore the importance of understanding how oxygen levels and oncoprotein expression affect cancer behavior. This knowledge may guide future research and contribute to developing more effective therapeutic strategies, such as manipulating oxygen levels to control tumor growth.

