


 nueva página del texto (beta)
 Inglés (pdf)
 Artículo en XML
 Referencias del artículo
 Enviar artículo por email
 Citado por SciELO
  Similares en
SciELO
Similares en
SciELO 
 Permalink
1 Introduction
The construction of Graphical User Interfaces and Web sites needs a large variety of design decisions to be taken like for color, form, and typography of single atomic interaction elements like text fields, buttons, menus, etc. Furthermore, these elements need to be organized in a certain part of the screen. This arrangement decision also defines the interaction’s direction when users are moving from one interaction element to another.
Traditionally, container widgets are helping in that decision and are following either a left-to-right ordering, e.g., for main menus, Microsoft’s ribbons, or a top-down approach as studied for menus in [14]. The left-to-right ordering is mirrored frequently in style guides for right-to-left scripts like the Arabic script, one example can be found in [2].
Nonetheless, also for these container widgets the question is of interest which direction yields the smallest navigation time. The arrangement decision became even more uncertain since now for more than one decade touch-based interaction became a further important pointing technology.
Touch-based devices imposes different layout restrictions especially since the user occludes parts of the screen by his interacting and device holding hands; see [11] for some design rules to handle these problems. Due to the proliferation of touch-based devices in recent years and especially the proliferation of smartphones [10], a trend of long vertical scrolling designs “beyond the fold” as being discussed in [4, 1] is gaining a foothold.
The interesting question is if this approach offers benefits. This article describes an experimental study to support the arrangement decision for the different input technologies mouse-based and touch-based, and tries to answer some of the design questions mentioned.
2 Related Work
A performance analysis of touch-based interaction can be found in [8]. The authors found a relationship between target sizes [mm - 38mm] and error rates [% - 4%] and propose a compensation function that reduces the error rate by 7.79%. However, there is no indication of an influence of the interaction’s direction.
In [14], authors found that with vertical menus, users needed less eye fixations, were faster and more successful for mouse interaction. Whether this is valid for touch-based interaction, answers remain open. The difference in performance between mouse-based and touch-based interactions were investigated by [16]. Their results have shown no difference for targets between 4 - 32 pixels per side.
In [6], authors found no difference for one-handed interactions either. For two-handed interaction, the touch-based interaction performed better. Another work understanding performance is in [5]. Authors compared the performance of the mouse, the stylus and the finger across tapping, dragging and radial pointing drag.
Results showed that the finger is fastest for tapping activities but inaccurate for small targets and slowest for dragging, the stylus is fast for dragging but inaccurate for targets in the North-West direction, the finger is slow and inaccurate for dragging in the North-West directions. Concerning radial dragging, the experiment demonstrate that is directly proportional to the number of items.
A button size and spacing on touch screen buttons experiment was made by [12]. They compared performance and input accuracy between older adults and younger adults. Their results have shown that younger adults required significantly less amount of time to complete a given input task. Input accuracy did not show significant different between older and younger adults.
Authors found not any button size or spacing configuration where younger or older adults were stronger or weaker with. However, although
spacing difference did not affect time performance, it significantly affects input accuracy.
[7] explored the sound cues to provide occluded visual information to assist accuracy in touch-based interaction. They conducted an experiment using finger- and pen-based as input modality for smartphones.
To validate the occluded visual information during touch gesturing, they used the aperture distance between two endpoints of closed stroke and the deviation of intersection point between two strokes. Their results showed that there is no big difference in simple gesture for both modalities but in medium gesture in terms of aperture distance is higher than complex gesture for both modalities and, in terms of intersection point deviation is two times of aperture distance.
Also, they evaluated performance of sound feedback to provide occluded visual information. Their results showed that sound feedback performs better for drawing endpoints than intersection points in terms of simple and medium gestures, and that pen is better for drawing endpoints of closed strokes in complex gesture. [18] explored the interaction between the input device and the navigational control function (panning, zooming, scrolling, and moving) of web maps.
They employed two input interactions: mouse-based and touch-based; and three different navigation modes: continuous control and continuous display, discrete control and continuous display, and discrete control and discrete display. They analyzed two operational performances: task completion times and user interface actions.
They found that the task completion time varied with the input device and with the navigation mode. Another result was that different navigation modes did have a significant effect on the user interface actions, but the input devices did not. They concluded that mouse performed better than touch screen in any of the three navigation modes and that the touch screen took more time than the mouse. [15] evaluated the performance of mouse, touch, and gestural interaction through the selection of targets.
They found gestural interaction performed much worse than mouse and touch interaction. Moreover, gestures were found to be much more inaccurate compared with the other devices. Comparing touch and mouse, touch recorded a higher hit-miss ratio; however, they had not found a significant difference in performance between these devices. In [17] test the effectiveness and user satisfaction of mouse-based and touch-based interaction with a monitor placed in a vertical position.
Results suggest that mouse-based interaction performed better, is faster, caused fewer errors and is preferred by users than touch-based interaction. [13] compared touchscreen and mouse-based interaction on abstract and real-world tasks. They found that, for pointing and dragging tasks, participants are overall faster on a touchscreen than with a mouse.
For accuracy, they found that an arithmetic task, that requires high precisión pointing, had higher accuracy with a mouse than touch. However, for picture-word pairs (low precisión pointing), sentence comprehension (low precisión dragging) and pattern construction tasks (high precisión dragging), touch-based and mouse-based interaction had similar accuracy. [3] studied the difference in performance between Congruent Indirect Touch (CIT) and mouse-based interaction.
Authors found that CIT pointing performance is similar to mouse on targets with sizes down to 3 mm and superior performances on the largest targets. On average, their experiment reveals that CIT outperforms the mouse by 14%. In [9], authors evaluated the usability (efficiency, effectiveness and satisfaction) of the touchscreen, mouse and touchpad on a set of editing tasks.
Results show that 34% of the total tasks were significantly efficient with a mouse and 37.5% significantly less execution time with a touchscreen (having efficiency with effectiveness as a covariate). 45% of the total tasks were executed with significantly fewer errors with a mouse, following the touchpad with 29%.
Concerning user satisfaction, results show that participants liked mouse-based interaction the most, and perceived that mouse is easier to use when compared to a touchscreen or touchpad. In summary there is considerable research in performance of both, touch-based and mouse-based interaction. Interestingly though, we could not find any systematic investigation on the influence of the interaction’s direction.
3 Methods
The goal of this work is to compare mouse-based and touch-based interaction to explore the interaction’s direction on graphical user interfaces.
3.1 Experimental Design
The experiments were conducted in fairs, exhibitions or laboratory sessions using a Windows program as shown in the Fig. 1. Users had to click or touch on a target (rectangles or circles). Once the user has hit a target, the next target is shown, and the previous one vanishes. This experimental design allows to observe the user interaction’s direction using the mouse or the touch screen.
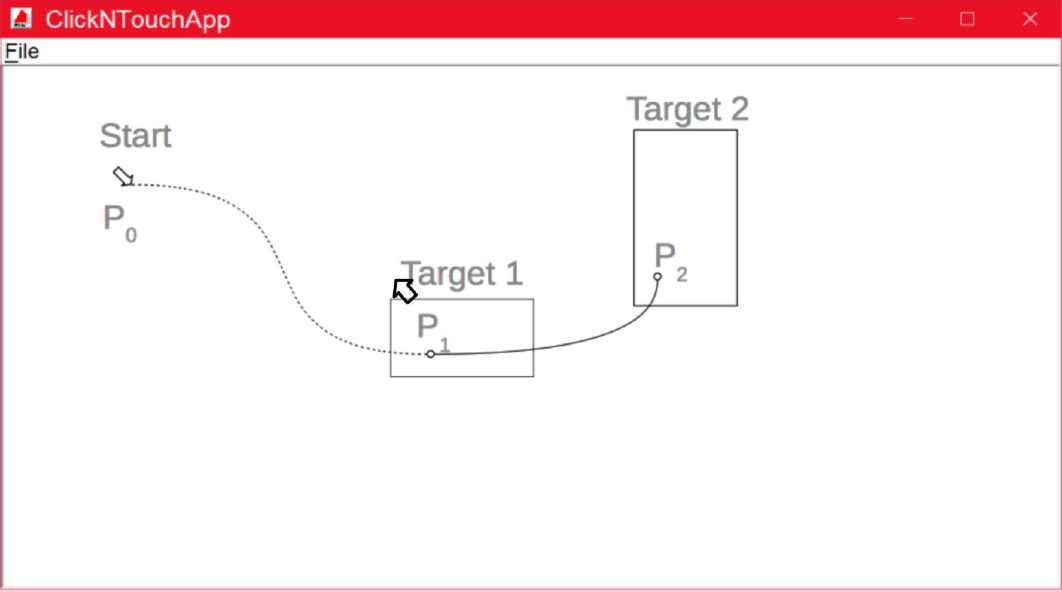
After a short poster-based introduction into the experiments and privacy issues, the participants performed the test undisturbed. When the program is started, the user is first asked to convey some socio-demographic and basic data (age, gender, device type) in a pop-up window. Furthermore, some binary test variables were set in that window: sound feedback on/off, color feedback on/off, circular or rectangular targets, and display of one/several targets at once (only one of these needed to be hit). We refrain here from further details on these test variables since these are not of interest in this article; only the direction of the mouse- or touch-movements is considered as a test variable.
Right after data acquisition, the user is showed targets and clicks or touches on these (see Fig. 1). As soon as the target is hit, and only if it is hit, the next target is shown. So, in Fig. 1, the user starts at position
The picture captions for explanation in the picture
Depending on the experiment’s context (sessions in fairs, exhibitions, or laboratory sessions) the users had to hit between 50 up to 300 different targets (average 93 targets). In total 14147 hits were stored, of these 142 were peaked out (1%) since the users used more than 2000 ms to hit the target.
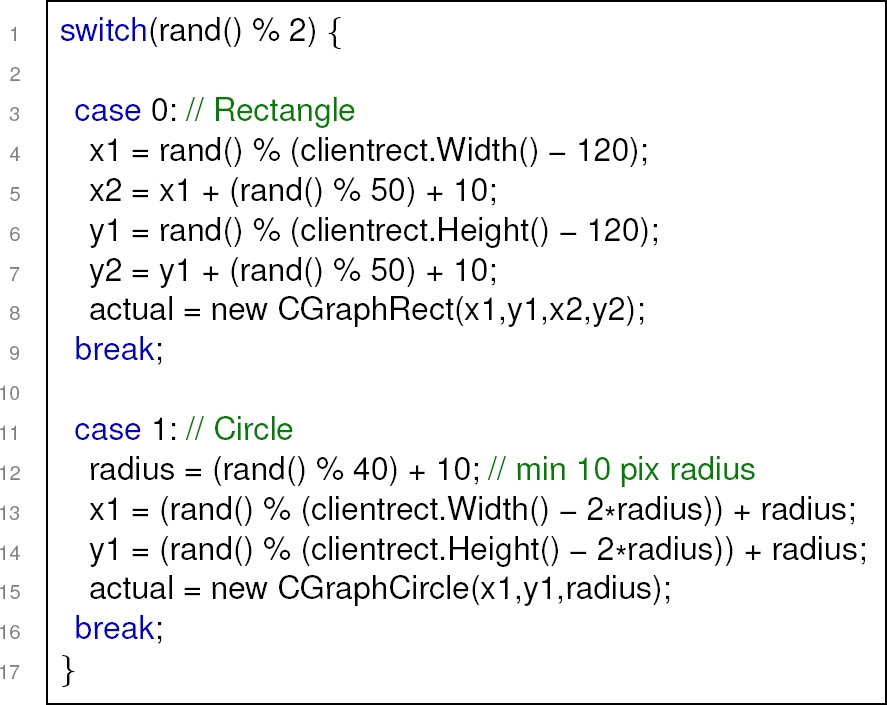
The targets’ areas were sized randomly between 440 and 84213 pixels (0.012% ... 4.4% of the screen’s area). The x- and y-positions for the next targets were chosen randomly as well; the cases where the next target does not move or does move only little in comparison to the last target were not excluded.
The coordinates of a rectangular target were calculated using a pseudo-random generator. The same applies for the centre and radius of a circular target. The Listing 1 shows the random generation of the targets on the screen.
So, looking at Fig. 1, the centre of
3.2 Subjects
The experiments took place from 2013 to 2017; the subjects used either standard PCs with HDTV Monitors (29%) or smaller Laptops (71%, Asus Slate and Microsoft Surface) where the touch capacities of these were used for touch/mouse comparisons. In total 159 experiments were conducted (36 female, 123 male). Since the experiments took place several times on fairs and exhibitions, a wider range of ages is covered (average age 30 years, standard deviation 18 years).
3.3 Analysis
The data of the experiments was stored as CSV-files on disk and afterwards an import tool was used to integrate all data into an SQL database. SQL queries were used to peak out and to calculate the sectors in which a single interaction’s movement took place. For these sectors, the average and the standard deviation of the interaction times were calculated.
The R program for Statistical Computing was used as an SQL interface and it was used to calculate the significance of differences between sectors using R’s Welch Modified Two-Sample t-Test. Furthermore, R was used to plot the results. The direction of an interaction is defined as shown in Fig. 2. The area around the start-point
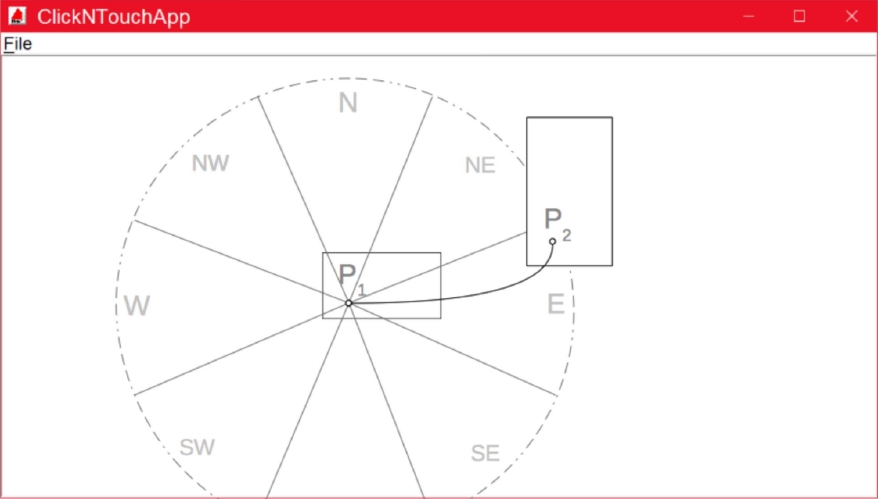
The number
These eight sectors are mapped to the compass directions
4 Results
The overall statistics (independent of sectors) are shown in Table 1. The average and standard deviation were calculated using the SQL aggregate functions AVG and STDDEV, respectively.
Table 1 Overall statistics
| Device | Average Interaction Time [ms] | Standard Deviation | N |
| Mouse | 836.0 | 253.9 | 6478 |
| Touch | 825.4 | 277.5 | 3261 |
So, the average interaction times are quite similar to the results in [16] and [6]. The relatively high standard deviations can be explained by the fact that all data, independent of feedback type, age of user, etc. was averaged. Fig. 3 shows the main findings.
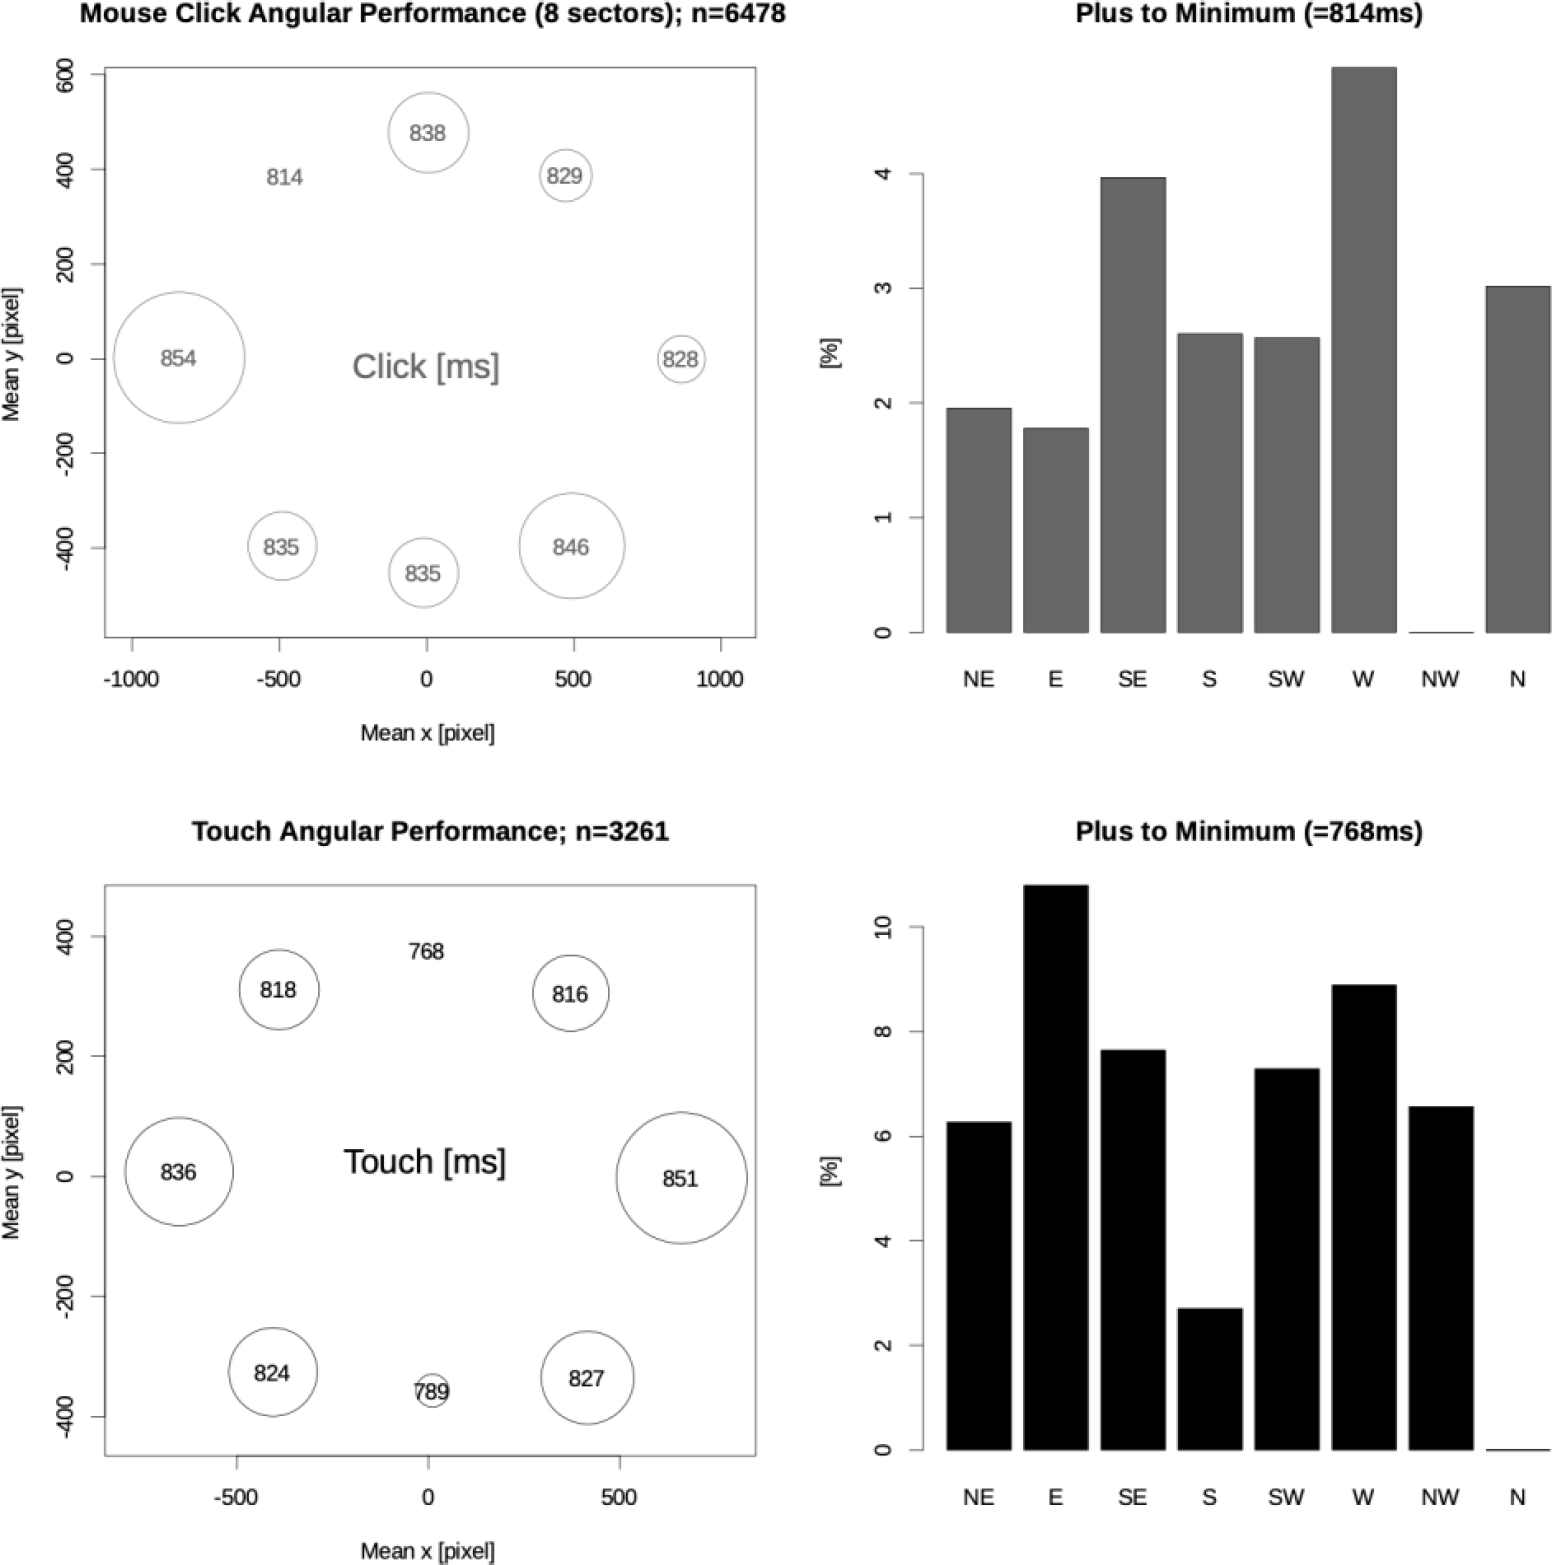
The first row shows the results of the mouse experiments; the second row shows the results of the touch experiments. The bar charts in the right column show the differences for each sector. The individual sectors (
The additional time required compared to the sector with the minimum interaction time is plotted as a percentage on the y-axis. Thus, the y-axis is normalised by the minimum average interaction time that was found in each of the eight sectors.
Thus, for example, for the touch interaction (black bars in the bottom right-hand corner of the figure) the shortest averaged interaction time (768ms, +0%, given in the heading of the sub-figure) is the
The left column shows the results in sectors. For each sector, the average
Especially in the case of touch interaction, a preference for the north and south sectors can be seen in the left column of Fig. 3. To identify such preferred interaction directions, R’s Welch modified two-sample t-tests were performed for all possible sample combinations (
For example, for mouse interaction, when the arrangement of interaction elements such as buttons is arbitrary, a left to right (east) arrangement is preferable to a right to left arrangement. For touch interaction the most significant differences were found between the
Arrangements of the interaction elements from top to bottom, or even better, from bottom to top, therefore appear to be favorable.
5 Discussion
The dependency from the interaction’s direction is quite different for the two devices examined. Mouse interaction in general is less subject to the direction of the interaction. There is some significant preference for North-West and East movements. Such the classical design with menus on the left top and a left-to-right ordering of the subsequent interaction elements is a quite sensible design. Touch interaction proved to be more sensitive to the interaction’s direction.
Here interactions directed to the North and South are significantly faster. Furthermore, there seems to be a slight preference of “x-to-West” movements, probably due to the (partially) covering of the targets by the majority’s right hand. We estimate, based on the statistics in (Schmauder, 1996) that 90% off the users were right-handed in our experiments.
For device independent designs, especially web sites, we conclude that vertical layouts should be preferred since here touch interaction yields a clear performance gain whereas the mouse interaction’s deterioration is in the midfield and, in general, the influence of the direction is weaker here. The recent Web design strategies of preferring long vertically scrolling designs “beyond the fold” as discussed for example in (Cao, 2015) and (Andrew, 2017) are following this conclusion well.
6 Future Work
More investigation is needed to measure the influence of the preferred writing direction (left-to-right versus right-to-left) on mouse interaction to underpin the thesis that this influences the preferred direction. Furthermore, for touch interaction there seems to be a slight preference of x-to-left movements. Whether this is a result of the majority’s right-handedness because the right hand is covering targets needs deeper examination - unfortunately the respective handedness of the users was not recorded up to now. Mouse-based and touch-based movements can be an indicator of the preferred directions. We can continuously monitor mouse movements and mouse clicks over a user’s entire interaction workday session to allow us to support the preferred directions. Finally, we are working on new experiments to compare mouse and touch performance on real GUI/Web components to gain a better understanding of performance in real-world scenarios.

