




 nueva página del texto (beta)
 Inglés (pdf)
 Artículo en XML
 Referencias del artículo

 Traducción automática
 Enviar artículo por email
 Citado por SciELO
 Similares en
SciELO

 Permalink

1 Introduction
In recent years, the real estate sector has had to adapt to the new global scenario to continue offering its products and services. Before the pandemic began, apartment sales were initiated and closed in the sales room, with only 5% of placements being made through digital means. Apartment sales declined because sales were not closing due to customer withdrawal and failure to pay the separation fee.
The main objective of the research presented is to develop a mobile application to improve the Management of Apartment Sales in the real estate sector. The application emerges as a technological innovation in the sector, designed with a new methodology and management measurement indicators. Mobile applications and technological innovation are supported by several authors.
According to [14], mobile applications generate innovation as they promote and facilitate the invention and production of new services, products, or processes in the managerial realm. Furthermore, the study [20] points out that new technologies included in Industry 4.0 offer an opportunity to drive technological innovations that can dramatically increase a company's productivity and innovation performance.
Likewise, the authors of the study [15] indicate that current new development methodologies are based on agile principles, applying best practices and iterative phases or processes oriented to maintain flexibility in the face of unexpected changes during project execution.
The authors [3] have written that, by applying behavioral studies to the real estate market, including perspectives from psychology and sociology through marketing, behavior is governed far beyond simple price discernment. The study [19] states that, in a world constantly stimulated by technological development, companies must acquire structured and organized management control systems. Indeed, companies use new tools daily and make decisions according to available data.
Additionally, the authors [11] clarify that managers must decide what type of knowledge should be generated from each activity to meet their current needs. Thus, depending on the situation, companies must deploy different strategies to acquire tacit and explicit knowledge.
Research [26] indicates that dependence on digital technologies makes it impossible for companies to innovate without technologically complemented process transformations.
Data analysis, AI, and other related technologies offer organizations innovative ways to reinvent processes. According to [21], introducing a mobile app to enhance online commerce and interaction with customers is common in modern organizations. Research has demonstrated its commercial value.
However, few studies have explored the utility of an app that supports, rather than replaces, direct contact with customers. According to [29], social media platforms facilitate the sharing of business information, building relationships with customers, and expressing their emotions.
The development of the Mobile Application with the new ASWAN method focuses on improving the indicators of the commercial area of the real estate sector. Authors [33, 34] demonstrate that the use of Mobile Applications allows reducing times, minimizing deficiencies in processes, and increasing customer satisfaction.
This paper is divided into 6 sections: Section II covers the Theoretical Background, Section III deals with the Research Method, Section IV develops a Case Study, Section V presents Results and Discussions, and finally Section VI Conclusions and Future Research.
2 Theoretical Background
2.1 Mobile Application
The research is based on mobile applications from a variety where, in the study [14], they foster and simplify the creation and development of new services, products, or processes in large enterprises, providing greater flexibility in management and streamlining the internal procedures of organizations.
The benefits derived go beyond their implementation in business processes, as they enable significant improvements in the quality and efficiency of managerial operations at the heart of organizations.
In [15], the authors suggest that in the development of mobile applications there is a trend towards the use of methodologies with agile principles due to the benefits they provide during the software lifecycle. Software development methodologies seek to cover most of the aspects considered during the execution of a software project with the goal of obtaining quality software products.
2.2 Sales Management of Apartments
In the field where the sales management of apartments as established by the authors [3], it is stated that the TCP model was designed to provide explanations of "how" an individual makes behavioral decisions based on a consideration of information; the actual behavior of a person when performing an action is defined by three types of specific beliefs: attitude, subjective norm, and perceived behavioral control.
Therefore, in research [19], it is indicated that other theories provide a more precise approach to investigate digital entrepreneurship. The Theory of Reasoned Action (TRA) highlights intentional behavior, while the Theory of Planned Behavior (TPB) addresses behaviors through a new determining factor called behavioral control.
The authors of the study [11] stated that it is a systematic management of organizational knowledge involving the processes of creation, collection, organization, storage, dissemination, use, and exploitation of knowledge to create commercial value and generate a competitive advantage.
3 Research Method
3.1 Generated Collaborative Metamodel: ASWAN METHODOLOGY
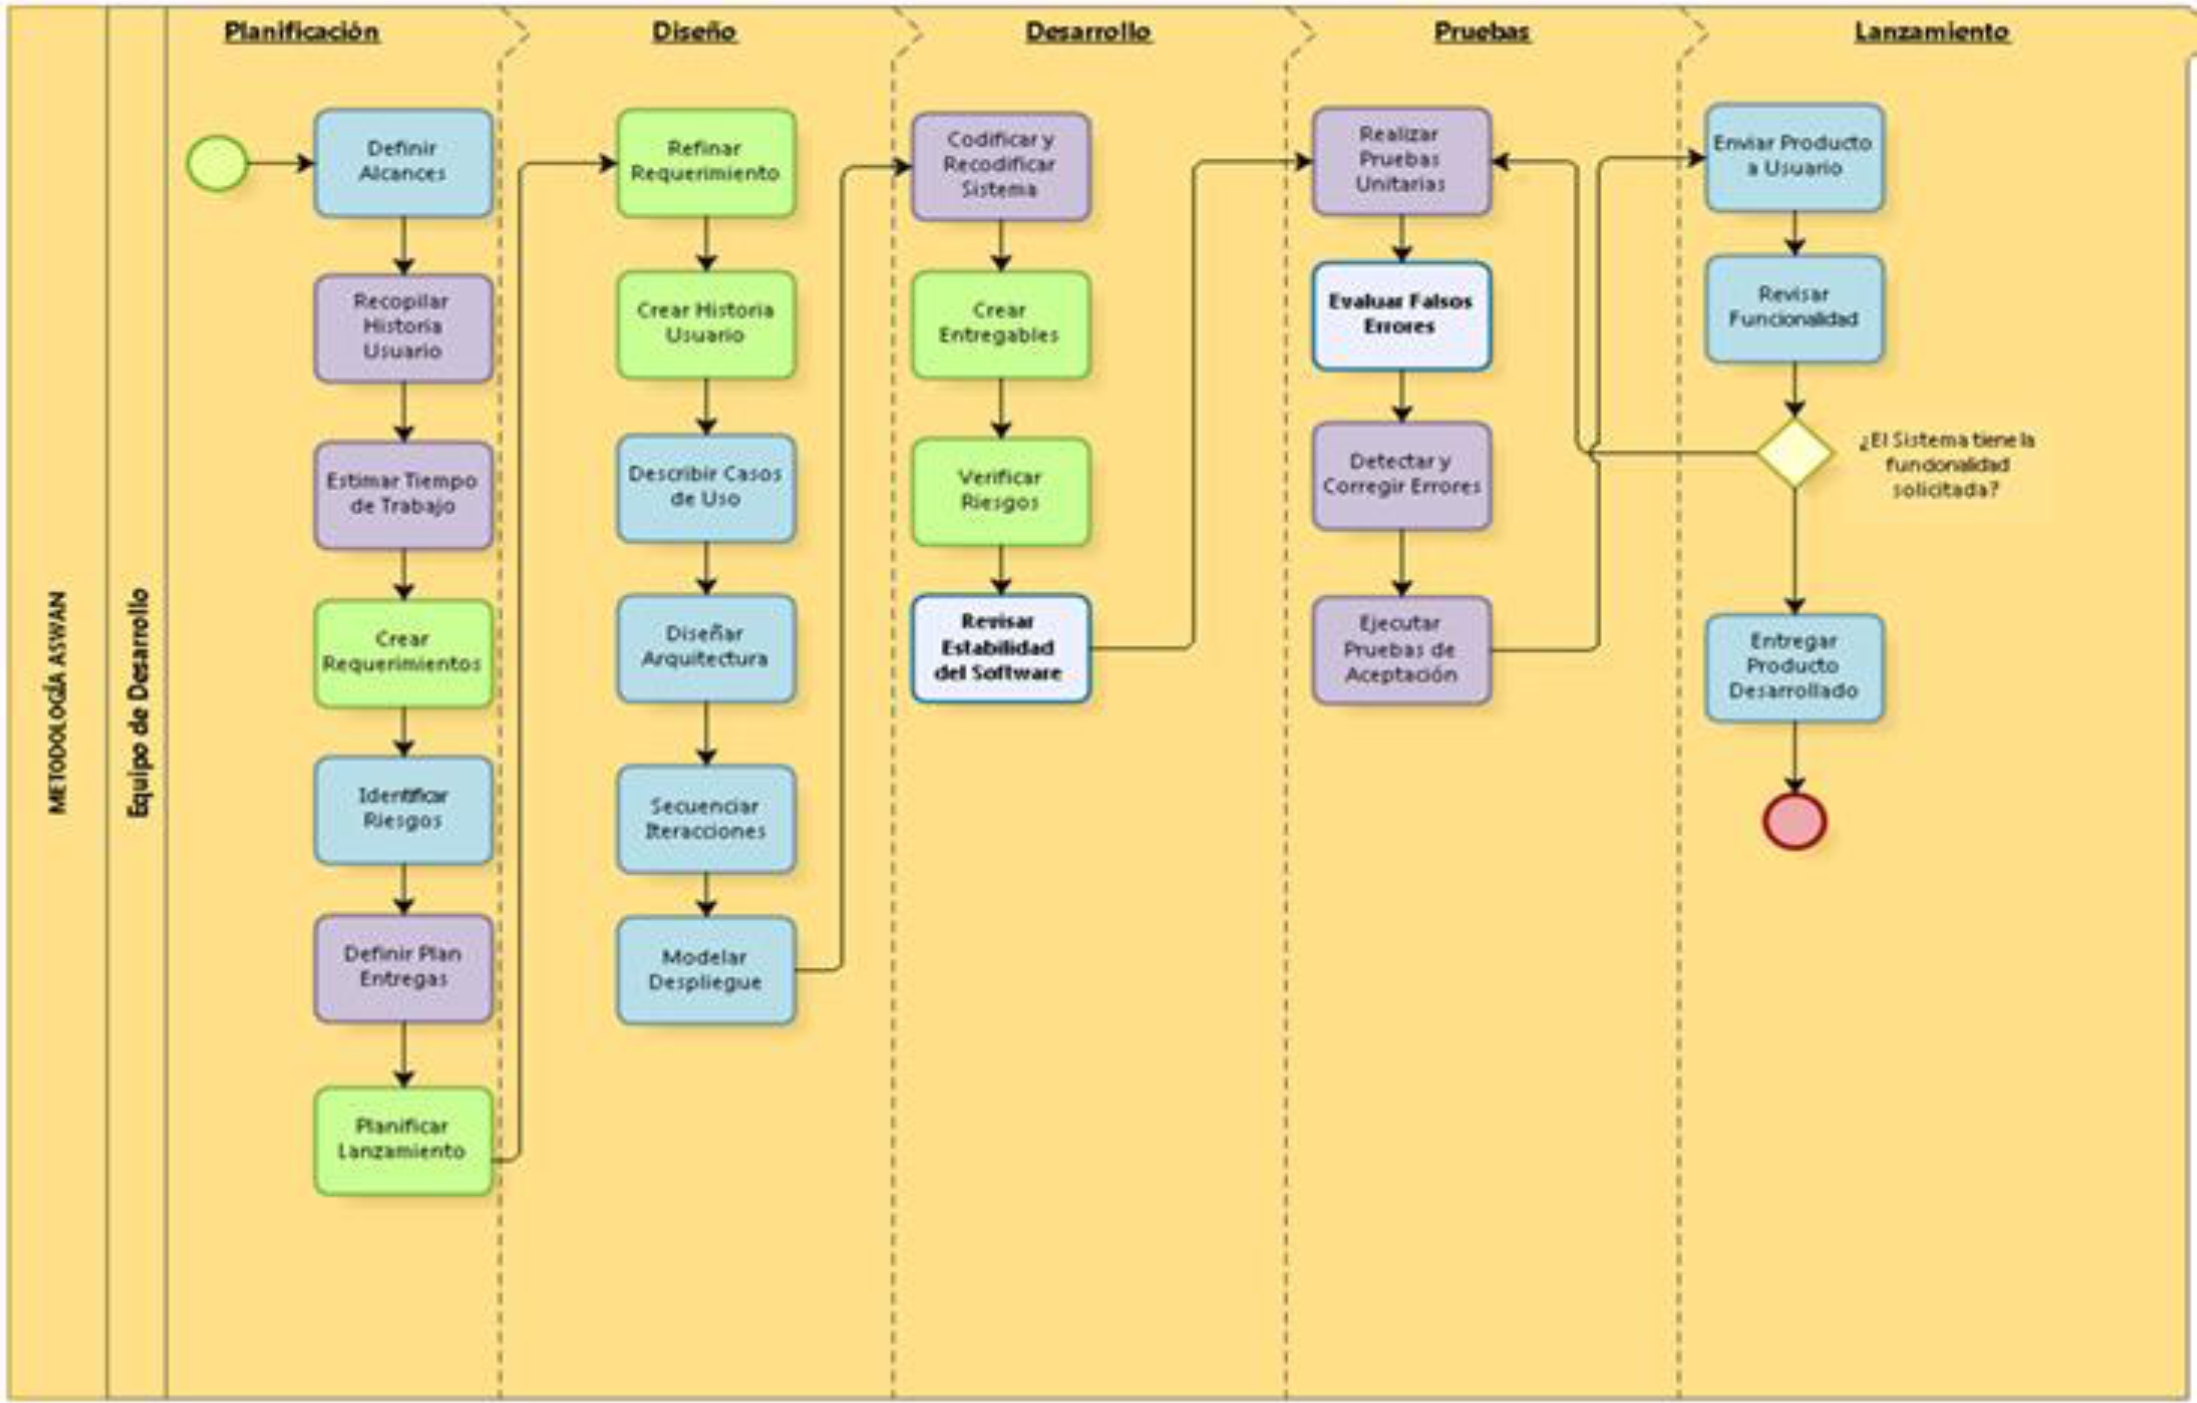
It is an agile methodology for software development designed based on the principles of the Scrum, RUP, and Extreme Programming (XP) models, developed in a later section. It consists of five phases as shown in Figure 1.
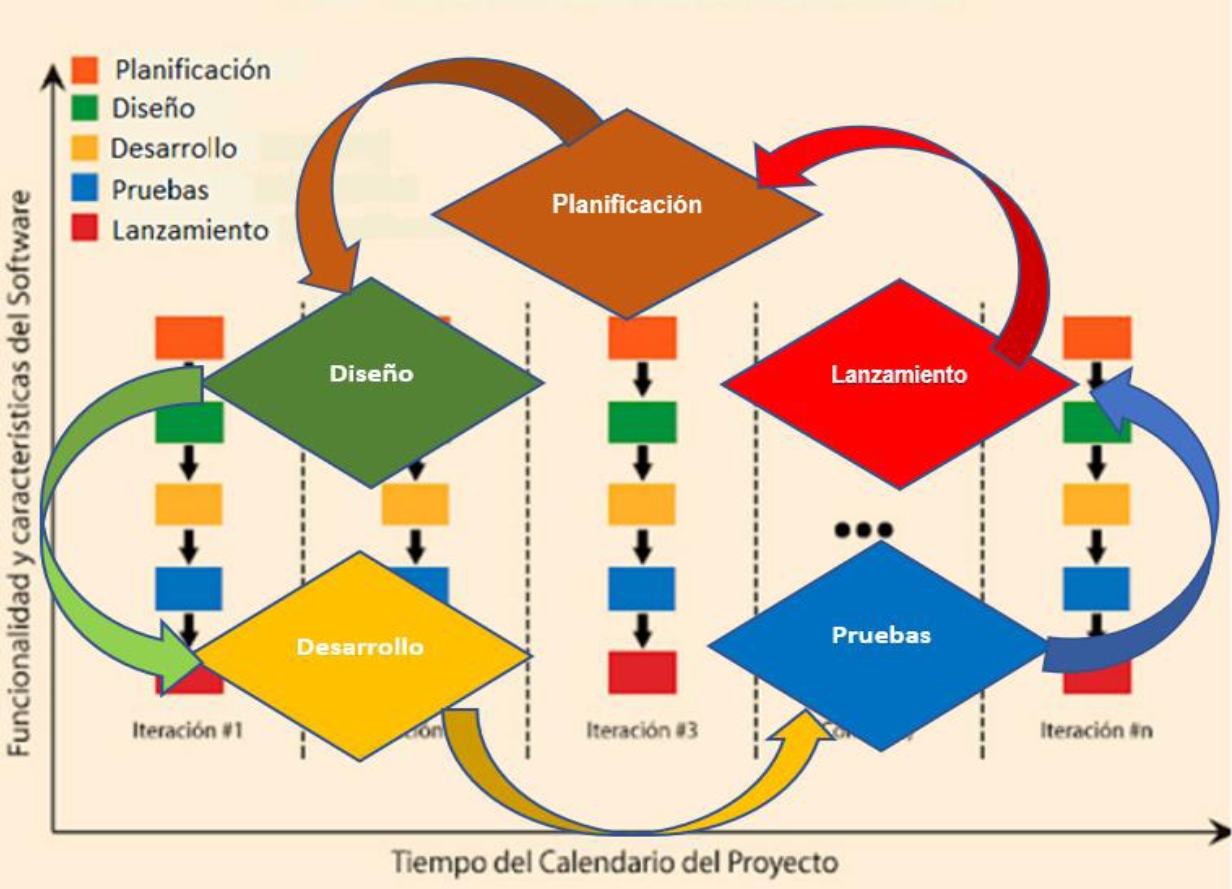
The phases of the new ASWAN methodology are as follows: Phase 1: Planning, where the product vision is formalized, some user stories are described, risks, time, software requirements are estimated, and the Deliverables Plan is defined. Phase 2: Design, where user stories are defined and use cases are developed, along with the creation of corresponding UML diagrams.
Software requirements are also determined, and the architecture design and system prototype development are carried out. Phase 3: Development, involves coding the program to generate a version of the system, developing the sequence of iterations, the deployment model, and updating risks. Phase 4: Testing, this phase is prior to obtaining the finished version of the system and involves unit testing to detect and correct faults, followed by acceptance testing. Phase 5: Launch, in this phase the owner or user reviews the functionality and quality of the product and receives the developed system and corresponding user manual.
3.2 Applied Research Methodology
In this subsection, the specific methodology applied in the study is delved into. Reasons behind the choice of this methodology, how it was adapted to the research context, and the concrete steps that were followed are discussed. Advantages and possible limitations of this approach will also be touched upon. Clarity in this section is crucial for readers to understand the validity and applicability of the results derived.
3.2.1 Operationalization of Variables
Table 1 shows the indicators, their unit of measure, the index, the unit of measure, the instrument for data collection.
3.2.2 Research Design
This research adopts an experimental design classified under the category of "pure" experiments. It involves comparing the experimental group (Ge), which will receive the stimulus (mobile application) for apartment sales management processes, randomly selected (R), with post-test data yielding O1.
Subsequently, a stimulus (X) based on the collaborative metamodel ASWAN is applied, resulting in post-test data for the control group (Gc), O2, which did not receive the stimulus. This is an applied type of pure experimental design:
3.2.3 Universe and Sample
The universe for this study was identified as all apartment sales management processes in real estate groups and startup companies across Latin America. These processes are unspecified and indeterminate (N = Indeterminate). The sample consisted of the sales management processes at NERMAR real estate, with a known sufficient sample size of n = 30 for process optimization.
3.2.4 Data Collection Procedure
Various techniques and instruments were used for data collection in this field research, including both direct and indirect observation, and tools such as observation guides and reports.
3.2.5 Hypothesis Statement
The following hypotheses were proposed:
H1: Developing a Mobile Application increases the number of Qualified Prospects in apartment sales management at NERMAR real estate.
H2: Developing a Mobile Application reduces the Time for Presentation and Demonstration in apartment sales management at NERMAR real estate.
H3: Developing a Mobile Application increases the Number of Closed Sales in apartment sales management at NERMAR real estate.
For hypothesis testing, the following statistical approach was adopted for each indicator:
µ1 = Population mean (H1, H3) for Post-Test Gc.
µ2 = Population mean (H1, H3) for Post-Test Ge.
where:
Additionally:
µ1 = Population mean (H2) for Post-Test Gc.
µ2 = Population mean (H2) for Post-Test Ge.
where:
The data normality test was conducted, followed by descriptive statistical analysis (See Tables 6 and 7), and the hypotheses were validated using the Student's t-test with Minitab software.
Table 2 Risk management structure
| Risk Management | Risk Analysis | |
| Risks | Probability | Impact |
| Project Risks | ||
| Unrealistic budgets | Moderate | Serious |
| Inadequate personnel | Moderate | Critical |
| Resource loss | Moderate | Critical |
| Client requirement changes | Moderate | Critical |
| Incomplete requirements | Moderate | Critical |
| Technical Risks | ||
| Design, design rework required | Moderate | Serious |
| Implementation, component deficiencies | High | Critical |
| Interface, erroneous development | High | Critical |
| Business Risks | ||
| Market, country risk change | High | Critical |
| Strategy, management direction changes | Low | Serious |
| Management, financial issues | Low | Serious |
| Budget, mistaken estimation | Low | Serious |
Table 3 White box testing user login
| White Box Testing: Login Code | ||
| No. of Paths | Independent Path Routes | |
| Formula V(G)=P+1=2+1=3 V(G)=Cyclomatic Complexity P=Predicate Nodes |
1 | 1 – 5 - 6 |
| 2 | 1 – 2 – 3 - 6 | |
| 3 | 1 – 5 – 4 – 2 - 3 - 6 | |
Table 4 Black box testing scenario
| ID_CODE_PR | SCENE | USER | PASS-WORD | RESULT |
| CÓD_PR_1 | SCENE | A | Enter password | |
| CÓD_PR_2 | SCENE | ADM | Enter user | |
| CÓD_PR_3 | SCENE | Enter password |
Table 5 Post-test results for Gc and Ge for I1, I2, I3
| Measurement | I1: Number of Qualified Prospects / Leads | I2: Time for Presentation and Demonstration Min. | I3: Number of Closed Sales / Department | |||
| Frequency | Weekly | Biweekly | Biweekly | |||
| N° | PostTest Gc | PostTest Ge | PostTest Gc | PostTest Ge | PostTest Gc | PostTest Ge |
| 1 | 19 | 21 | 19.00 | 14.15 | 8 | 10 |
| 2 | 15 | 20 | 27.00 | 13.00 | 6 | 8 |
| 3 | 10 | 15 | 28.00 | 17.27 | 7 | 9 |
| 4 | 13 | 17 | 24.00 | 14.50 | 7 | 11 |
| 5 | 20 | 22 | 26.00 | 18.20 | 9 | 10 |
| 6 | 16 | 20 | 25.00 | 16.25 | 6 | 8 |
| 7 | 12 | 16 | 22.00 | 15.00 | 10 | 12 |
| 8 | 10 | 14 | 26.00 | 15.00 | 12 | 11 |
| 9 | 14 | 18 | 22.00 | 16.50 | 4 | 6 |
| 10 | 18 | 21 | 25.00 | 17.45 | 7 | 9 |
| 11 | 16 | 20 | 24.00 | 15.30 | 6 | 7 |
| 12 | 15 | 16 | 22.00 | 16.22 | 5 | 6 |
| 13 | 16 | 21 | 21.00 | 14.55 | 8 | 9 |
| 14 | 14 | 19 | 19.00 | 17.42 | 8 | 10 |
| 15 | 10 | 15 | 21.00 | 15.55 | 6 | 8 |
| 16 | 15 | 14 | 29.00 | 14.41 | 5 | 7 |
| 17 | 13 | 16 | 28.00 | 16.54 | 7 | 8 |
| 18 | 14 | 17 | 27.00 | 15.47 | 4 | 6 |
| 19 | 11 | 14 | 23.00 | 17.56 | 8 | 9 |
| 20 | 10 | 17 | 22.00 | 14.55 | 7 | 8 |
| 21 | 12 | 15 | 25.00 | 15.44 | 8 | 9 |
| 22 | 16 | 20 | 24.00 | 16.49 | 6 | 8 |
| 23 | 11 | 15 | 27.00 | 18.54 | 5 | 6 |
| 24 | 14 | 16 | 21.00 | 17.43 | 6 | 8 |
| 25 | 11 | 15 | 26.00 | 15.55 | 10 | 12 |
| 26 | 13 | 18 | 28.00 | 18.44 | 5 | 8 |
| 27 | 12 | 17 | 29.00 | 15.49 | 7 | 10 |
| 28 | 17 | 19 | 27.00 | 17.43 | 5 | 7 |
| 29 | 14 | 19 | 27.00 | 16.30 | 6 | 8 |
| 30 | 13 | 18 | 24.00 | 15.38 | 4 | 10 |
Table 6 Descriptive statistics results of quantitative indicators
| Indicator | n | Mean | StDev | AD | p-value |
| I1:PostTest Gc | 30 | 13.80 | 2.696 | 0.364 | 0.417 |
| I1:PostTest Ge | 17.50 | 2.403 | 0.611 | 0.102 | |
| I2:PostTest Gc | 30 | 24.60 | 2.884 | 0.507 | 0.185 |
| I2:PostTest Ge | 16.05 | 1.389 | 0.389 | 0,362 | |
| I3:PostTest Gc | 30 | 6.7 | 1.893 | 0.651 | 0.081 |
| I3: PostTest Ge | 8.6 | 1.694 | 0.628 | 0.092 |
3.2.6 Solution Development Methodology
This section provides a detailed overview of how the proposed solution was designed and created for the study. It describes the steps, tools, and strategies employed to develop the solution, whether it be a mobile application, software, or any other product.
This section is crucial for understanding how the research problem was approached and solved, ensuring the replicability and effectiveness of the proposed solution.
3.2.7 Reviewed Methodologies
The collaborative metamodel ASWAN has been designed incorporating the foundations of the following agile methodologies: Scrum, Rational Unified Process (RUP), and Extreme Programming (XP).
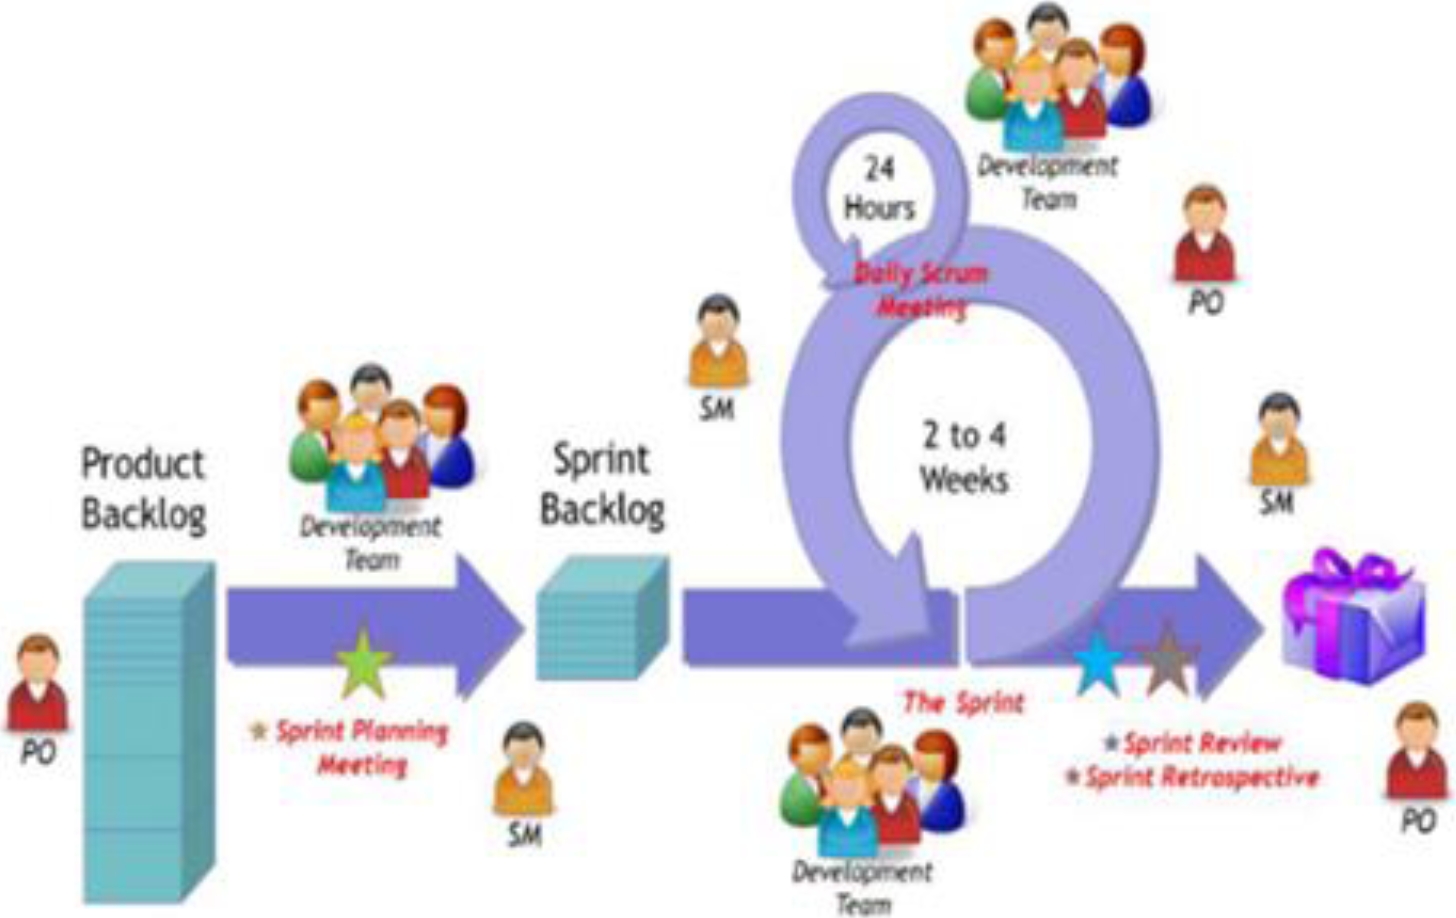
– Scrum
Scrum is a framework that aids in generating value through adaptable solutions to complex problems, comprising a Scrum Master, Product Owner, and the development team. (See Figure 2).
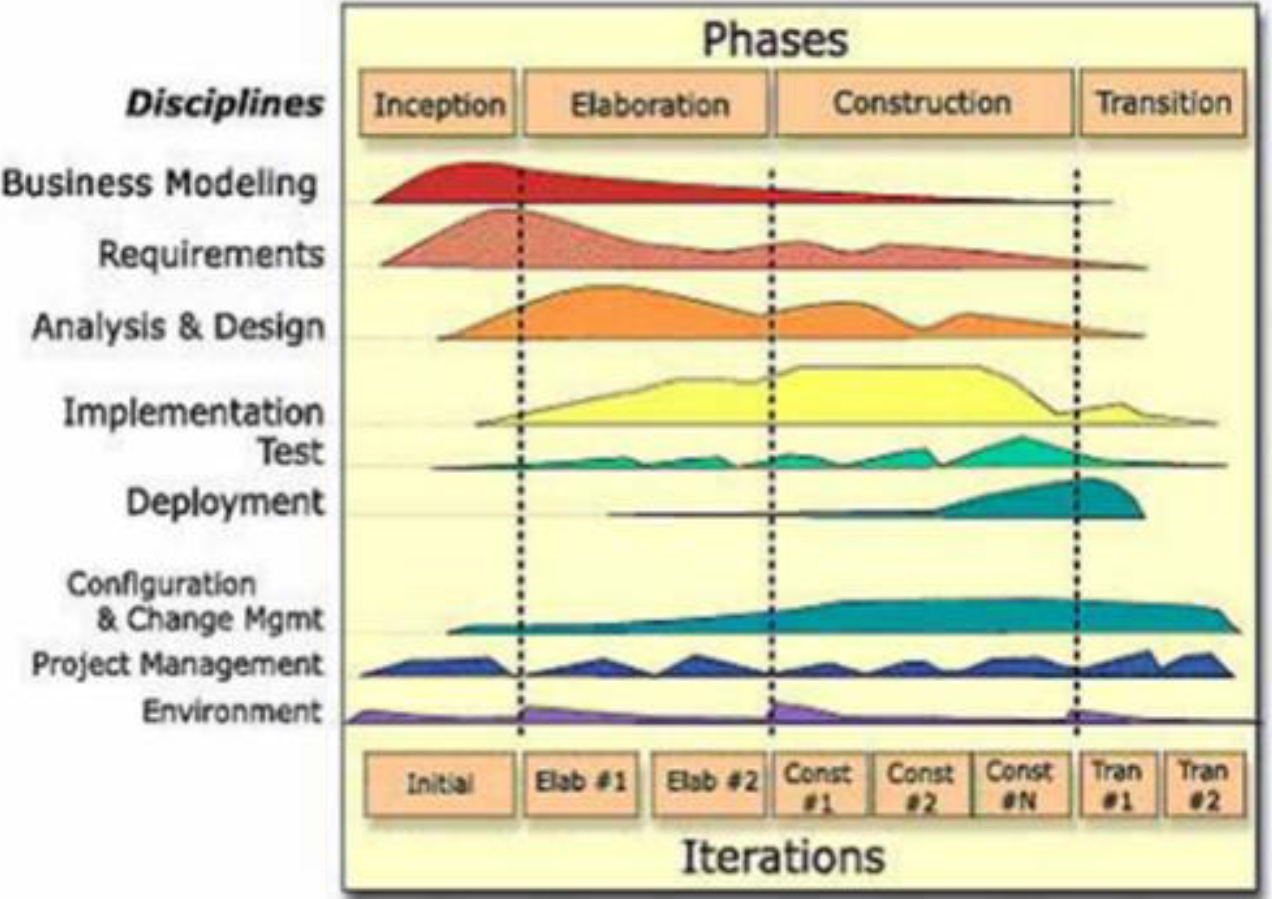
– Rational Unified Process (RUP)
The Rational Unified Process (RUP) focuses on planning, modeling, implementing, and monitoring the software development lifecycle, providing a robust framework for project management and quality control. (See Figure 3).
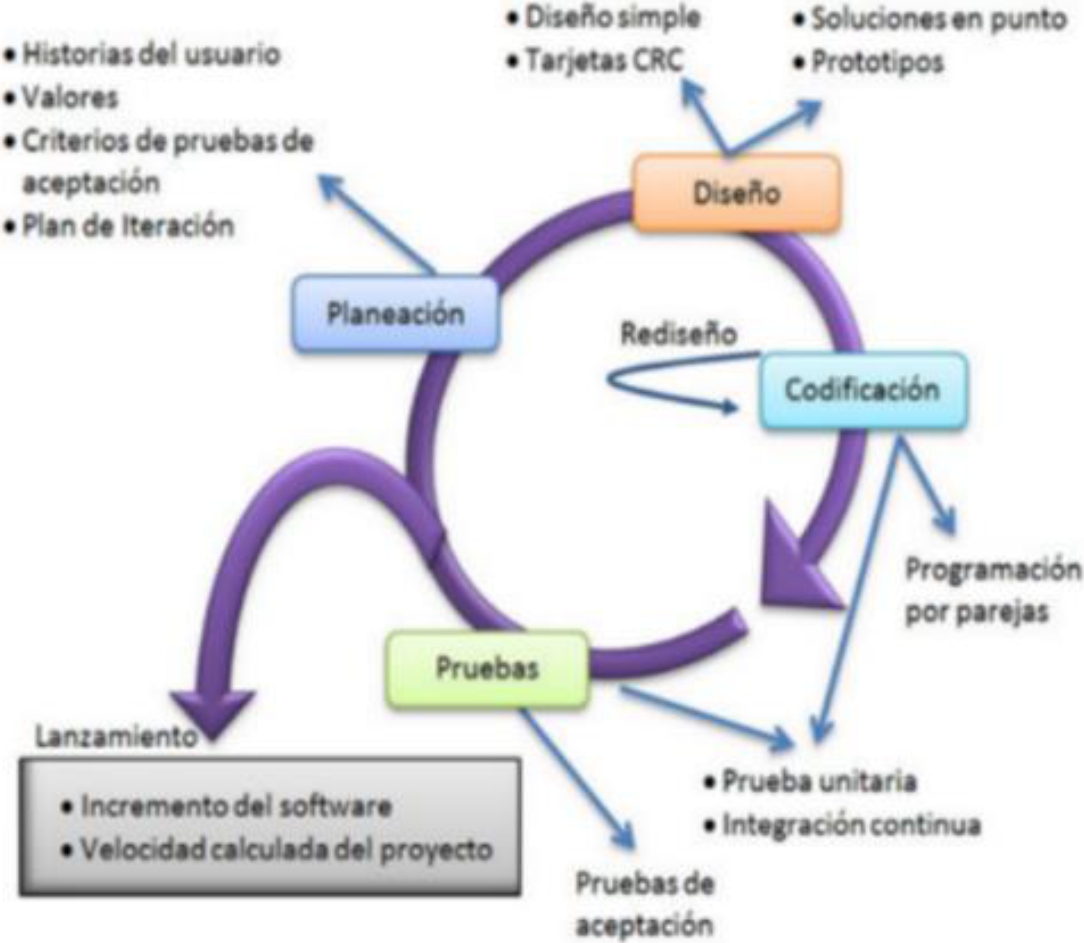
– Extreme Programming (XP)
The XP methodology defines four variables: cost, time, quality, and scope. It employs short development cycles called iterations, with functional deliverables at the end of each cycle. It consists of four phases, (See Figure 4).
3.2.8 Collaborative Metamodel: ASWAN
– Methodology
Following a thorough analysis of existing models, a new model was created, and the flowchart of the new ASWAN methodology is presented. (See Figure 5).
4 Case Study
The Collaborative Metamodel ASWAN, which comprises five phases: Planning, Design, Development, Testing, and Release, was applied.
4.1 Phase 1: Planning
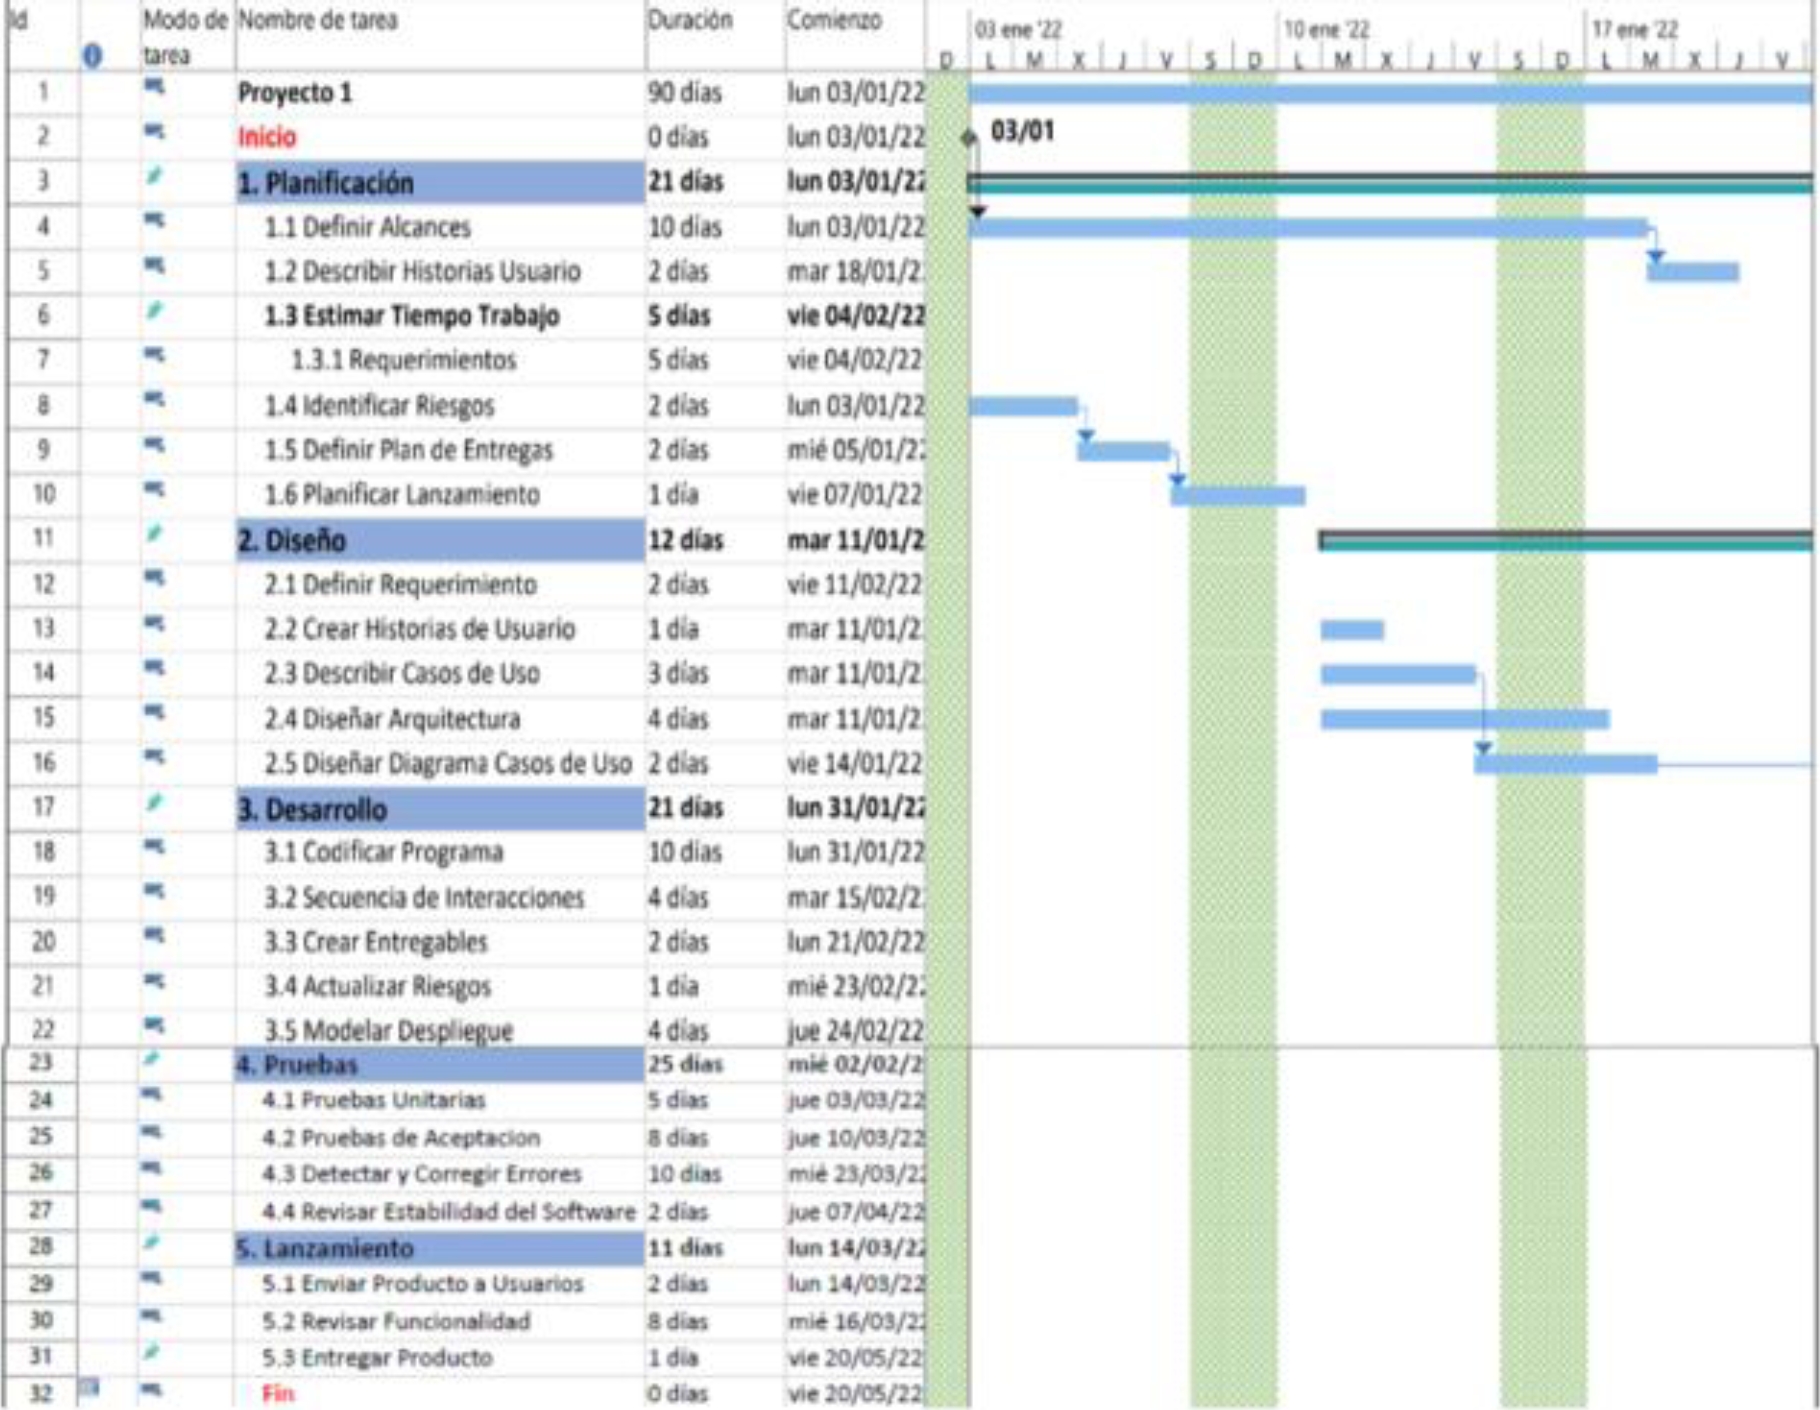
The aim of this phase is to estimate technological resources, time, and project risks. It also involves detailing User Stories and preparing the Deliverables Plan. The project planning schedule is displayed (See Figure 6).
4.2 Phase 2: Design
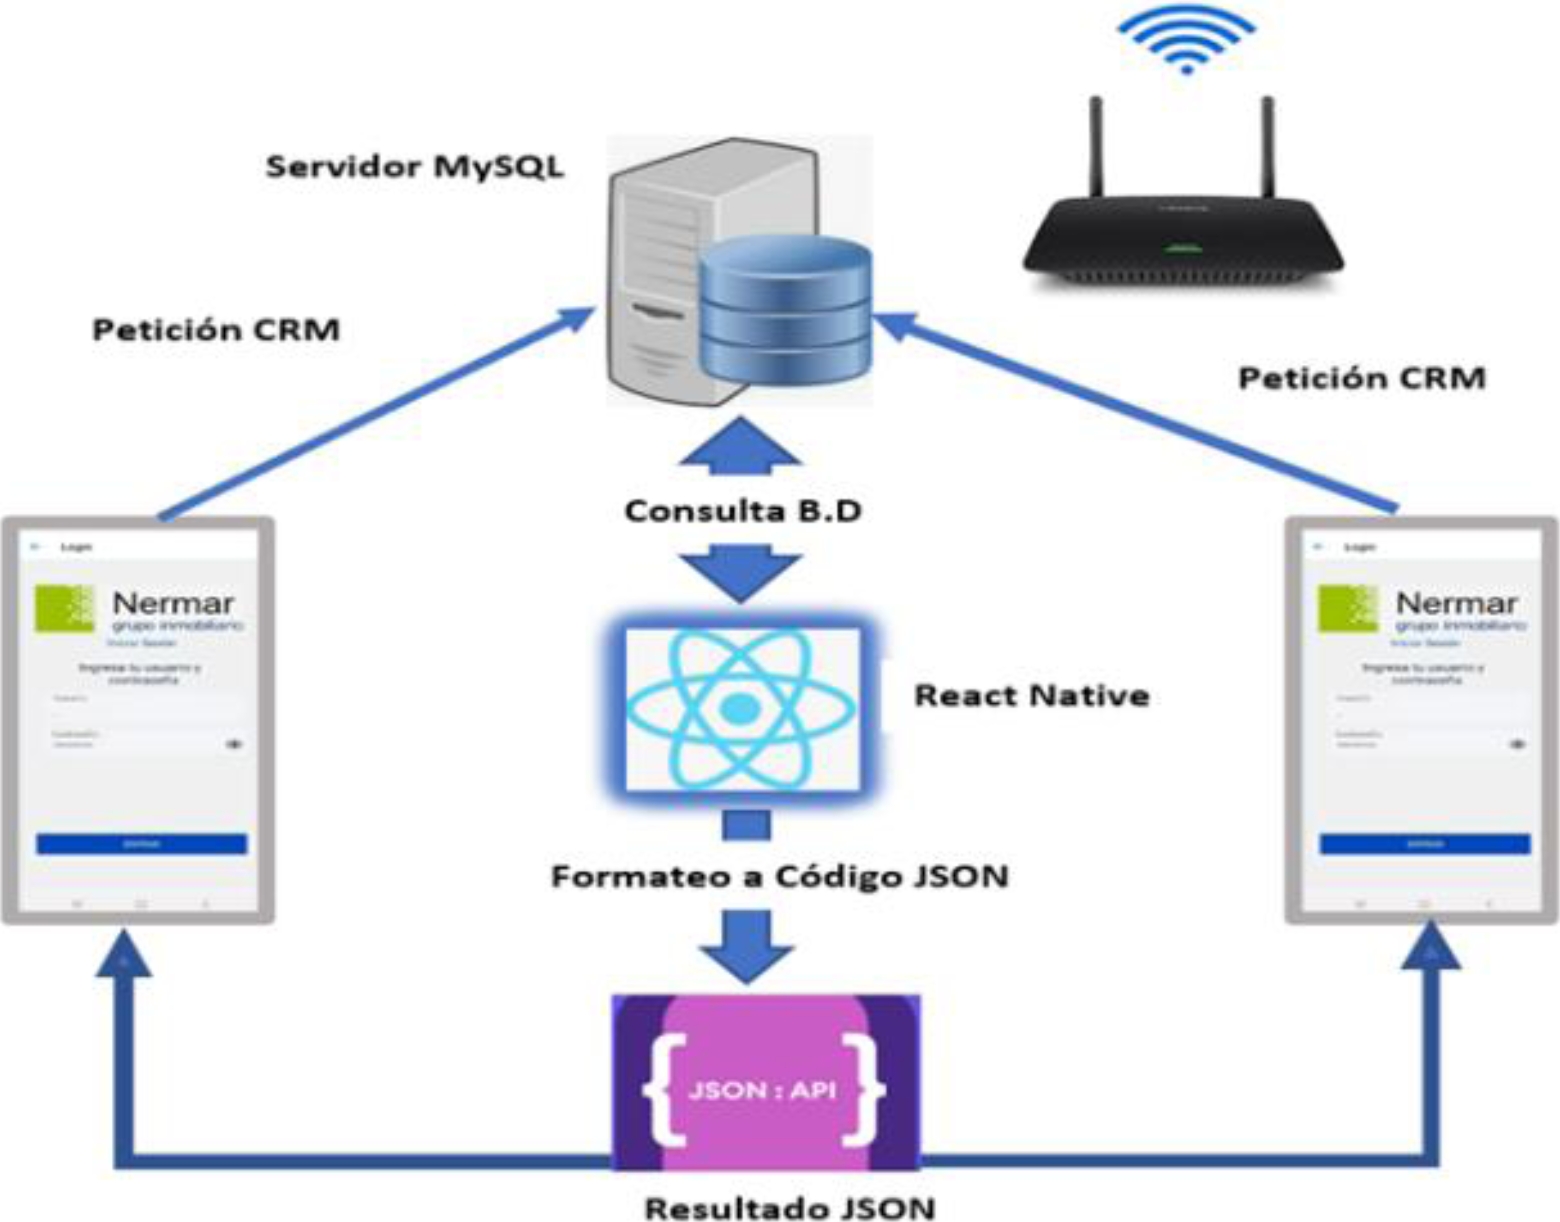
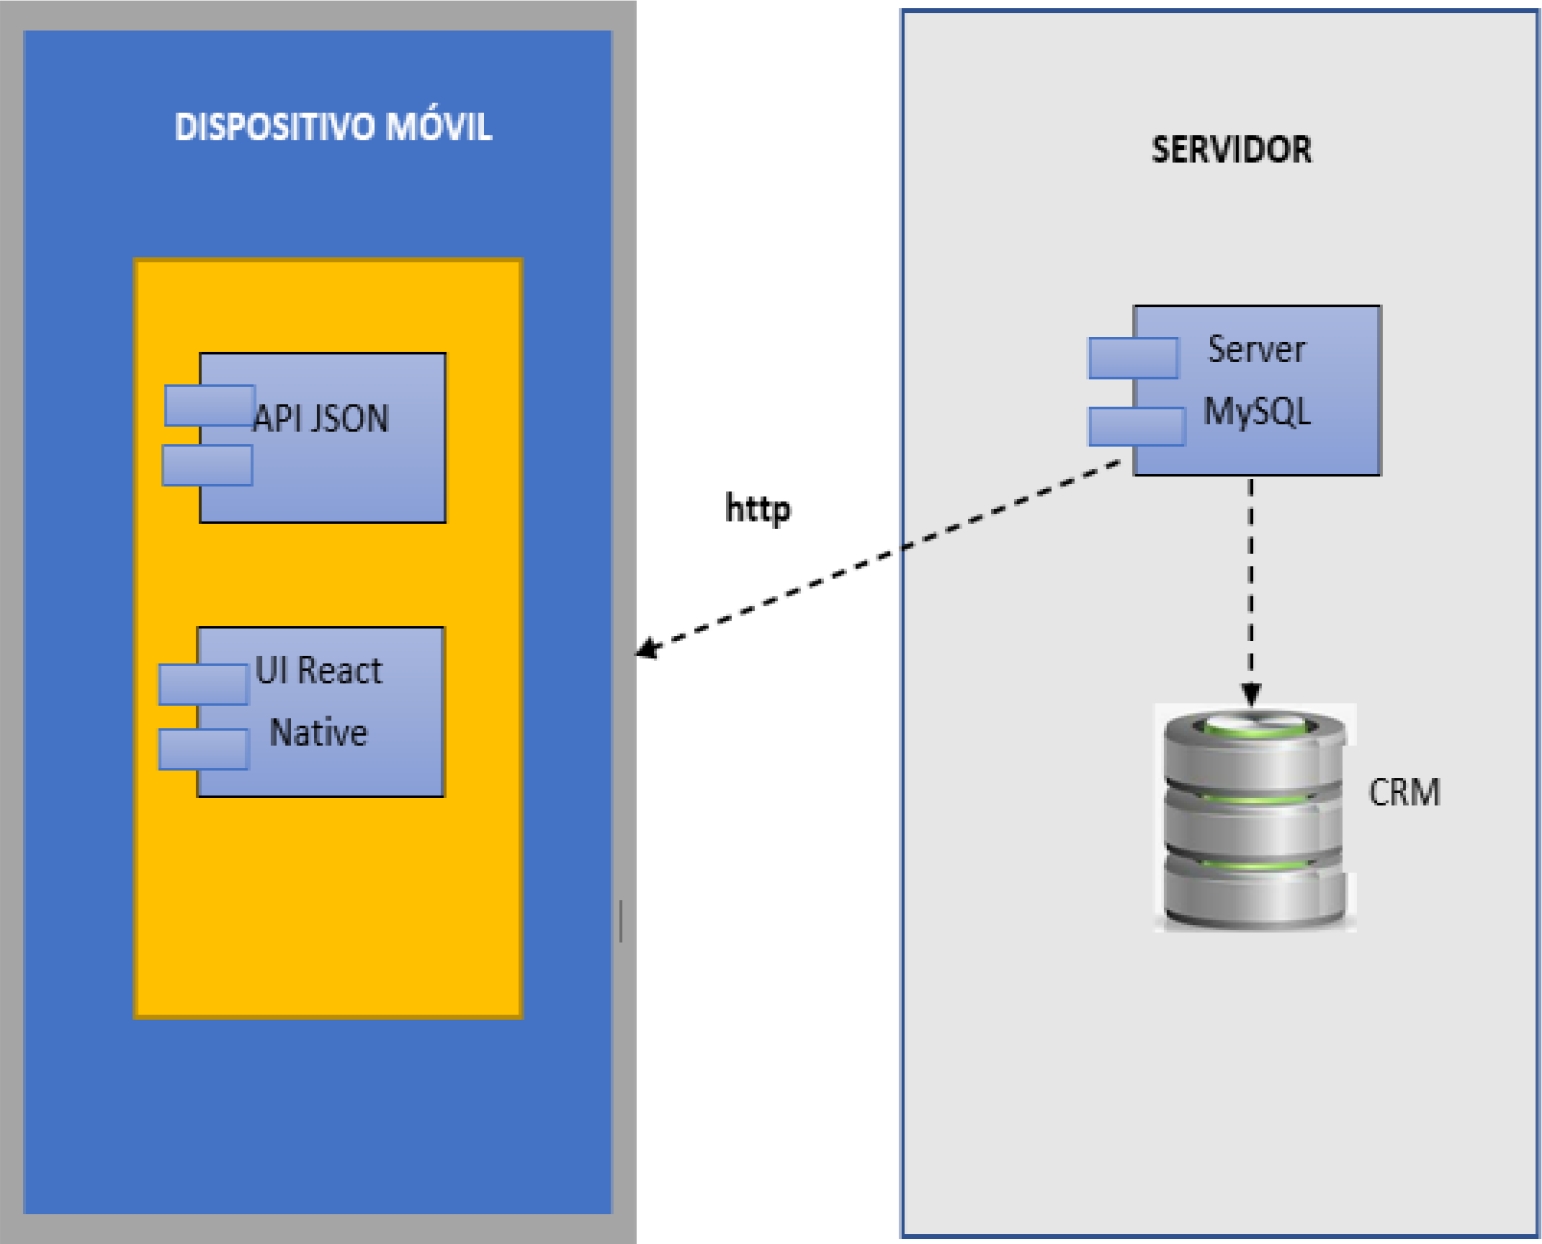
This phase focuses on designing the solution's architecture; it involves defining component requirements, software, User Stories, Use Cases, and creating UML Diagrams. Deployment diagram of the mobile solution and application architecture (See Figure 7).
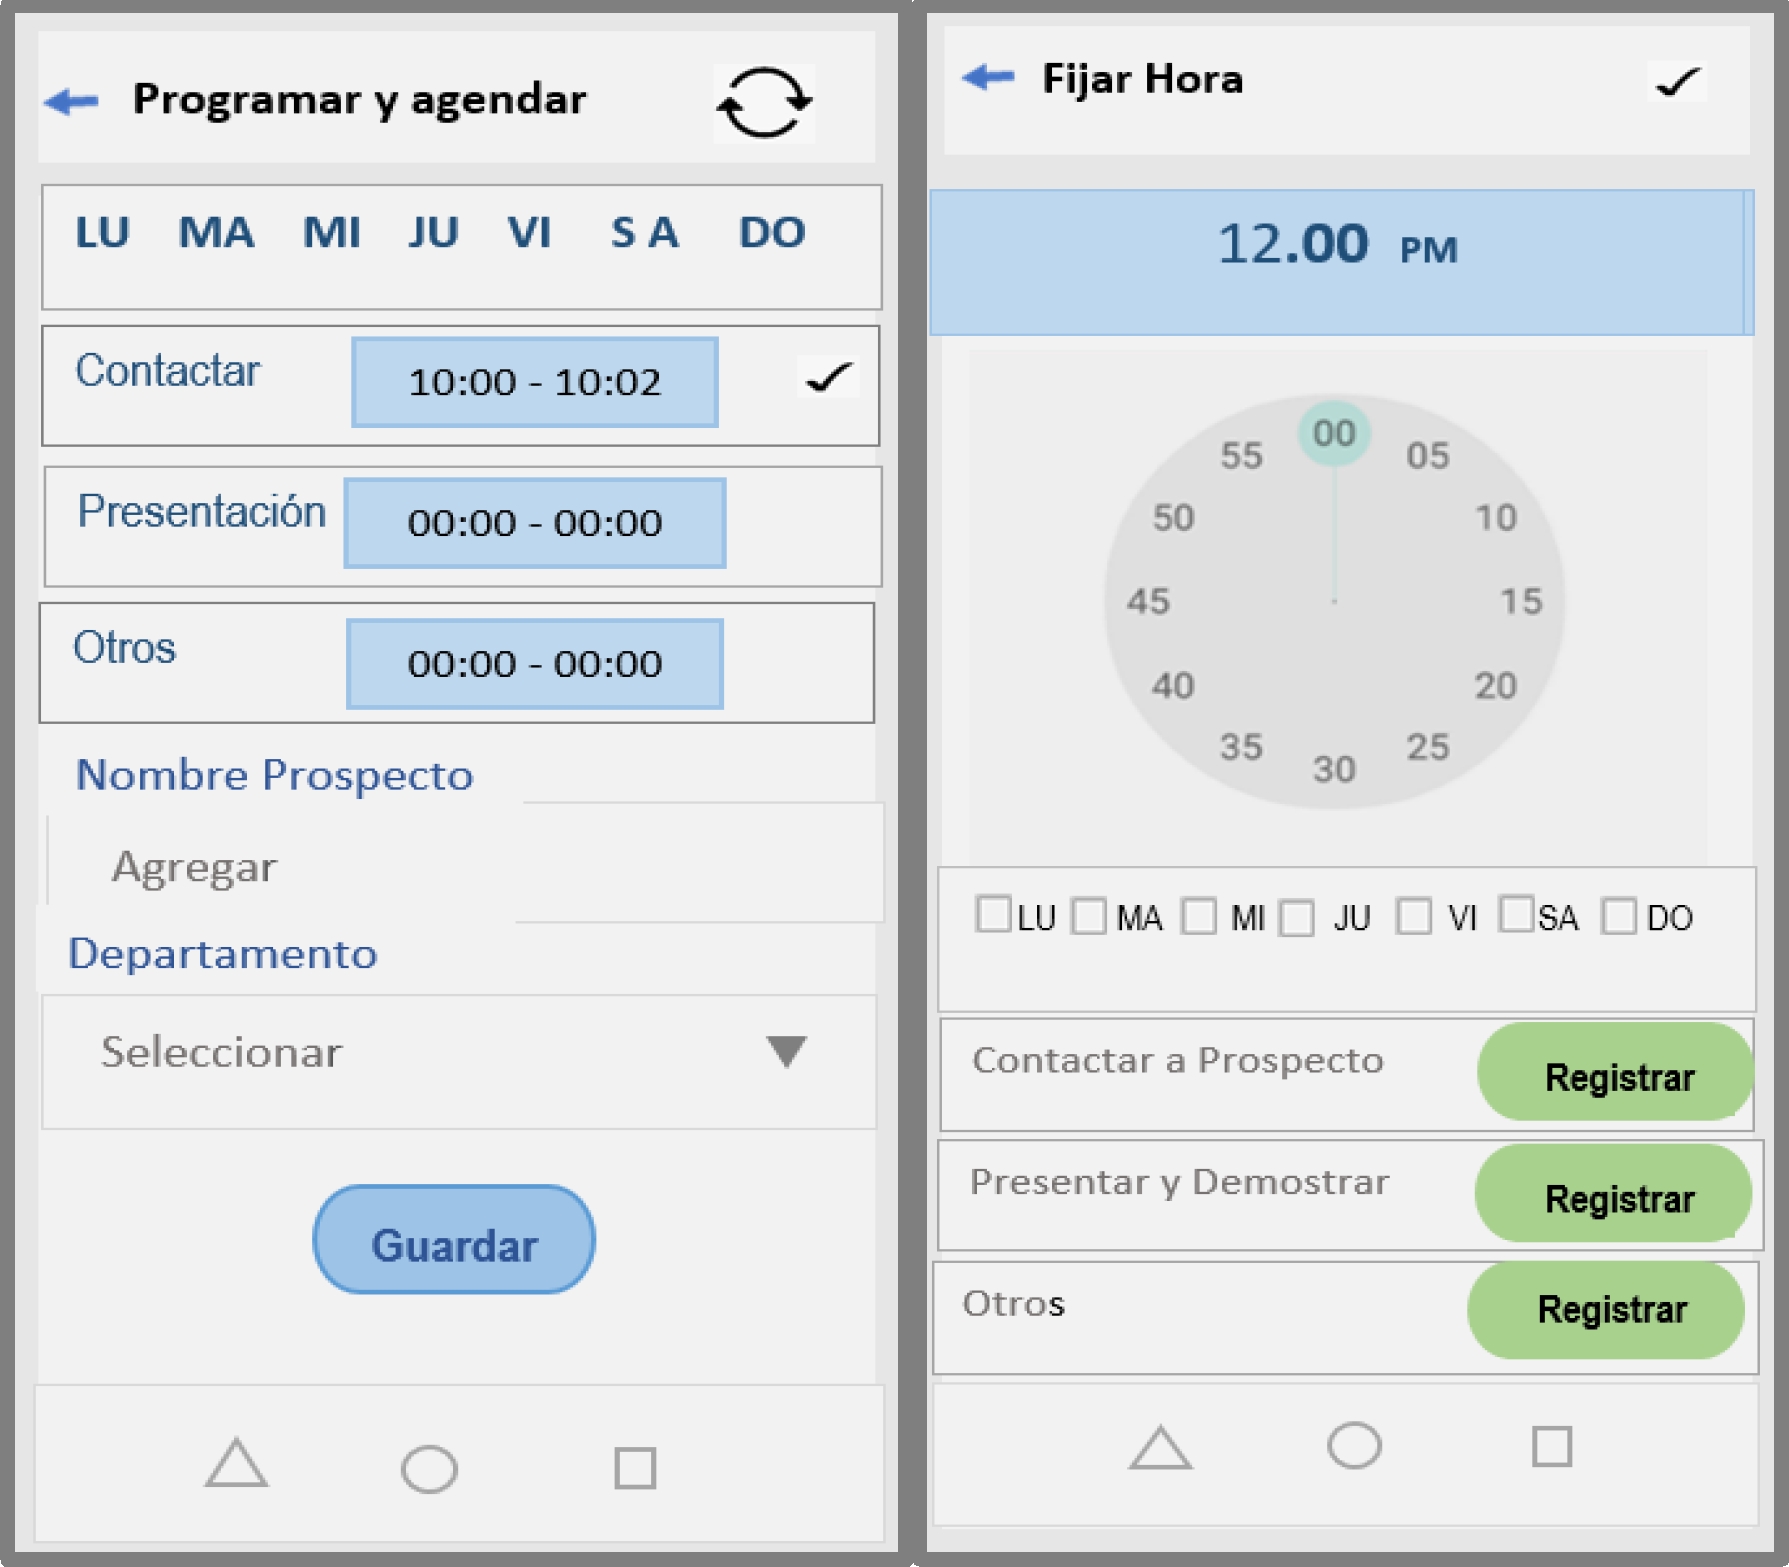
Figures 8 show the application prototypes on the presentation and login screens.
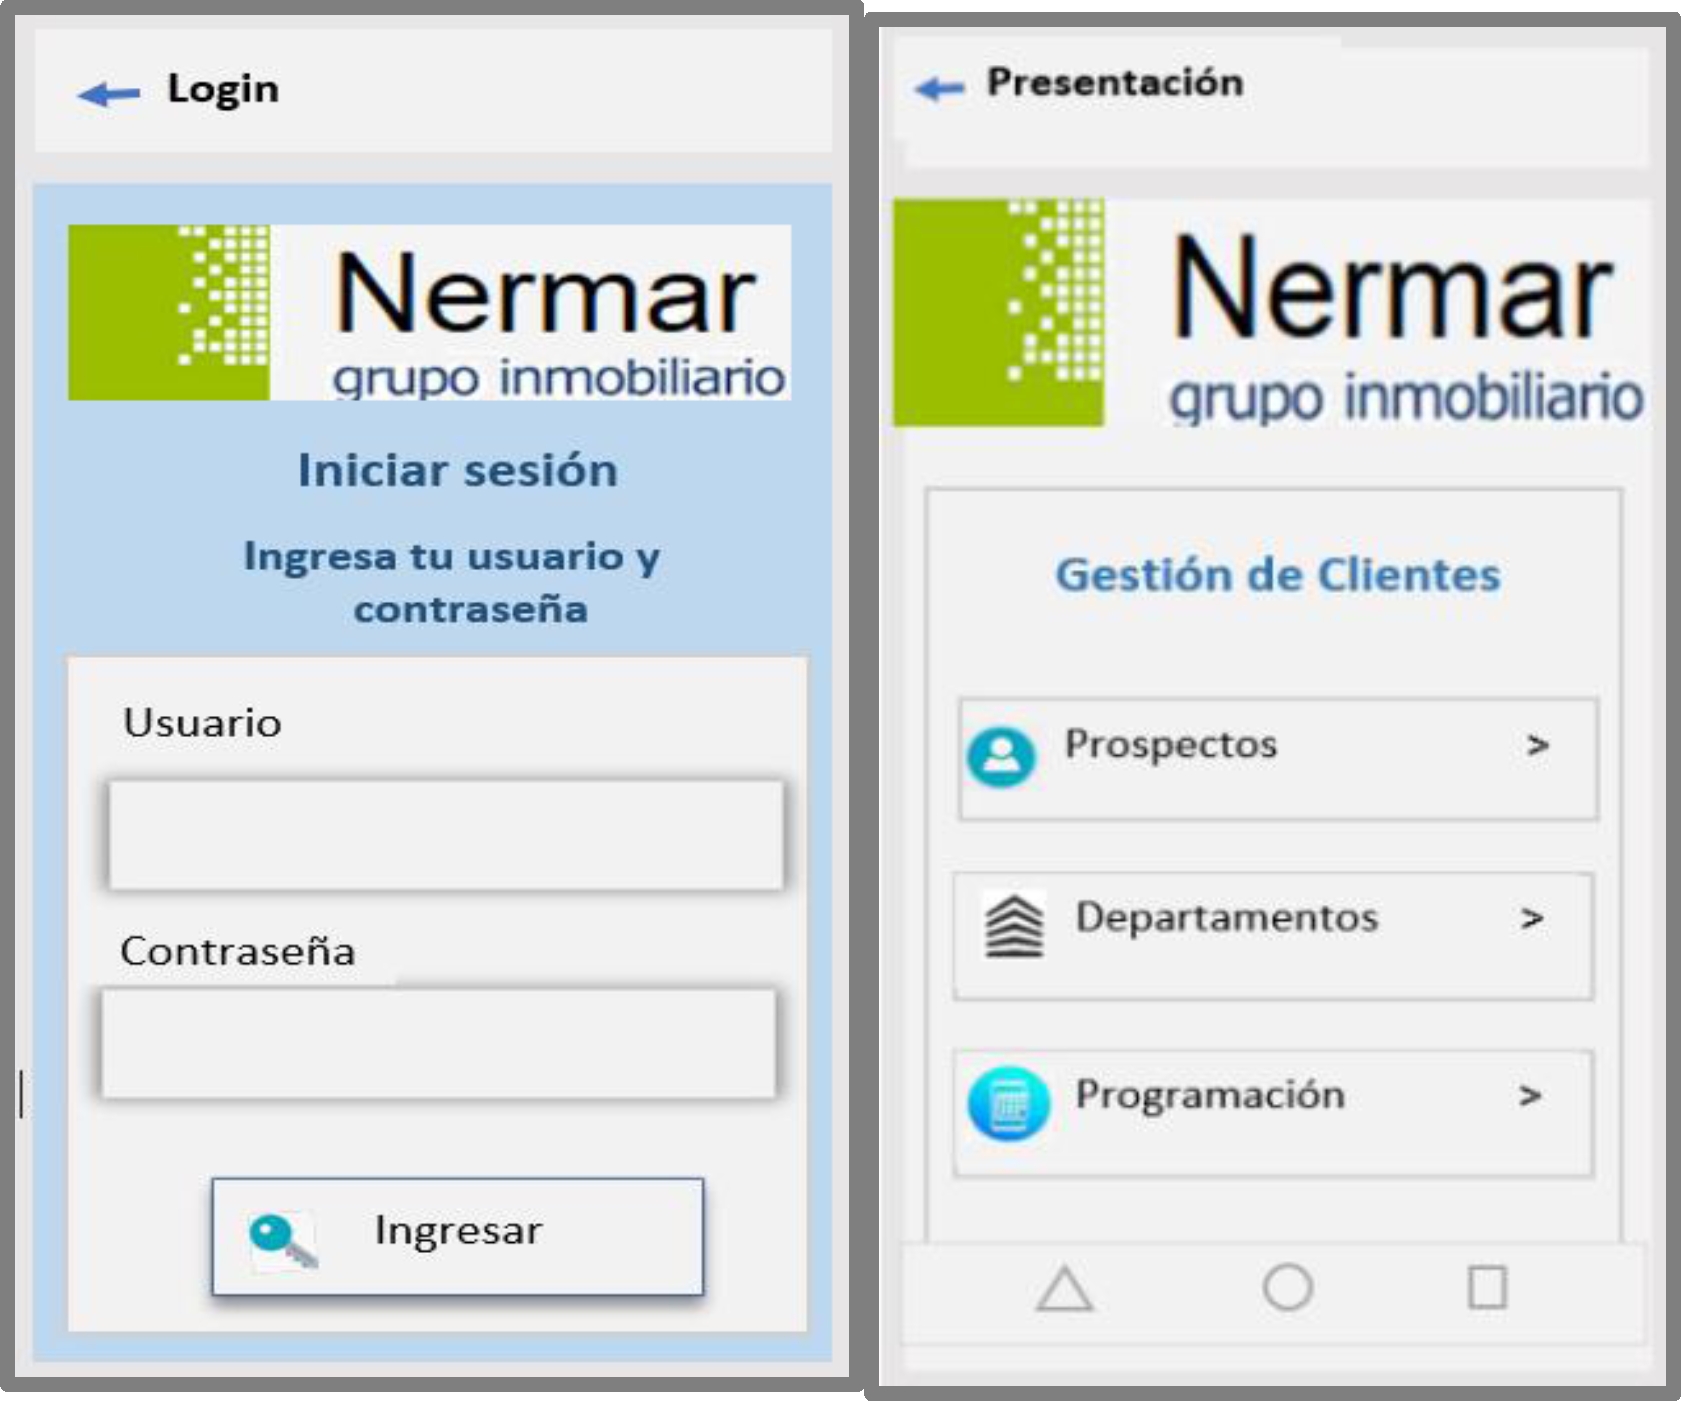
Figure 9 describes how the application allows managing and organizing schedules to communicate with the buyer and provide sales condition information as quickly as possible. The interface for scheduling and setting times.
4.3 Phase 4: Development
This phase involves coding the system and creating its versions. Additionally, the iteration sequences that will guide the development are planned, displaying a version of the implementation diagram (See Figure 10).
– Risk Management
During the software development lifecycle, Project Risks, Technical Risks, and Business Risks were considered; the analysis criteria were: Probability: High, Moderate, and Low; impact level: Serious and Critical. The Risk Management structure is shown in Table 2.
4.4 Phase 4: Testing
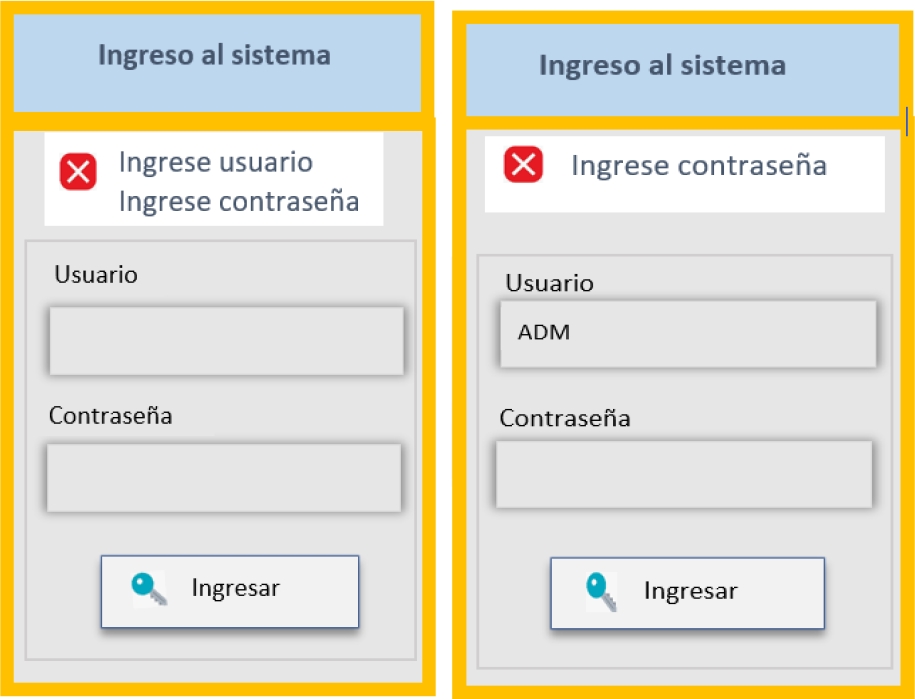
During this stage, Test Plans were developed throughout the system development cycle; both White Box and Black Box testing were used to evaluate functionality, installation, compatibility, usability, and network connection.
All these aspects were aimed at measuring the following attributes: Availability, Robustness, Usability, Configuration, Maintenance, and Security of the mobile application.
– White Box Testing
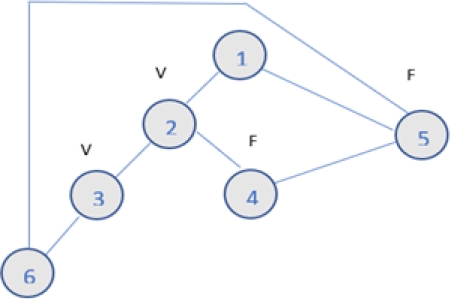
It shows the tests performed on user login, path graph: Login (See Table 3 and Figure 11).
– Black Box Testing
4.5 Phase 5: Release
– The release phase is a crucial stage in the project development cycle, as it involves implementing and launching the system in a production environment. During this phase, extensive testing is carried out to ensure the stability and functionality of the system, and any emerging issues are addressed.
– Additionally, training is provided for the staff who will use the system, and procedures are established for technical support and ongoing monitoring.
– This section of the article highlights the importance of the outcomes and findings obtained, which become the essential foundation for understanding the transition from development to the effective operation and use of the system.
– The implementation of a software development metamodel called ASWAN is proposed as a solution to enhance apartment sales management in the real estate context. This approach promises to offer a solid basis for decision-making and effective system management in this specific sector.
5 Results and Discussion
Reduction in Time to Contact Prospects, Time of Presentation and Demonstration, Number of Prospects Withdrawn. Increase in Number of Qualified Prospects, Number of Closed Sales.
5.1 Experimental Results
For our purposes, measurements were taken from two groups: the control group and the experimental group. Employing statistical techniques, 30 values were obtained for each of the indicators established in the study. The results are detailed in Table 5. Undoubtedly, the implementation of the innovative collaborative metamodel ASWAN yielded positive results in all three indicators.
5.2 Normality Test
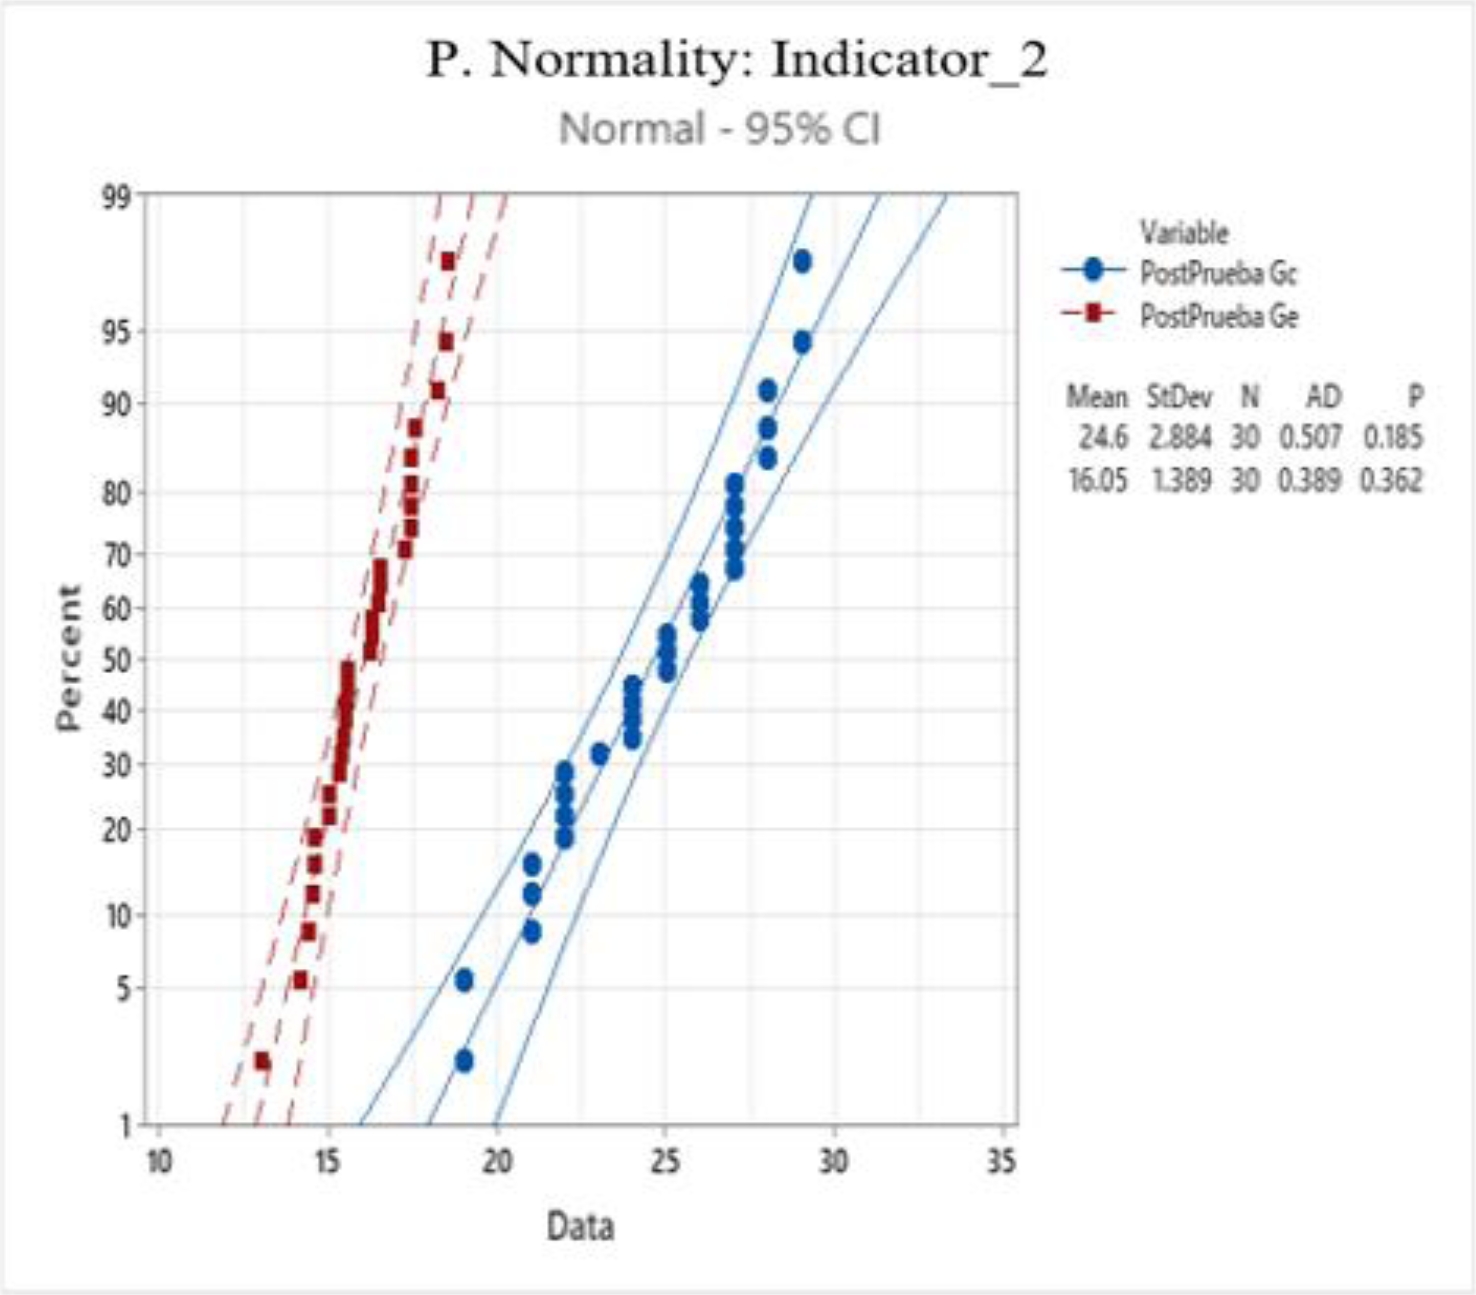
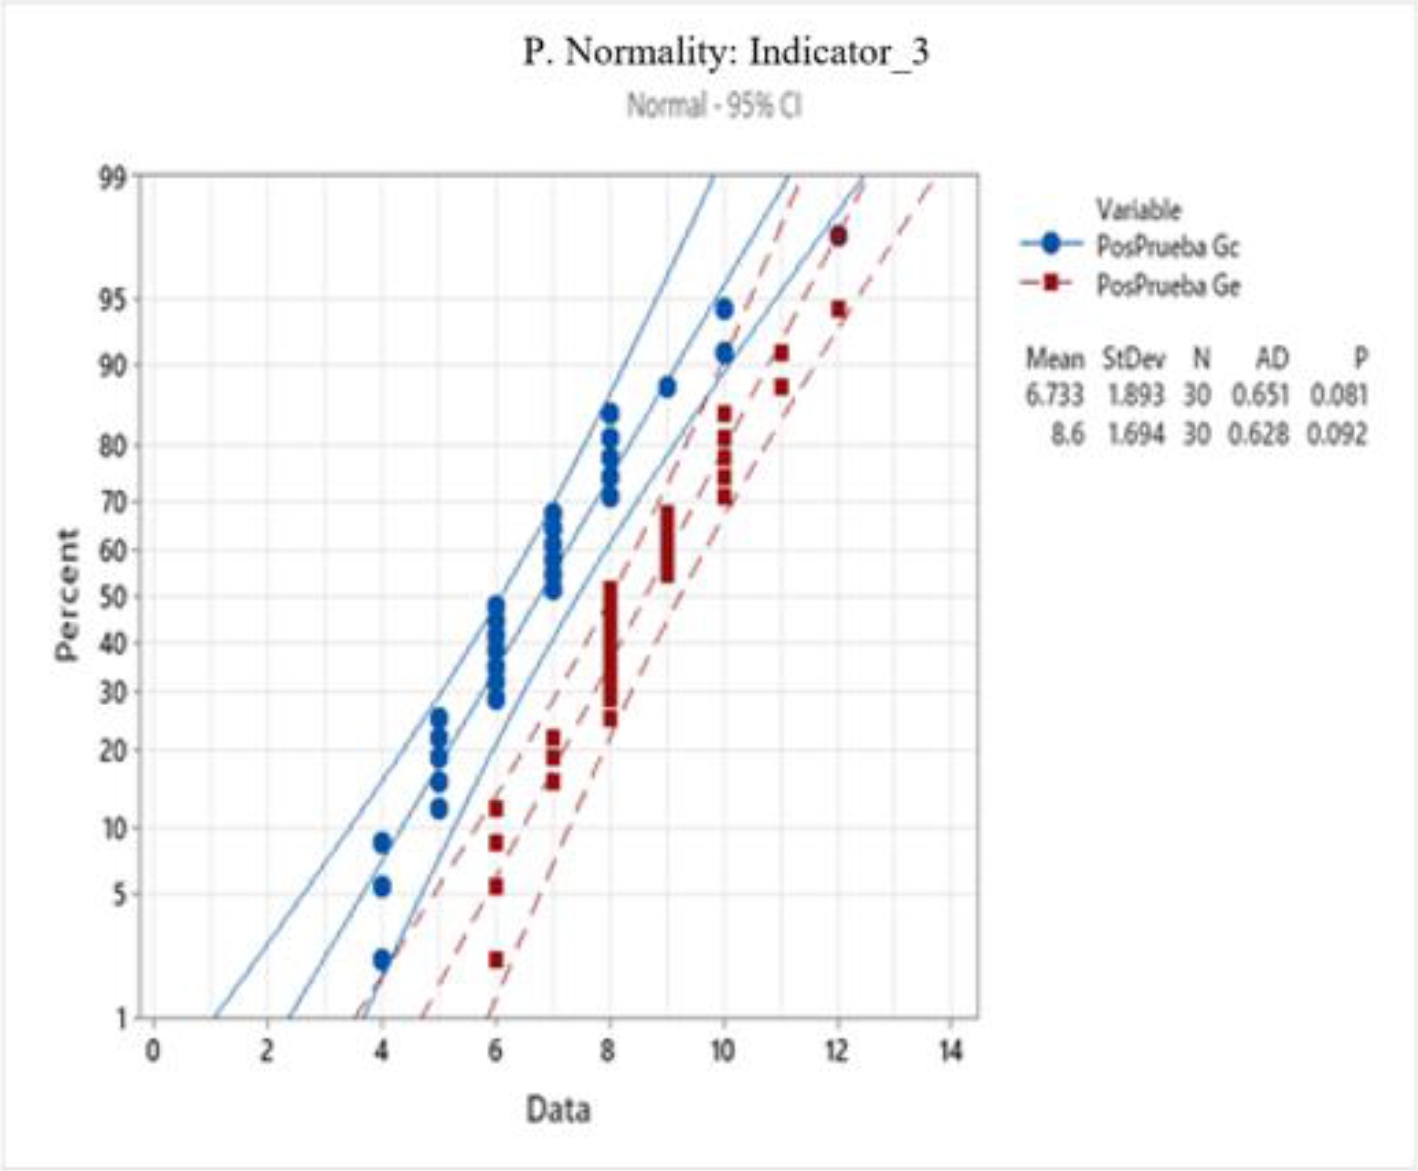
This section examines the application of the normality test to the data collected in the study. This statistical test is essential for assessing the data distribution and determining if it fits a normal distribution for each indicator. (See Figures 13 to 15).
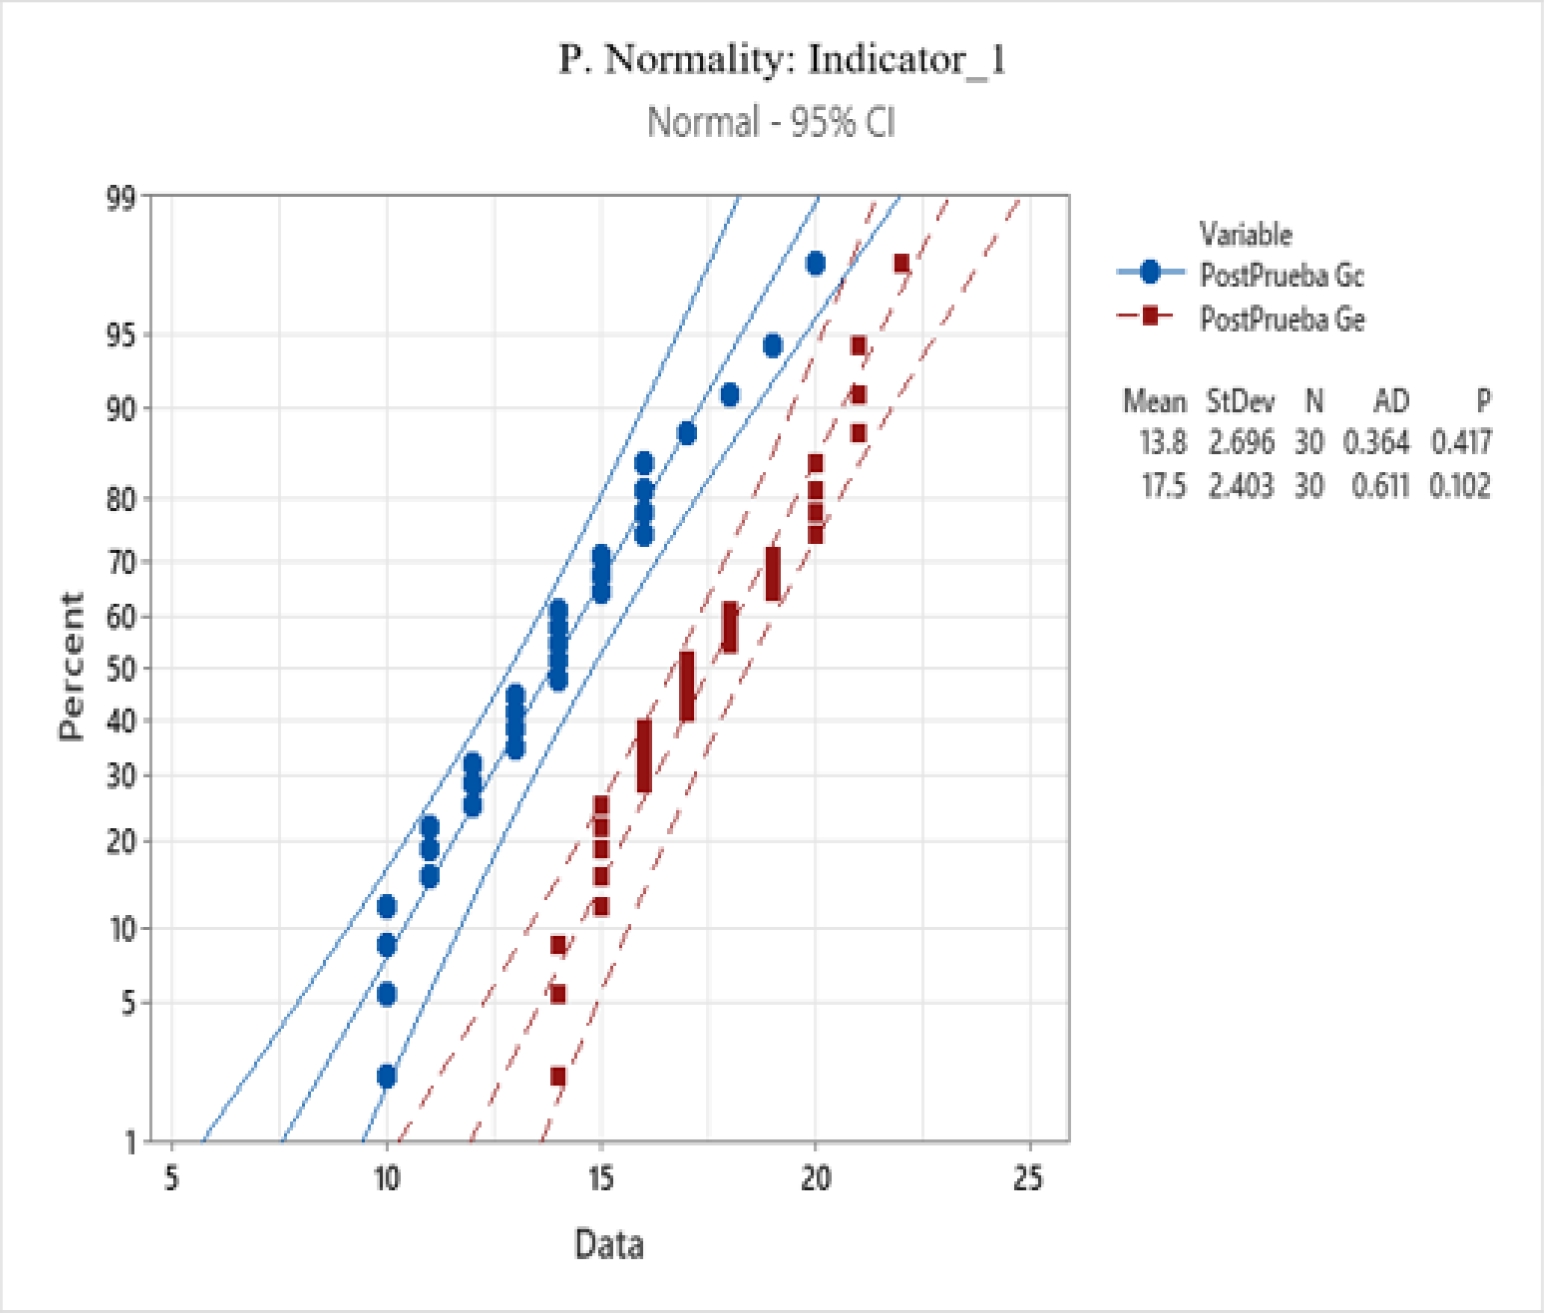
For I1: Number of Qualified Prospects.
For I2: Time for Presentation and Demonstration.
For I3: Number of Closed Sales.
In the case of indicators (I1, I2, I3), the analysis reveals a p-value that exceeds the predefined significance level (α = 0.05). The data satisfy the assumption of a normal distribution. Given this finding, we have decided to use the parametric Student's t-test to verify the hypothesis.
5.3 Discussion of Results
The discussion is carried out with a critical and honest behavior by the researchers, respecting the original results, without altering or distorting them.
2.3.1 With Descriptive Statistics
Provides a detailed analysis of the data collected in the study. It summarizes the main characteristics and trends of the variables studied, allowing for a clear and concise understanding of the information. (See Tables 6 and 7).
Anderson-Darling Normality Test results and the p-value are greater than α (0.05), confirming the normality of the data. Moreover, with a 95% confidence level, the mean and standard deviation values show normal results for each of the research indicators.
The summary of statistical analyses reveals that approximately 95% of the values for each indicator fall within 2 standard deviations of the mean. Kurtosis suggests tails with a lower density than a normal distribution, and the third quartile (Q3) indicates that 75% of the values are equal to or less than this cutoff point.
For Indicator 1: Number of Qualified Prospects of the Post-Test Ge group, are within 2 standard deviations of the mean (16.603 and 18.397); kurtosis indicates tails with less density than the normal distribution (-1.17839); the 3rd quartile 20, indicates that 75% of the values are less than or equal to this value, improving the results of the Post-Test Gc group, a similar result was obtained by the authors [16], who managed to increase the number of potential clients, demonstrated by the statistical T Student test, with a significance level of 5% and a confidence level of 95%, obtaining a result of 162 before the implementation of the mobile application and 248 after the implementation, which meant an increase of 86%.
According to the research [21], buyers have obtained more information about the housing construction project with the application, they can ask questions about the project or request interior design services. Therefore, it is more likely that buyers get an ideal home and are happy with their purchase.
The research provides information on the utility of using a mobile application in real estate sales management. This application optimizes internal processes and improves the qualification of prospects. Therefore, the development of a mobile application can be replicated in various management areas, improving job performance, streamlining tasks, and contributing to the improvement of management results.
For the I2 indicator: Time for Presentation and Demonstration, it is within two standard deviations of the mean (15.527 and 16.565); kurtosis indicates tails with less density than the normal distribution (-0.59446); the 3rd quartile 17.42, indicates that 75% of the values are less than or equal to this value; times are reduced from the Post-Test Gc group; in the study [21] the average number of daily visits (showroom) was 5.166 during the conventional purchase process and the average number of visits during the innovative purchase process (with the application) was 168,842.
The number of visits increases significantly when customers can interact with a seller through an app instead of traveling to a showroom. The results obtained demonstrate that the mobile solution can be applied in small and medium-sized companies of any economic sector; it will allow managers to make decisions to reduce the times of exposure and presentation of a product and improve their management indicators.
A reference framework is offered, in which a scientifically tested mobile application is developed, with an effect on the organization's results.
For the I3 indicator: Number of Closed Sales, the results obtained show that around 95% of the values are within two standard deviations of the mean (7.9675 and 9.2325); kurtosis indicates tails with less density than the normal distribution (-0.46892); the 3rd quartile 10, indicates that 75% of the values are less than or equal to this value; better results than the Post-Test Gc group.
There is an increase in this indicator with the mobile application, similar results were obtained, research [21] improved the average number of daily sales indicating that it increased from 3.91 to 19.94, which reflects a significant increase. Respondents also have a positive attitude indicating a standard deviation of 1.361 and mean standard of 1.108.
The authors in [16] managed to increase the level of service, demonstrated by the Wilcoxon statistical test with a significance level of 5% and a confidence level of 95% obtaining a result of 95.21% before the implementation of the multiplatform mobile application and 98.66% after implementation, which meant an increase of 3.45.
The findings of the research contribute to the analysis of the information of the sales activities of a real estate company, involved and interested in increasing its sales level and improving its processes through mobile technology. For this purpose, a framework is presented that substantially contributes to the knowledge that well-used digital technology affects the performance and staff and creates value for the company's product and/or service.
5.2.1 With Inferential Statistics
Table 8 shows the values from the application of statistical tests performed on each of the indicators for the hypothesis testing.
Table 8 Summary of hypothesis testing
| Sample | n | H0 | t-value | p-value |
| I1: PostTest(Gc) | 30 | µ1 ≥ µ2 | -5.61 | 0.000 |
| I1: PostTest(Ge) | ||||
| I2: PostTest(Gc) | 30 | µ1 ≤ µ2 | 14.64 | 0.000 |
| I2: PostTest(Ge) | ||||
| I3: PostTest(Gc) | 30 | µ1 ≥ µ2 | -4.03 | 0.000 |
| I3: PostTest(Ge) |
The results of the parametric tests for the 3 proposed hypotheses indicate a p-value less than α (0.05) in each case, which provides sufficient statistical evidence to reject the null hypotheses Ho, making the alternative hypotheses true. The tests are significant. It is important to mention the scarcity of other case studies in companies of this sector, a situation that has limited the comparison of the Hypothesis Testing data Ho for each indicator, with other companies.
The study's results will provide information for the real estate sector involved in improving their sales management indicators. The results obtained provide enough statistical evidence to reject the Null Hypothesis (H0), and the Alternative Hypothesis (Ha) is true for each indicator. The tests turned out to be significant for each of the proposed indicators.
6 Conclusions and Future Research
In the study conducted to improve the process of Sales Management of Apartments in real estate; by integrating with the construct of the Aswan metamodel using foundations from the agile methodologies Scrum, RUP, and XP. The product developed is a technological innovation in the real estate sector; there is no application that measures internal management process indicators.
The results obtained with the Case Study demonstrated that the Aswan Methodology allows the development of a mobile application and improves management indicators; the record of the Presentation and Demonstration Time (I2) using the application was 17.42 minutes, a reduction of 35% compared to the record of 27 minutes without the application, these results had an effect on the number of closed sales (I3) that recorded 10 apartments using the solution, showing an increase of 2 apartments compared to the record of 8 without the solution. Therefore, with these results, it is possible to optimize times and improve sales with the consequent benefits to the involved parties.
The study conducted can be extended in the field of knowledge management, innovation, and software development by adding new AI technologies; the use of the Aswan metamodel is suggested in suitable environments and economic sectors seeking to have a competitive advantage and seek to add value to their products and internal processes.

