


 nueva página del texto (beta)
 Inglés (pdf)
 Artículo en XML
 Referencias del artículo
 Enviar artículo por email
 Citado por SciELO
  Similares en
SciELO
Similares en
SciELO 
 Permalink
1 Introduction
Early detection of diseases has been of utmost importance in recent years, due to the different benefits that can impact society, such as increasing the chances of survival in patients suffering from potentially fatal diseases [1]. Currently, the research carried out in the pre-diagnosis of diseases is notably relevant, specifically with great interest in minimizing errors in the early detection of lung diseases; this, due to the different benefits, such as increasing survival in patients, achieving a better recovery thanks to detection in a premature phase of the disease, implementing better clinical management of the patient, adopting public health and controlling possible outbreaks [1].
Recently, machine learning techniques applied to the field of medicine have become an increasingly important area of research at a global level, promoting the frequent emergence in the literature of works related to the development of novel and advanced models specialized in the pre-diagnosis of diseases, which makes it an active research topic [1].
A very important aspect related to medical pre-diagnosis of diseases is that most datasets related to this type of problems are imbalanced, which is not favorable to the pre-diagnosis of diseases using machine learning algorithms [2]. According to the National Cancer Institute of the US National Institutes of Health [3] respiratory diseases or lung diseases are pathological conditions that affect the lungs and other parts of the respiratory system.
There are two types of respiratory diseases [4]: infectious and chronic, which range from mild symptoms, such as the common cold, flu and pharyngitis, to life-threatening diseases such as pneumonia, pulmonary embolism, tuberculosis, asthma, lung cancer, pulmonary fibrosis, chronic obstructive pulmonary disease (COPD) and severe acute respiratory syndromes, such as COVID-19 disease [5].
According to the Forum of International Respiratory Societies (FIRS) and data from the World Health Organization (WHO), respiratory diseases are among the most important causes of death and disability worldwide [4, 6]. in 2019, respiratory diseases were three of the top ten causes of death, causing more than 8 million deaths annually [6]. COVID-19 pandemic that began in 2020 has affected around 400 million people until 2022, claiming the lives of more than 6 million people worldwide [7], and in Mexico has left more than 320 thousand dead in a period of two years [7], making it the main cause of death nationwide during the first half of the year. of the year 2021 [8].
On the other hand, the diagnosis of respiratory diseases is usually made using different methods, both invasive and non-invasive; for example, one of the most common is through computer-aided diagnosis (CAD). Some of the most frequent techniques used within CAD to diagnose respiratory diseases are: chest x-ray, computed tomography and magnetic resonance [9].
The diagnostic methods presented in the literature have disadvantages and limitations, such as: special equipment, highly trained personnel, financing, and specialized studies, causing negative results when implementing these techniques in the diagnosis of diseases. Therefore, it is necessary to continue researching new methods or technologies that help make a better early diagnosis [10].
This is why machine learning techniques applied to medicine have become an increasingly important area of research around the world, as well as the application and development of novel models for the pre-diagnosis of diseases, which is a relevant research field [2, 11, 10].
On the other hand, the No Free Lunch theorem [12] proves and establishes that there is no classifier that is the best on any kind of dataset.
Given that associative models have been shown to be effective and efficient in achieving this minimization of errors, in the present research work a novel specialized classification machine learning model is proposed for the pre-diagnosis of respiratory diseases, called Subtractive Threshold Associative Classifier (STAC). The experimental tests carried out with the STAC allow us to verify that the new model is competitive in the state of the art.
The paper is organized in the following manner. Section 2 presents the related works, where a brief description of the different works published related to pre-diagnosis of respiratory diseases using machine learning is given. On the other hand, section 3 presents a brief description of the different datasets and algorithms used. In the section 4 some materials and methods are presented, highlighting the theoretical concepts that will support this work.
Likewise, the proposal of this work is addressed in section 5, and section 6 shows the results achieved from the experimental phase to evaluate the viability of the new model; Finally, conclusions and proposals for future work are presented in section 7.
2 Related Works
Recently, the researches focused on the pre-diagnosis of respiratory diseases has gained momentum worldwide, with broad interest in improving the early detection of respiratory diseases. Currently, to make this type of diagnosis in respiratory diseases, different methods are applied, both invasive and non-invasive. Some of the most common methods are computer-aided diagnosis (CAD), pulmonary function tests (such as spirometry, lung volume, gas diffusion, and bronchoscopy), microbiological diagnoses, and molecular biology-based diagnoses [10, 13].
Within the state of the art, several works have addressed the topic of pre-diagnosis of respiratory diseases applying Machine Learning techniques.
Maleki et al. [14] addressed the pre-diagnosis of lung cancer, one of the most common diseases among humans worldwide. For the classification task, the authors use general data referring to patients suffering from lung cancer. The dataset under consideration for the study of this research is made up of 100 patterns with 23 features, which describe information about the patients. Finally, in the classification process, in this case used to diagnose lung cancer, the kNN algorithm is applied, which the model reaches an accuracy equal to 1.
On the other hand, Spathis et al. [15] studied the prevention, diagnosis and early detection of respiratory diseases, such as asthma and chronic obstructive pulmonary disease (COPD). The authors carried out a comparative study applying different algorithms, such as: Naïve Bayes, logistic regression, multilayer perceptron neural networks (MLP), support vector machines (SVM), near neighbors (kNN), decision trees, and Random Forest. As a result of the comparative analysis, it was observed that the best classification algorithm for diagnosing asthma and COPD is the random forest algorithm, which obtained the highest accuracy values.
In the work presented by Cardoso et al. [16] proposed a new methodology to diagnose interstitial lung disease (ILD) obtained better results in diagnosis over the related works of this art. The authors applied feature extraction techniques to reduce dimensionality, such as Principal Component Analysis (PCA) and linear discriminant analysis applying models as SVM, kNN, and feedforward deep neural network, which reached the best performances.
Finkelstein et al. [17] used three machine learning algorithms (Naïve Bayes, adaptive Bayesian network, and support vector machines) to perform a comparative analysis on the early detection of exacerbations in adult patients with asthma. The models reached excellent performance at the metrics sensitivity and specificity.
Amaral et al. [18] developed a medical decision support system to simplify clinical use as well as improve the diagnosis of airway obstruction in patients suffering from asthma. The comparative study used the principal component analysis (PCA) technique to try to improve classification performance.
However, based on the results obtained, it was concluded that the use of dimensionality reduction does not significantly benefit the performance of the algorithms in this particular case. It is shown that the best algorithm to diagnose airway obstruction in patients with asthma is the kNN algorithm with a value of k=1 and the AdaBoost classifier, which allow sick patients to be classified with outstanding performance.
With the aim of increasing the survival rate in patients suffering from lung cancer, Radhika et al. [19] propose to diagnose lung cancer early in affected patients using: Naïve Bayes, Support Vector Machines (SVM) and logistic regression.
In another trend, novel machine learning techniques have recently emerged, which work adequately using images as input information, easily outperforming other algorithms in this type of tasks [20]. These techniques are called deep learning (Deep Learning) or convolutional neural networks (CNN).
For example, Xiong et al. [21] proposed a specialized CNN model to recognize Mycobacterium tuberculosis using tissue samples treated with acid-fast staining, where after the experiments carried out, the new proposed CNN model achieved sensitivity values of 97.94% and specificity of 83.65%.
Another example under the same group of algorithms is Christe et al. [22] presenting a study to evaluate the performance of a new computer-aided diagnosis system based on a convolutional neural network (CNN) for automatic classification of high-resolution computed tomography images into four radiological diagnostic categories. Likewise, there are related works where techniques related to deep learning are applied to pre-diagnose patients suffering from respiratory diseases of COVID-19 or pneumonia [11].
Finally, within the related literature there are works where pulmonary acoustic signals from patients' thoracic ultrasound have been used, in order to make diagnoses of diseases linked to the chest, such as pleural effusion, atelectasis, pneumothorax and pneumonia [23]. For example, Pham et al. [24] make use of convolutional neural networks to detect respiratory diseases from recordings of respiratory sounds, using traditional machine learning models, such as Support Vector Machines (SVM) and Nearest Neighbors (kNN) algorithms.
3 Datasets and Algorithms
In this section, a brief description of the pattern classification algorithm applied in the present work and the used datasets related to respiratory pre-diagnosis diseases are presented.
3.1 Datasets Related to Respiratory Diseases
For this work, 12 datasets were selected in three different repositories, the Knowledge Extraction base on Evolutionary Learning (KEEL) repository [25] located at https://sci2s.ugr.es/keel/datasets. php, the Machine Learning Repository from the University of California at Irvine (UCI) [26] located at https://archive.ics.uci.edu/ml/index.php, and finally, the Kaggle repository located at https:// www.kaggle.com/datasets. Of the 12, 10 datasets have an imbalance ratio (IR) greater than 1.5, which means have an imbalanced complexity. The IR ratio is calculated as the expression 1.
Detailed information about each of the selected datasets is shown in Table 1:
Table 1 Description of the selected datasets
| Datasets | Features | Patterns | IR | Classes | |
| Categorical | Numerical | ||||
| Post-operative | 8 | 0 | 90 | 32.00 | 3 |
| Thyroid | 0 | 21 | 7200 | 40.10 | 3 |
| Newt-thyroid1 | 5 | 0 | 215 | 5.14 | 2 |
| Newt-thyroid2 | 5 | 0 | 215 | 5.14 | 2 |
| Thoracic-Surgery | 13 | 3 | 470 | 5.70 | 2 |
| Lung-Cancer | 0 | 52 | 32 | 1.40 | 3 |
| Survey Lung-Cancer | 14 | 1 | 309 | 6.90 | 2 |
| ACPs Lung Cancer | 38 | 0 | 901 | 31.25 | 4 |
| Exasens | 0 | 7 | 80 | 1.00 | 2 |
| Lymphography | 3 | 15 | 148 | 40.50 | 4 |
| Lymphography-NF | 3 | 15 | 148 | 23.60 | 2 |
| Primary-tumor | 16 | 1 | 336 | 42.00 | 18 |
On the other hand, the 12 datasets mentioned above were selected because they include information on the most common respiratory diseases [5], such as pneumonia, pulmonary embolism, tuberculosis, asthma, lung cancer, pulmonary fibrosis, chronic obstructive pulmonary disease. (COPD) and severe acute respiratory syndromes.
Post-operative: This dataset comes from a study to determine where a patient should be sent after post-operative recovery, because hypothermia is a major risk post-surgery.
Thyroid: The task of classifying this dataset is to determine whether a given patient is healthy (normal) or suffers from hypothyroidism or hyperthyroidism.
Newt-thyroid1 and Newt-thyroid2: Both datasets represent an imbalanced version of the original Thyroid dataset. In the Newt-thyoid1 set, the positive class belongs to the hyperthyroidism class, and the patterns of the negative class are made up of the patterns of the rest of the classes.
Thoracic-Surgery: This dataset represents patients who underwent major lung resections for primary lung cancer between 2007 and 2009 at the Thoracic Surgery Center in Wroclaw.
Lung-Cancer: This dataset describes three types of pathological lung cancers. The objective of the data set is to classify these three types of cancers.
Survey Lung-Cancer: The classification task of this dataset is to detect whether or not a given patient suffers from lung cancer, based on different variables collected from a survey.
ACPs Lung Cancer: This dataset represents information on peptides (amino acid code) and anticancer activity in lung cancer cell lines.
Exasens-COPD: This dataset aims (based on demographic information from saliva) to classify patients into four classes according to their membership: chronic obstructive pulmonary disease, COPD or COPD, asthma, respiratory infections and completely healthy patients.
Lymphography: The classification task of this dataset is to detect the presence of lymphomas in addition to their current status.
Lymphography-NF: This dataset is a two-class only version from the KEEL repository of the original Lymphography dataset. In this set, the positive class is made up of the “normal” and “fibrosis” classes while the negative class is made up of the rest of the classes.
Primary-tumor: This dataset aims to classify patients within 21 different classes, according to the type of tumor they suffer from.
3.2 Classification Algorithms
This section describes the pattern classification algorithms proposed to carry out the comparative study against the novel model presented in this work, which are applied to the datasets described in section 3.1. The algorithms presented below were selected because they comprise the most relevant models in the results table within the state of the art on topics related to pattern classification, as can be seen in [27, 28, 29].
Naîve Bayes [30] is a type of algorithm that belongs to probability-based classifiers. This classification algorithm is based on Bayes' Theorem, specifically considering all independent attributes from a probabilistic approach.
Another classifier used was the kNN or K-nearest neighbor algorithm [14], specifically the 1NN and 3NN models. In WEKA, the classifier algorithm is called Instance-Based (IBk).
Multilayer perceptron (MLP) [31] is a well-known classification algorithm within the literature on topics related to Machine Learning. MLP is a network composed of artificial neurons (also called units) interconnected with each other, forming three different types of layers, which are: the input layer, the hidden layer and finally the output layer (output layer).
Sequential minimal optimization (SMO) [32] is one of the most important and widely used optimization algorithms for support vector machines (SVM) within the state of the art when comparing classifiers. This classifier uses the sequential minimal optimization algorithm created by John Platt to train support vector machines using kernel functions based on linear, polynomial, radial basis or sigmoid functions.
And finally, the classifier C4.5 [33] is a decision tree, which is an extension of the ID3 algorithm. This type of classifier is highly recognized within the state of the art because it is explainable, it is based on information theory and its hierarchical structure allows us to see how the patterns of a data set are classified.
These algorithms were executed in the WEKA software in version 3.8, using the default parameters offered by the software.
4 Associative Memories
This section includes fundamental concepts of two pioneering models of associative memories, Steinbuch's Lernmatrix [34] and Willshaw's Correlograph [34], due to these models are the basis for the proposed model presented in section 5.
An associative memory
There are two types of associative memories. Autoassociative memory, which meets the following conditions:
Associative memories are made up of two essential phases [15].
Learning phase. It consists of creating the associative memory (matrix) M that manages to store the p associations of the fundamental set.
Recovery phase. It consists of operating the associative memory (matrix) M with the objective of finding the sufficient conditions to obtain the fundamental output pattern
4.1 Steinbuch’s Lernmatrix
The Steinbuch Lernmatrix is a heteroassociative memory, which can function equally as a binary pattern classification algorithm if the output patterns corresponding to each input pattern are correctly chosen.
4.1.1 Learning Phase
The learning phase consists of finding a way to generate a matrix
Each of the components
Each component
where each
4.1.2 Recovery Phase
The recovery or classification phase if used as a classifier consists of multiplying the previously trained memory
To carry out the recovery phase, it is necessary to calculate the
4.2 Willshaw’s Correlograph
The Willshaw’s correlograph is an optical device, which can function as an associative memory. This associative memory works in the following way.
4.2.1 Learning Phase
The Correlograph learning phase is made up of two steps [35].
The associative memory (matrix)
It is subsequently updated according to the following expression:
4.2.2 Recovery Phase
The retrieval phase consists of presenting the previously trained associative memory
Likewise,
5 Proposed Algorithm
The proposed novel pattern classification algorithm, named Subtractive threshold associative classifier (STAC), belongs to the associative approach to pattern classification. Our proposed model is mainly based on the two pioneering associative memories, the Lernmatrix, which was created by Steinbuch, and the Correlograph, created by Willshaw.
In order for out proposed model to be able to deal with missing values and mixed data a preprocessing is applied to the dataset to resolve this complexity in the data. On the other hand, the novel STAC algorithm makes use of an encoder, to convert real values to binary strings, as well as a mathematical transform.
The Johnson-Möbius method [36] and the
Finally, to build the binary chain, the maximum number of the set is taken as a reference to define the length of the binary chain, where each real number is represented with as many ones as its value indicates, preceded by a string of zeros until the length is complete. defined.
On the other hand, the new STAC algorithm applies a process to transform the previously converted binary strings (using the Johnson-Möbius binary string encoder). This transformation uses a simple but powerful mathematical transform, called by the authors, the
The STAC algorithm consists of two phases, a learning phase and a retrieval (or classification) phase.
5.1 Learning Phase of STAC
All input patterns are converted to binary values using the Johnson-Möbius code.
A
A one-hot output pattern is associated with each input pattern transformed in step 2.
The learning phase of the original Lernmatrix is performed in order to obtain the M matrix.
5.2 Classification Phase of STAC
The unknown input pattern
The
A value of
where, n is equal to the dimension of input patterns.
4. Using the
6 Experimental Results and Discussion
This section reports experimental results using the proposal classifier STAC against the most relevant classifiers of state of art. On the other hands, section 6.1 describes the validation method and performance metrics.
Finally, section 6.2 presents classification results obtained by the algorithms.
6.1 Validation Method
In this section, we describe the validation method used in the experimental stage.
In order to obtain reliable results when measuring the performance of the classifiers in the experimentation stage, previously it is necessary to have implemented a validation method, which divides the original dataset into two sets: a test set and a learning set.
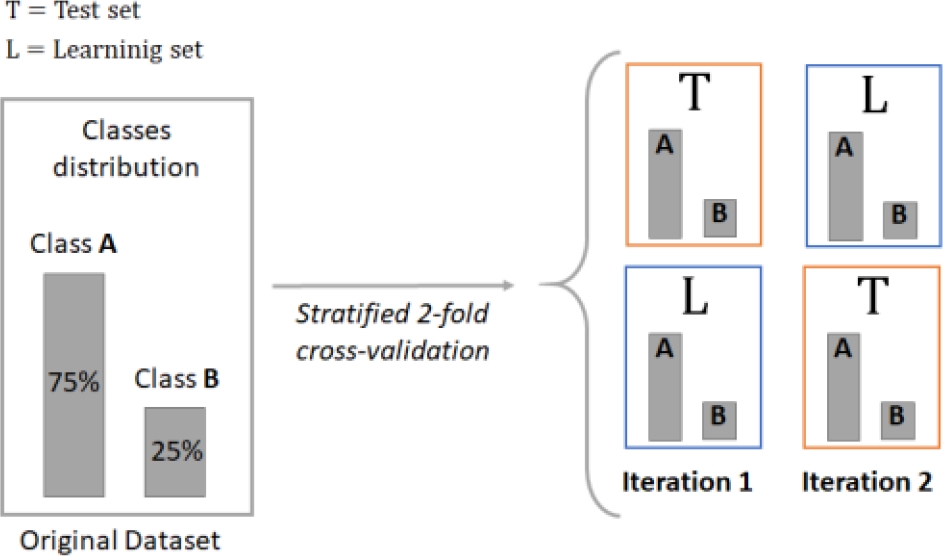
There are many ways to define these datasets, the most used and recommended by various authors is the k-fold cross-validation method [38]. However, because the datasets selected in the present research work mostly present class imbalance, it was decided to use the stratified 5x2 fold cross-validation (5x2 scv) method [26, 38], the which is widely recommended for imbalanced datasets, since they retain approximately the same percentage of patterns of each class for each of the folds.
In order to properly compare the classifiers executed in the experimental stage, it was necessary to apply a performance measure. Since the selected datasets present class imbalance, the Balanced Accuracy (BA) performance measure was used. This metric is recommended for imbalanced datasets by reason of it decreases the bias between the minority and majority class, thus obtaining results that reflect the true capacity of the classifiers [39].
The Balanced Accuracy metric for k classes is calculated as follows:
where, Ti represents the number of correctly classified patterns of each class i, and Ni represents the total number of patterns belonging to each class i.
6.2 Classification Results
Within the experimental phase that will be detailed below, two comparative experiments were carried out. The first shows the results obtained by the classifiers reported within the state of the art and the proposed STAC algorithm, which can be seen in Table 2, as well as the statistical results of these in Table 3 and Table 4.
Table 2 Results obtained by state-of-the-art classifiers according to the BA measure
| Dataset | Naïve Bayes | 3-NN | MLP | SMV | C4.5 | STAC |
| PostOperative | 0.321 | 0.311 | 0.295 | 0.328 | 0.327 | 0.352 |
| Thyroid | 0.726 | 0.548 | 0.784 | 0.496 | 0.983 | 0.724 |
| Newt-thyroid1 | 0.988 | 0.913 | 0.965 | 0.745 | 0.926 | 0.960 |
| Newt-thyroid2 | 0.989 | 0.909 | 0.966 | 0.757 | 0.904 | 0.969 |
| Thoracic-Surgery | 0.578 | 0.508 | 0.523 | 0.500 | 0.511 | 0.508 |
| Lung-Cancer | 0.569 | 0.513 | 0.513 | 0.506 | 0.492 | 0.594 |
| Survey Lung-Cancer | 0.716 | 0.711 | 0.779 | 0.774 | 0.666 | 0.761 |
| ACPs Lung Cancer | 0.634 | 0.610 | 0.635 | 0.681 | 0.250 | 0.949 |
| Exasens COPD | 0.875 | 0.852 | 0.885 | 0.820 | 0.910 | 0.902 |
| Lymphography | 0.578 | 0.434 | 0.491 | 0.641 | 0.582 | 0.867 |
| Lymphography-NF | 0.747 | 0.498 | 0.793 | 0.698 | 0.598 | 0.965 |
| Primary-tumor | 0.271 | 0.230 | 0.234 | 0.252 | 0.233 | 0.340 |
| Best BA | 3 | 0 | 1 | 0 | 2 | 6 |
Table 3 Friedman test results
| Algorithm | Ranking1 |
| STAC | 2.0417 |
| Naïve Bayes | 2.7500 |
| MLP | 3.0417 |
| C4.5 | 4.0000 |
| SMV | 4.1667 |
| 3-NN | 5.0000 |
1ordered from best to worst
Table 4 Post-hoc comparison obtained by the Holm test
The second experiment, shows the results obtained by the associative classifiers used as the basis for the STAC algorithm (Lernmatrix, Correlograph, and LM(
It can be seen from Table 2 that the proposed STAC algorithm achieved high performance, obtaining the best BA value on six of the twelve datasets used. As for example in the data sets: PostOperative, Lung-Cancer, ACPs Lung Cancer, Lymphography, Lymphography-NF and Primary-tumor.
In favor of our proposal, it can be noted that, in most cases, the performance values achieved by the proposed STAC classifier are close to the highest performances obtained by the other classifiers, such is the case of the set of Survey Lung-Cancer data, where the STAC algorithm obtained a result of 0.761, which is not so far from the best performance, with a value of 0.779 achieved by the MLP classifier.
Other similar cases occur in the Newt-thyroid1, Newt-thyroid2 and Exasens dataset, where the proposed model resulted in performance values equal to 0.960, 0.969 and 0.902, respectively, very similar to the best performances obtained by the other classifiers.
To carry out a comparative analysis with greater reliability in the results, the Friedman test [7] was used, to demonstrate the existence of significant differences in the observed performances.
The proposed STAC model is placed at the first place in the ranking, with a value of 2.0417, with respect to the remaining 5 algorithms, making it the best model for the classification task described in this research work.
After performing the Friedman test, the null hypothesis is rejected with a confidence value of 95% and a probability value of p = 0.001231, which is largely below the level of significance established for this research, the which is 𝛼 = 0.05. Therefore, the existence of significant differences between the different classification algorithms is demonstrated.
Due to the results of the Friedman test, a post-hoc test was applied, the Holm test [8], the results of which can be seen in Table 3.
The test rejects the hypothesis with a value adjusted less than or equal to 0.05.
Therefore, it is observed that there are significant differences between the performances obtained by the proposed STAC algorithm and the classifiers: 3NN, SVM and C4.5.
After carrying out the experiments described in this section, it is observed that the proposed STAC model stood out with excellent results; because it significantly outperforms the other algorithms used in the state of the art under the same classification task.
In the second experiment, carried out with associative classification algorithms, of which the proposed STAC algorithm is based. Table 5 shows how the new proposed STAC algorithm clearly outperforms the other associative classifiers. Managing to obtain the best result in 10 of the 12 data sets used. To carry out a comparative analysis with greater reliability in the results, the Friedman test [39] was used, to demonstrate the existence of significant differences in the observed performances.
Table 5 Results obtained by the associative classifiers
| Dataset | CG | LM | LM( |
STAC |
| PostOperative | 0.200 | 0.318 | 0.255 | 0.352 |
| Thyroid | 0.000 | 0.297 | 0.625 | 0.724 |
| Newt-thyroid1 | 0.500 | 0.629 | 0.927 | 0.960 |
| Newt-thyroid2 | 0.500 | 0.624 | 0.961 | 0.969 |
| Thoracic-Surgery | 0.500 | 0.532 | 0.517 | 0.508 |
| Lung-Cancer | 0.333 | 0.386 | 0.553 | 0.594 |
| Survey Lung-Cancer | 0.500 | 0.816 | 0.674 | 0.761 |
| ACPs Lung Cancer | 0.250 | 0.856 | 0.941 | 0.949 |
| Exasens-COPD | 0.500 | 0.601 | 0.874 | 0.902 |
| Lymphography | 0.250 | 0.582 | 0.735 | 0.867 |
| Lymphography-NF | 0.500 | 0.79 | 0.814 | 0.965 |
| Primary-tumor | 0.047 | 0.055 | 0.282 | 0.340 |
| Best BA | 0 | 2 | 0 | 10 |
Table 6 shows the ranking obtained by the Friedman test according to the different associative classification algorithms presented. The proposed STAC model is placed at the first place in the ranking, with a value of 1.25, making it the best model for the classification task described in this present document.
Table 6 Friedman test with the associative classifiers
| Algorithm | Ranking |
| STAC | 1.2500 |
| LM( |
2.1667 |
| Lernmatrix | 2.5833 |
| Correlograph | 4.0000 |
Table 7 post-hoc by the Holm test on associative classifiers
| i | Algo | z | p | Holm |
| 3 | CG | 5.217 | 0.000 | 0.016 |
| 2 | LM | 2.529 | 0.011 | 0.025 |
| 1 | LM( |
1.739 | 0.081 | 0.050 |
After performing the Friedman test, the null hypothesis is rejected with a confidence value of 95% and a probability value of p = 0.000003, which is largely below the level of significance established for this research, the which is 𝛼 = 0.05. Therefore, the existence of significant differences between the different associative classifiers is demonstrated.
After performing the experiments described using the associative classifiers, it is observed that the proposed STAC algorithm stood out with competitive results; due to the significant differences between the performances obtained by the algorithm, obtained in two of the three associative classifiers used as a basis for the proposed STAC algorithm, under the same classification task.
Therefore, the results obtained support the statement that the proposal of the novel STAC model is suitable for the pre-diagnosis of the most common respiratory diseases.
7 Conclusion and Future Work
In the present work, a novel associative algorithm for pattern classification, STAC (Subtractive Threshold Associative Classifier) designed for the pre-diagnosis of respiratory diseases, was proposed and presented.
Likewise, another advantage of the STAC classifier is that it is an explainable model; making it transparent in its classification process, understanding why a pattern is classified to a certain class.
The experimental results carried out in section 6 point out the outstanding capacity of the proposed STAC algorithm, because they surpass several of the most used classification algorithms in the state of the art regarding the pre-diagnosis of respiratory diseases; excelling in exactly 6 of the 12 datasets used in the experimental phase.
Furthermore, according to the Friedman test, the best classifier in the experiments carried out was the STAC algorithm, indicating the presence of significant differences, with a probability value of p = 0.001230; Likewise, the post-hoc Holm test reflects that there is also the presence of significant differences in the performance obtained by the proposed algorithm and the other classifiers.
In future work, the intention will be to apply the novel STAC algorithm on datasets with different approaches, with the aim of evaluating its performance and behavior in different diseases or even non-medical datasets; likewise, it is proposed to compare the STAC algorithm with more state-of-the-art classifiers.
Finally, it is planned to prove why the proposed threshold works properly, and considerably improves the performance of the algorithm STAC. With this, it is proposed to consider some more in-depth analysis on the behavior of the model when using different threshold and the one proposed in this work.

