


 nueva página del texto (beta)
 Inglés (pdf)
 Artículo en XML
 Referencias del artículo
 Enviar artículo por email
 Citado por SciELO
  Similares en
SciELO
Similares en
SciELO 
 Permalink
1. Introduction
The organic matter contained in the sediments and sedimentary rocks has traditionally been characterized by carrying out a systematic extraction procedure, using organicsolvents (both polar and non-polar). This results in two fractions, one extractable (bitumen) and one insoluble which is also known as kerogen (Oehler and Cady, 2014). Although kerogen is the most abundant type of organic matter in sediments (Oehler and Cady, 2014), only the extractable fraction can be further characterized by analytical techniques, such as chromatography and mass spectrometry.
After lithification, migration can also enrich organic matter, which is typically an assemblage of the remnants of organisms (Oehler and Cady, 2014). The study of the different kinds of molecules (molecular diversity) is fundamental for disentangling the processes that produce and change organic matter in sediments. This gives us important details about the environment and the conditions of deposition and, in the case of sediments prone to oil generation, information about the nature of oil.
The main objective of this research is to put together the data obtained from traditional analysis with data derived from pyrolysis analysis, to interpret the origin of organic matter. Thus, the particular objectives of this study are twofold: (1) contributing to the understanding of the deposition environment in an oil prone zone, and (2) to test the use of a complementary methodological path (evaluation of organic matter by pyrolysis) to understand the geological processes involved.
Pyrolysis is, in general, the thermal degradation or organics, under an inert environment (Alemán et al., 2007); and has been employed for rapid analyses of sedimentary organic matter (Larter and Douglas, 1982). On the other hand, Pyrolysis Gas Chromatography Mass Spectrometry (Pyr-GC-MS) is an analytical technique used to characterize both extractable and insoluble organic matter without a previous extraction or purification steps. In here, we attempt to explore the nature of organic matter in sedimentary rocks, from Pimienta Formation, related to the generation and trapping of oil by means of Pyr-GC-MS. We put forth this method as a rapid and versatile way to determine the identity of sedimentary organic matter. This technique, combined with traditional methods has the potential to highly contribute to the high-resolution determination of sedimentary environments.
2. Study section and geological setting
The Ameca section corresponds to an outcrop along the northern margin of the Amajac River, in the boundary between the Hidalgo and San Luis Potosí States (central-eastern Mexico). It is located about 1.2 km north of the La Pimienta Village (Figure 1). The section exposes a 60 m thick interval that embraces organic-rich sediments in the upper part of the Pimienta Formation and the lowermost part of the Lower Tamaulipas Formation. Lithologic and age control of this site have been provided by previous studies (Martínez-Yáñez et al., 2023, Omaña and Núñez-Useche, 2024). The immature to early mature state of the organic matter that it contains make the Ameca section ideal for the present type of study.
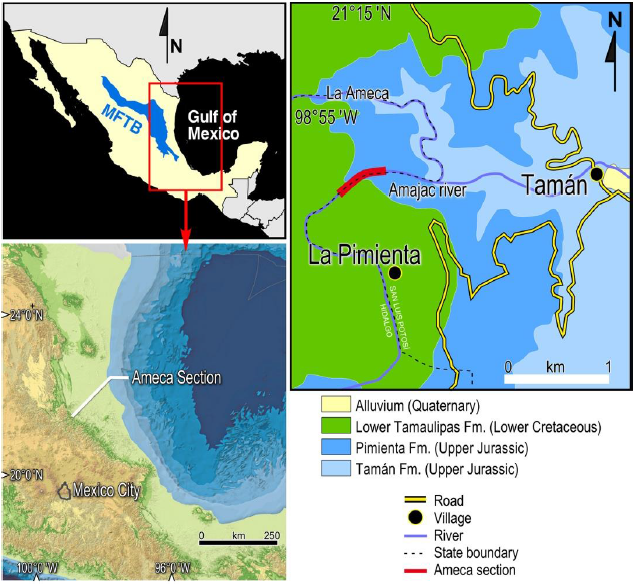
Figure 1 Location of the study area (Ameca Section) in Central Mexico. Adapted from Martínez-Yáñez et al. 2023. Key: MFTB = Mexican Fold and Thrust Belt.
The studied outcrop is in a region that belongs to the eastern portion of the Huayacocotla sector of the tectonic front of the Sierra Madre Oriental. This sector is mainly composed of sedimentary rocks of the Jurassic and Cretaceous Tampico Misantla Basin (TMB), which experienced uplift during the Mexican orogeny between the Late Cretaceous and the Paleogene.
The TMB is the richest hydrocarbon basin in the country (Cruz and Meneses, 1998; Guzmán-Vega et al., 2001; Magoon et al., 2001). It is considered a super basin due to the total amount of oil produced, the estimated reserves, and the number or petroleum systems that it bears (Guzmán, 2022). The estimated oil and wet gas potential for the TMB is 17.8 billion barrels and 13.1 trillion cubic feet, respectively (CNH, 2021 in Martínez-Yáñez et al. 2023). This basin developed as a rift-related trough that opened as result of the divergence between North and South America, during the onset of the opening of the Gulf of Mexico by Late Triassic-Early Jurassic (Pedrazzini and Basañez-Loyola, 1978; Ochoa-Camarillo et al., 1998; Pindell and Kennan, 2009; Martini and Ortega-Gutiérrez, 2018). Continental to shallow-marine deposits were accumulated in the basin during the Early and Middle Jurassic rift stage. These rocks are overlain by deep-marine shales and pelagic carbonates that were deposited from the Oxfordian to Turonian, favoured by the decelerating tectonic subsidence and crustal cooling of the drift and cooling stage (Hermoso de la Torre and Martínez-Pérez, 1972; Pedrazzini and Basañez-Loyola, 1978; CNH, 2014). These latter include the organic-rich shale calcareous shale and limestone of the Pimienta Formation, which were formed by the advance of the Late Jurassic marine transgression (PEMEX, 2013). Guzmán-Vega et al. (2001) and Jarvie and Maende (2016) acknowledge this unit as the largest oil reservoir in the TMB and as an unconventional oil resource. The organic-richest sediments are at the lower part of the Pimienta Formation, and the organic matter content progressively decrease towards the top of the unit (Martínez-Yáñez et al., 2017; Abascal-Hernández et al., 2018; Martínez-Yáñez et al., 2023). The Pimienta Formation is conformably overlain by the organic-poor and bioturbated limestone of the Lower Tamaulipas Formation (PEMEX, 2013).
3. Materials and methods
3.1. SELECTION OF SAMPLES
The carbonate rock samples that were used in this study were selected based on their macroscopic characteristics, in terms of textural and colour variations. Particulary, dark rock samples were selected because of to their presumed high organic content. Also, all the samples contained calcite veins suitable for fluid inclusion studies that were parallel to bedding (S0) and therefore considered as representative of the earliest stage of deformation stages. Such selection implies a highest likelihood of catching inclusion fluids that -among those in other types of veins- were nearest to diagenetic sources, thereby allowing the correlation between microthermometric determinations and those of organic matter. The numeric part of the sample label corresponds to depth in meters from the reference sample (AME-0) that corresponds to a youngest stratigraphic position.
3.2. ORGANIC CONTENT
Organic matter analyses were carried out at the Centro de Investigación en Geociencias Aplicadas of the Universidad Autónoma de Coahuila, Mexico (CIGA-UAdeC). Samples were milled, and the powder was analysed in a Thermo Scientific FLASH 2000 elemental analyser. Total Carbon (TC) was assessed by sample combustion (at 950°C under a pure oxygen atmosphere). The Total Inorganic Carbon (TIC) was determined after the subtraction of CO2 from samples, previously acidified with a solution (10%) of orthophosphoric acid (H3PO4). The total organic carbon (TOC) was estimated as the difference between TC and TIC. Rock Eval was used to calculate the TOC (in percentage), Hydrogen Index (HI; mg HC/g TOC), Oxygen Index (OI; mg CO2/g TOC) and Tmax (°C). The measurements were done in a Rock-Eval Turbo 6 device, using the IFP 160000 standard and following the method described by (Behar et al., 2001), with an instrumental precision of < 2%.
3.3. FLUID INCLUSIONS
Microthermometric determinations of fluid inclusions were carried out in doubly polished sections up to 300 pm thick. The petrographic characterization of samples was done by using the criteria of Roedder (1984), Goldstein and Reynolds (1994), and Van den Kerkhof and Hein (2001). Primary, pseudosecondary, and secondary inclusions were found. Most of the analysed inclusions were liquid-rich (degree of filling between 0.90 and 0.95), and their sizes ranged typically up to 20 μm in diameter. Primary fluid inclusions occurred in growth zones parallel to crystal faces or occurred as solitary inclusions or isolated groups of inclusions lacking healed fractures (in cases in which growth zones could not be identified). Pseudosecondary inclusions occurred along fractures that were covered by later growth zones. Numerous inclusions, both primary and pseudosecondary, showed evidence (or were suspects) of necking after liquid contraction, stretching, or leakage. Necking was exhibited in groups of fluid inclusions, resulting in a wide range of vapor-to-liquid ratios (degree of filling). These had elongated terminations that pointed to similar terminations in other inclusions. Only primary and pseudosecondary inclusions free from evidence for post-trapping phenomena were analysed. No fluid inclusion assemblages show evidence for heterogeneous trapping and no daughter crystals were found. All liquid-rich fluid inclusions homogenized into a liquid phase.
Salinities were calculated by using freezing point depression temperatures in the SALTY software by Bodnar et al. (1989) and Bodnar (1993). Eutectic temperatures were mostly obtained in quartz and are below -40 °C and point to the existence of complex polysaline solutions (e.g.Steele-MacInnis et al., 2016). Hydrohalite melting temperatures are ~ -21.1 °C, which imply NaCl-dominated brines.
Microthermometric studies were carried out using a Linkam THMSG600 heating-freezing stage available at the Instituto de Geología, Universidad Nacional Autónona de México. Calibration runs showed that the measurements were accurate to ±0.2 °C for low-temperature measurements, and to ±2 °C for high-temperature measurements.
3.4. PYROLYSIS - GAS CHROMATOGRAPHY - MASS SPECTROMETRY ANALYSIS (PYR-GC/MS)
The samples were pulverized in an agate mortar. The fine-grained powders (< 75 μm) were analysed using a pyrolizer coupled to a gas chromatograph with mass spectrometry detector (Pyr-GC/MS) Pyroprobe 5250, CDS Analytical, Agilent Technologies® 7890B GC - 5977 MS, available at the Instituto de Química, of the Universidad Nacional Autónoma de México. For the analysis, 15 mg of each sample were added to quartz tubes, packed with silanized wool, after that, the sample was placed in the pyrolizer in an inert atmosphere of He, at 610 °C, for 15 s. A 5% diphenylpolysiloxane column (30 mx 250 μm x 0.25 μm) was used, and helium was employed as carrier gas with a flow rate of 1 mL/min. The temperatures of the analysis method were: injector temperature 250 °C, the oven was started at 40 °C hold for 1.8 minutes, then heating began at 6 °C/ min until reaching 300 °C and the temperature was maintained for 1 minute. The ionization of the compounds was by electronic impact at 70 eV, acquired in SCAN mode, in a range of m/z 40-600. All the organic compounds were identified by their mass spectra by comparing them with the spectra reported in the library of the National Institute of Standards and Technology (NIST 2014), in a Mass Hunter Workstation Software Quantitative Analysis Version B.07.00, Agilent Technologies, Inc. 2008.
4. Results
4.1. ORGANIC MATTER CONTENT
The organic matter content in samples was determined by total organic carbon (TOC) measurements. The percentage measured is variable along the sequence (Table 1), with TOC of all samples below 1%. The samples with smallest values in TOC values were AME-13 and AME-24, while the highest values were obtained for AME-16 and AME-23.
4.2. TYPE OF KEROGEN
The kerogen found in samples is a mixture of Types II and III. In particular, the samples AME-25, AME-13, AME-16 and AME-23 correspond to Type IIb kerogen, while samples AME-5, AME-10 and AME-24 are closer to kerogen Type III. The pseudo van Krevelen diagram (Figure 2) also allows identifying that some samples show close groupings that do not correspond with height ranges in the stratigraphic column: (1) AME-25 and AME-13, are characterized the highest HI Hydrogen Index), (2) AME-16 A and AME-23, and (3) AME-10, AME-5 and AME-24. All the samples were characterized by a Tmax < 440°C (Table 2), suggesting that the organic matter is immature and implying low weathering of organics. Thus, there is a possibility of identifying the organic molecules. The analysis of Rock Eval pyrolysis suggests that some analysed samples correspond to a non-generating rock (S2<2), and other to a poor source rock (2<S2<3; Table 2).
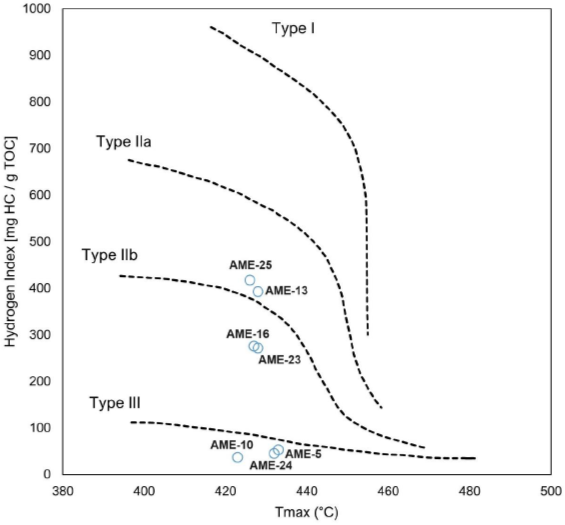
Figure 2 Pseudo van Krevelen plot for the samples across the Ameca Section in Pimienta Formation. Samples AME-10, AME-5 and AME-24 represent continental kerogen (Type III), whereas samples AME-16, AME-23, AME-13, and AME-25 are consistent with marine organic matter compositions.
Table 2 Pyrolysis experiments results per sample in the Ameca Section (Pimienta Formation).
| Sample | S1 mg HC/g rock |
S2 mg HC/g rock |
HI | OI | Tmax (°C) |
|---|---|---|---|---|---|
| AME-5 | 0.08 | 0.36 | 53 | 47 | 433 |
| AME-10 | 0.09 | 0.17 | 37 | 43 | 423 |
| AME-13 | 0.14 | 1.69 | 392 | 24 | 428 |
| AME-16 | 0.11 | 2.14 | 275 | 54 | 427 |
| AME-23 | 0.13 | 2.39 | 271 | 26 | 428 |
| AME-24 | 0.09 | 0.19 | 45 | 34 | 432 |
| AME-25 | 0.14 | 2.54 | 417 | 29 | 426 |
4.3. MICROTHERMOMETRY OF FLUID INCLUSIONS
The fluid inclusion study spans samples across a vertical section of 54 m within the Pimienta Formation. Temperatures of homogenization (Th) range between 58° and 360 °C, and temperatures of ice melting (Tmi) range between -1.0° and -16.5°C, which correspond to calculated salinities between 1.7 and 19.8 wt.% NaCl equiv. (Table 3). Despite the broad range of data sample level, the data are internally consistent at the fluid inclusion association (FIA) scale (Figure 3).
Table 3 Summary of microthermometric data of fluid inclusions in calcite samples from the Pimienta Formation.
| Sample | Reference depth (m) |
n | Type | Th (°C) min/avg/max |
Tmi (°C) max/avg/min |
Salinity (wt.% NaCl equiv.) min/avg/max |
Remarks |
|---|---|---|---|---|---|---|---|
| AME-0 | 0 | 21 | P/L+V | 88.0 / 236.3 / 296.0 | -3.4 / -7.2 / -13.2 | 5.6 / 10.4 / 17.1 | |
| AME-18-5 | 18 | 6 | P/L+V | 80.0 / 159.9 / 224.0 | -2.3 / -4.4 / -5.4 | 3.9 / 6.9 / 8.4 | |
| AME-24 | 24 | 16 | P/L+V | 154.0 / 206.7 / 225.0 | -1.9 / -3.6 / -7.9 | 3.2 / 5.7 / 11.6 | Some S/L1+L2+V inclusions present |
| AME-25 | 25 | 12 | P/L+V | 95.0 / 122.6 / 155.0 | -1.3 / -5.4 / -7.9 | 2.2 / 8.3 / 11.6 | |
| AME-27 | 27 | 22 | P/L+V | 58.0 / 94.9 / 176.0 | -1.0 / -5.2 / -16.5 | 1.7 / 7.8 / 19.8 | |
| AME-30 | 30 | 25 | P/L+V | 164.0 / 255.7 / 360.0 | -1.9 / -6.3 / -11.0 | 3.2 / 9.5 / 15.0 | |
| AME-37B | 37 | 24 | P/L+V | 112.3 / 256.8 / 335.0 | -6.0 / -7.6 / -14.0 | 9.2 / 11.2 / 17.8 | |
| AME-54 | 54 | 5 | P/L+V | 102.0 / 132.4 / 205.2 | -2.9 / -4.8 / -11.0 | 4.8 / 7.4 / 15.0 | Too few data, not representative |
Key: avg = average value, max = maximum value, min = minimum value, n = number of inclusions, L = liquid, L1+L2 = immiscible liquids (brine and CO2), P = primary inclusions, S = secondary inclusions, V = vapor.
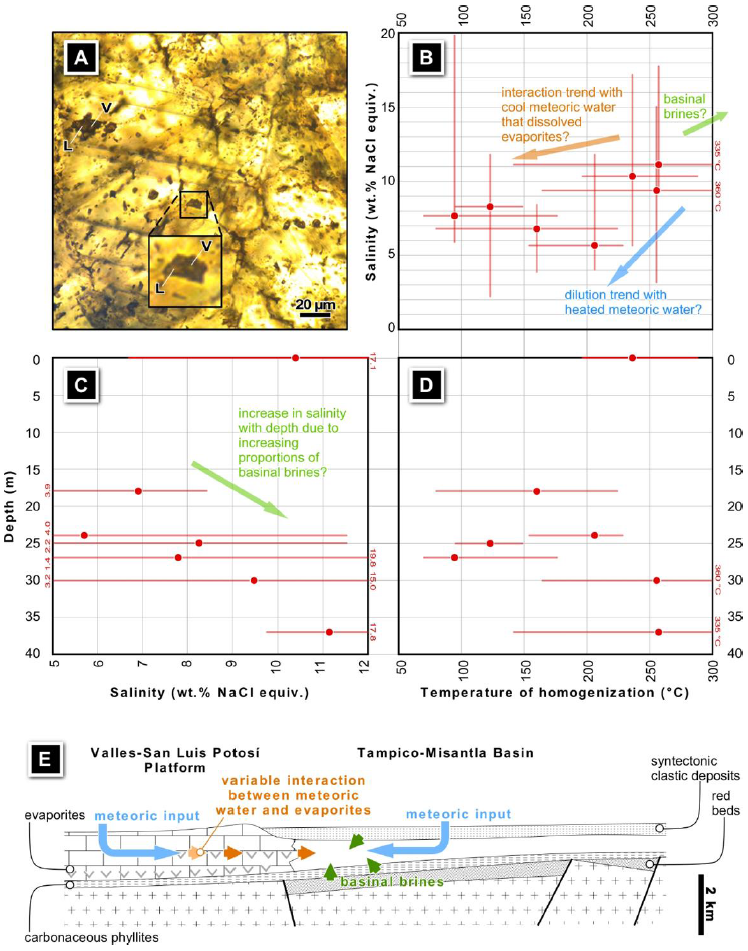
Figure 3 (A) Representative fluid inclusion association that consists of primary inclusions in calcite veins parallel to bedding at the studied section of the Pimienta Formation. (B) Correlation between average values (circles) and total span (bars) of temperatures of homogenization and calculated salinities of fluid inclusions per analyzed sample. (C) Correlation between depth in the analyzed section and calculated salinities of fluid inclusions (average and total span). (D) Correlation between depth in the analyzed section and temperatures of homogenization of fluid inclusions (average and total span). (E) Schematic geological section before deformation and dominant lithologies by the studied section, between the Tampico-Misantla Basin and the Valles-San Luis Potosí Platform (adapted from Fitz-Díaz et al., 2011) and possible sources for fluids and their interactions, as suggested from the exploratory fluid inclusion study.
4.4. NUMBER OF MOLECULES IDENTIFIED BY PYR-GC-MS
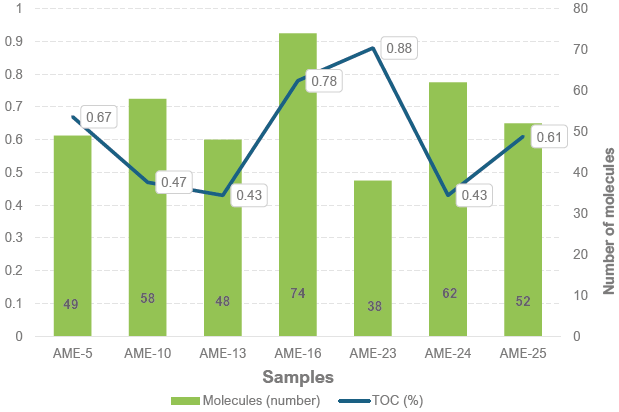
The molecules identified in each sample are variable and there is no apparent association between TOC and number of molecules. Figure 4 shows the number of molecules per sample. The highest number of molecules was found in AME-16 with 74 different molecules, while the lowest number of molecules was found in AME-23, where only 38 were counted.
4.5. IDENTIFIED FUNCTIONAL GROUPS
A total of 34 different functional groups were identified (Table 4), allowing the determination of organic matter assemblages, although not all the groups are present in all samples. The chemical functional groups present in all samples are alkanes, alkenes, amines, aromatic hydrocarbons, cycloalkanes, other hydrocarbons, ketones and polycyclic aromatic hydrocarbons.
Table 4 Functional groups detected in each sample.
| FUNCTIONAL GROUP | AME-5 | AME-10 | AME-13 | AME-16 | AME-23 | AME-24 | AME-25 |
|---|---|---|---|---|---|---|---|
| alcohols | — | + | + | + | + | + | + |
| aldehydes | — | — | + | — | — | + | + |
| alkanes | + | + | + | + | + | + | + |
| alkenes | + | + | + | + | + | + | + |
| alkynes | — | + | — | + | + | — | + |
| amines | + | + | + | + | + | + | + |
| amyl alcohols | — | — | — | + | — | — | — |
| aromatic aldehyde | — | — | — | — | — | + | — |
| aromatic hydrocarbons | + | + | + | + | + | + | + |
| carboxylic acids | — | — | + | + | + | — | + |
| cyanides | — | — | — | + | — | + | + |
| cycloalkanes | + | + | + | + | + | + | + |
| diazines | — | — | — | — | — | + | + |
| dienes | + | — | + | + | — | + | — |
| diketones | — | + | + | + | + | + | + |
| diols | — | + | + | + | — | + | + |
| diphenylene sulphides | + | + | — | + | + | + | — |
| ester of carboxylic acids | — | + | + | + | — | + | — |
| ethers | — | — | — | + | — | — | — |
| fatty acids | — | — | — | + | — | + | — |
| furans | — | — | — | + | — | + | + |
| heterocyclic aromatics | — | + | — | + | — | + | + |
| hydrocarbons | + | + | + | + | + | + | + |
| imines | + | — | + | + | — | — | + |
| ketones | + | + | + | + | + | + | + |
| nitriles | + | + | + | + | — | + | + |
| organic peroxides | — | — | + | — | + | — | + |
| phenols | + | + | — | + | — | + | + |
| polycyclic aromatic other hydrocarbons | + | + | + | + | + | + | + |
| pyrocarbonates | + | — | — | — | — | — | — |
| siloxanes * | + | + | + | + | + | + | + |
| sulfones | + | — | — | — | — | — | — |
| sulphurous acid esters | + | + | + | + | + | + | — |
| tetrahydrothiophenes | — | + | — | — | — | — | — |
| Total | 18 | 20 | 20 | 27 | 16 | 25 | 23 |
* Siloxanes are originated from the chromatographic column. The green rows indicate identification of the functional group, the yellow ones a lack of detection.
Distribution of organics in each sample shows that some functional groups -like alkanes, alkenes, other hydrocarbons (not included in the named functional groups), and polycyclic aromatic hydrocarbons- are present in all samples (Figure 5), which is consistent with the oil-prone nature of the rocks. Other functional groups are less represented, and some are scarce, and found in only one sample (i.e. amil alcohol, ethers, tetrahydrothiophenes).
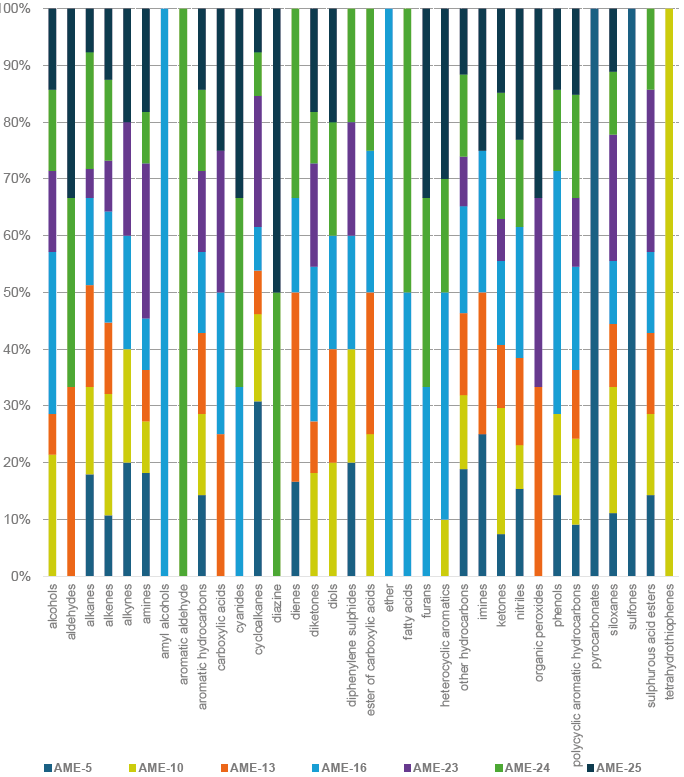
Figure 5 Functional groups identified in all samples, listed in alphabetical order. The data are normalized to 100%, each colour corresponds to a sample. The most common chemical groups (alkanes, alkenes, other hydrocarbons, ketones, and polycyclic aromatic hydrocarbons) are found in all samples; while others were identified in most of the samples, and some are scarce (for example, amil alcohol, ethers, tetrahydrothiophene).
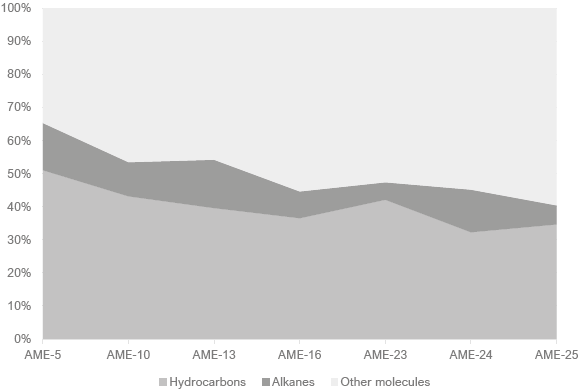
The proportion of hydrocarbons, regarding other molecules, is congruent with the petroleum vocation of this formation; in all samples the number of hydrocarbons counted represents more than 40% of all the organics (see Figure 6). Alkanes represent a variable number of molecules, being the minimum number of 11% in AME-23 and the highest 26% in AME-13.
4.6. BIOMARKERS
The molecules identified by Pyr-GC-MS were selected, and then grouped into seven categories according to their nature and derivates (formed by pyrolysis): 1) proteins (Pr), 2) carbohydrates (Ps), 3) fatty acid and lipids (Lp), 4) lignin (Lg), 5) polycyclic aromatic hydrocarbons (PAHs), 6) alkylbenzene-derivatives (Ab), and 7) sulphur derivatives (S) (Fabbri et al., 2005; Sparkes et al., 2016). The contribution of each group of molecules was weighted, adding all the percentages of molecules per category (Figure 7). This approach does not attempt to represent all organic compounds in the samples; but to employ the most important compounds to demonstrate potential differences between samples in a defined manner. The number of molecules derived from biomarkers is variable in each sample: the most abundant were proteins, carbohydrates, lipids, and lignin, while the least abundant were polycyclic aromatic hydrocarbons, alkylbenzene derivatives, and sulphur derivatives. The contribution of those molecules represents less than 50% of the total of organics in all the samples.
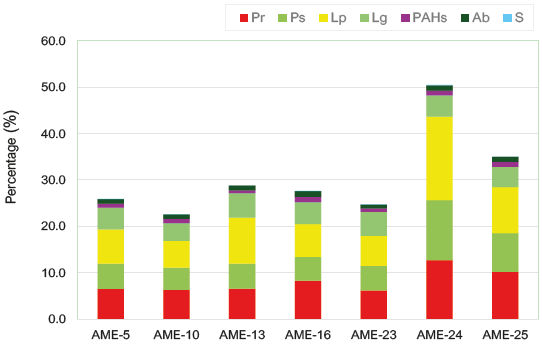
Figure 7 Main groups of molecules (biomarkers) identified in each sample. The total in each category corresponds to the sum of the percentages of each molecule or derivate counted. Key: Pr = proteins, Ps = carbohydrates, Lp = fatty acid and lipids, Lg = lignin, PAHs = polycyclic aromatic hydrocarbons, Ab = alkylbenzene derivatives, S = sulphur derivatives. Sulphur derivatives were detected on on AME-5, AME-10, AME-16, and AME-24, but represent a very small percentage (0.1%), and are not graphically visible.
5. Discussion
5.1. ORGANIC MATTER COMPOSITION AND KEROGEN TYPE
Despite the oil prone vocation in the zone, the TOC values obtained in this study are relatively low (<1.0 wt.%), compared with 4.5 wt.% reported by Jarvie and Maende (2016) for the Tampico-Misantla Basin (TMB). According to the Atlas Geológico, Recursos no Convencionales (CNH, 2014) the TOC values in the Pimienta Formation range between 1.0 and 5.5 wt.%. Vega-Ortiz et al. (2020) evaluated some samples in the TMB and obtained TOC values between 0.25 and 2.3 wt.% (average 0.72 wt.%). Martínez-Yáñez et al. (2023) reported maximum TOC contents at 0.82 wt.% for the Pimienta Formation, also at the Ameca section. Therefore, despite some variability, the TOC values we found are in well agreement with those reported in earlier literature across other localities of the same formation, as mentioned before. Regarding the kerogen type of the measured samples, it corresponds to Type II and III (Figure 2), which is also consistent with findings in other localities (Martínez-Yáñez et al., 2023). The older-to-younger observation of kerogen types through the Pimienta Formation shows twice alternating types IIb (marine) and III (continental) through time (IIb→III→IIb→III).
5.2. FLUID PROCESSES AND POSSIBLE SOURCES
Earlier studies of fluid inclusions in the Pimienta Formation at the Padhí Section, 150 km to the southeast from this study area, reported salinities between 0.4 and 29.4 wt.% NaCl (equiv.) and temperatures of homogenization between 79° and 280 °C (González-Betancourt et al. 2022). Both the Padhí and Ameca sections are located by the fringe between the platform and the Tampico-Misantla basin and, as a general feature, both studies yielded comparable fluid inclusion data, indicating similar processes involved in fluid sources and their interaction (addressed in detail below). Sampling at the Padhí section was carried out similarly to the section studied here, although at a higher spatial resolution and attaining a total vertical span of almost 200 m within the Pimienta Formation (see Supplementary Material in González-Betancourt et al., 2022; in comparison, sampling for fluid inclusion studies in the Ameca section attains 54 m).
All the calcite veins sampled in this study for fluid inclusion studies were parallel to S0, implying correspondence with early stages of orogenic compression once the stress fields were switched from vertical (subsidence) to horizontal (orogenic) compression. Therefore, the inclusion fluids are considered as likely to have sampled, at least, deep-seated basinal brines that were thus mobilized. At the scale of each analyzed sample and fluid inclusion assemblage (FIA), no conclusive correlation features can be drawn between temperatures of homogenization (Th) and calculated salinities. Sample AME-30 is an exception as Th and salinity are positively correlated, which is commonly featured in dilution trends (as of Van den Kerkhof and Hein, 2001). The general correlation between average Th and salinity (Figure 3B) does not support a simple dilution trend either -a feature that we are addressing later. Average salinities increase with depth (with a sole exception; Figure 3C), which suggests an increasingly dominant role of basinal (sedimentary-diagenetic) brines (up to ~20 wt.% NaCl equiv.; Table 3) with depth. The correlation between Th and depth (Figure 3D) is compatible with the above interpretation. Conversely, the role of meteoric water would increase with height in the sedimentary series, as interpreted by Fitz-Díaz et al. (2011) in a conterminous section in the Mexican fold-thrust belt. In other words, a general dilution trend is suggested as a function of height in the analyzed sedimentary series. Then, the correlation between average Th and salinity (Figure 3B) would not have occurred between a deep basinal source and a single shallow source. Instead, we suggest that relatively high-temperature basinal brines (Figure 3D) would have been diluted with two shallow reservoirs: (1) relatively moderate temperatures (between 100° and 150 °C) and low salinity fluids of meteoric origin that underwent little interaction with country rocks, and (2) cool and moderately saline fluids that could have resulted from the interaction between (A) fresh meteoric water and (B) evaporites or a reservoir of basinal brines. Hence the "tilted funnel" shape of average fluid inclusion data (Figures 3C and 3D). Evaporites in the region are found in association with the Valles-San Luis Potosí platform (e.g.,Fitz-Díaz et al., 2011), on the western edge of the studied locality. Therefore, it is likely that the studied inclusion fluids sampled multiple sources and types of interaction between these and country rocks (Figure 3E). The plausibility of such sources must be assessed by means of stable isotope studies, nonetheless. Such interpretations can be evoked for the Padhí section as well, which, possibly due to the higher resolution of the sampling there (with respect to the Ameca section), show clearer correlations between data (as of the contents in Suplementary Material in González-Betancourt et al., 2022). Indeed, at Padhí, depth vs. salinity, depth vs. Th, and Th vs. salinity show globally positive correlations, which agree well with temperature and salinity increase with depth due to an increasing degree of entrainment of fresh meteoric water with height, thus diluting deep fluids that can be identified with basinal brines. Interestingly, though, the Th vs. salinity correlation, which otherwise displays a nitid positive trend, also shows excursions towards the highest salinities in the section (>16 wt.% NaCl equiv.) at <200 °C or towards the lowest salinities (<5 wt.% NaCl equiv.) at >200 °C. Such anomalies in the thermochemical behavior of inclusion fluids can be explained by the interaction of basinal brines towards dilution within a "normal" trend with two additional types of fluids: (1) fresh meteoric water that became exceptionally deep entrained through the carbonate sequence, and (2) brines with higher salinities than those of typical basinal brines, which could be derived, in their turn, from the interaction of either deeply entrained meteoric water or basinal brines with evaporites. Therefore, despite the differences in resolution of the respective sampling and depth within the respective stratigraphic columns, the sources and processes that governed the characteristics of aqueous brines -as the Tampico-Misantla basin switched from subsidence to orogeny- remain essentially the same along the carbonate sequences within the apron between platform (horst position) and basin (graben position).
5.3. SCOPE OF BIOMARKER ANALYSIS
The Jurassic source rocks in the Tampico-Misantla Basin are thought to be oil-prone by Jarvie and Maende (2016). This is based on the total organic carbon (TOC) and hydrogen index (HI) values, associated with marine organic matter. However, the range of HI values in this study (37 to 417) suggests that most organic matter in the analysed section comes from continental plants, complemented with altered/oxidized plant material (Figure 8). These findings seem to contradict earlier findings on the matter, although, this is not necessarily the case because the interpretation of the provenance of the organics is not straightforward: a closer examination of the assemblage of biomarkers (obtained by Pyr-GC-MS) reveals that organic matter came from both continental and marine sources (see section 5.1). Therefore, the use of the Pyr-GC-MS technique allowed a detailed interpretation on the provenance of the organics. The use of the hydrogen index resulted in a good first approximation even though, as this study reveals it is necessary to complement it with other techniques.
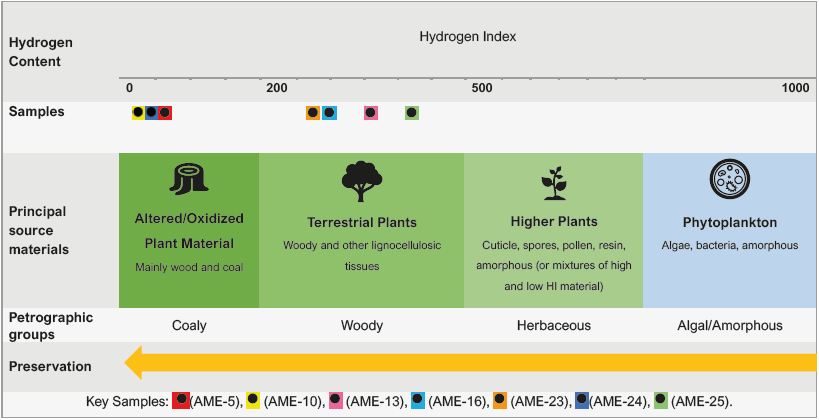
Figure 8 Main organic matter groups, variation of hydrogen index values, and measurements in our samples. Modified after Talbot and Livingstone (1989).
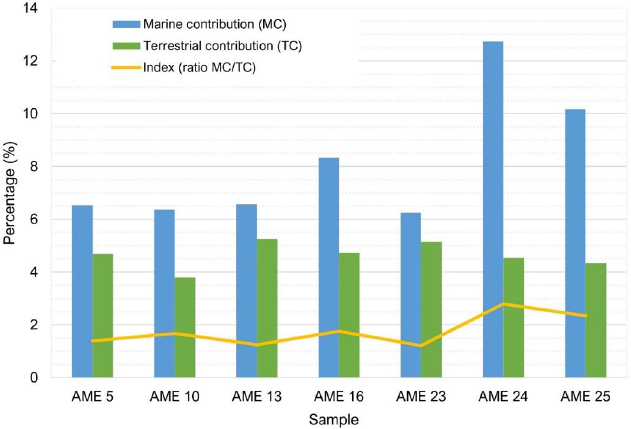
One important point in this research was to trace the origin of the organics. Proteins, and their degradation products (N-bearing fragments), are roughly associated with organic matter from marine environments, whereas lignin are usually related to terrestrial plant sources. Thus, an organic matter provenance index was calculated, corresponding to the amount of proteins with respect to the contribution of lignin (I = Pr/Lg) per sample (Figure 9). All samples contain organic matter that comes from both marine and terrestrial (continental) sources. Despite the fluctuating proportion between sources fluctuates across the Pimienta Formation, the values of the I index increases with stratigraphic hight, indicating increasing marine organic matter with time. In other words, despite the occurrence of both marine and continental organics elsewhere across the analysed section, the lignin contribution index (I) shows the same trend for an increasing marine influence toward the base of the Pimienta Formation. This agrees with the previous reports, for example, with regard to the microfossils and textural analysis of the Pimienta Formation, which indicate an open marine environment (Martínez-Yañez et al. 2017).
5.4. GEOLOGICAL PROCESSES
A marine-and-terrestrial mixed origin of the organic matter of the Pimienta Formation at the Ameca section aligns with the results from cores in the central-western flank and central part of the Tampico-Misantla basin (Granados-Hernandez et al., 2017; Vega-Ortiz et al., 2020). For the lower part of the unit, where TOC values are the highest and radiolarian-rich facies are dominant, Martínez-Yáñez et al. (2017) proposed the influence of upwelling currents as the catalyst to produce marine organic matter. Alternatively, the regular presence of bentonite levels suggests that iron fertilization of surface waters by the input of volcanic ash may constitute a likely additional or alternative mechanism. Either of them would be mechanism to increase phytoplankton growth currently occurring in areas of the Pacific Ocean (Duggen et al., 2010; Langmann et al., 2010). During the deposition of the upper part of the Pimienta Formation, continental organic matter was transported into the basin by rivers, which also must have introduced continental-derived nutrients that stimulated marine productivity.
5.5 ADVANTAGES AND DISADVANTAGES OF THE METHODOLOGICAL APPROACH
Pyrolysis implies the fragmentation of a sample by the effect of heat, resulting in the formation of molecules of lower molecular mass (Sephton, 2014). There is, however, a compromise in the use of the technique, to get the bigger fragments that could bring useful information and to avoid undesirable reactions (by secondary reactions) that could yield wrong information (Sephton, 2014). Nonetheless, the coupling of pyrolysis with GC-MS provides a unique opportunity to complement the results obtained by other techniques in sedimentary analysis (by prior solvent extraction). Pyr-GC-MS allows for rapid determination of the assembly of organic compounds in sediments, which is a significant advantage compared to the time spent on analysis using selective solvent extraction to analyse residues. Furthermore, this technique allows direct analysis of samples without prior treatment or the need for solvents, thereby reducing the environmental impact of the research. Even if it is destructive, Pyr-GC-MS requires small amounts of samples (in the order of milligrams 10-50 mg for direct pyrolysis, Chen, 2023), so it allows to analyse rare or scarce samples. A disadvantage of the analysis is the homogeneity of samples to ensure the reproducibility (Chen, 2023), in this case 100 g of the sample were pulverized, then homogenized, and a small aliquot was taken to overcome this issue.
6. Conclusions
The Pimienta Formation may not have the expected TOC values for a highly hydrocarbon-producing area. However, this finding does not rule out a significant accumulation of organic matter, which could have migrated from other regions, and become enriched in the area. This is also consistent with results from other works that determined that the Pimienta constitutes both a source and an accumulation rock.
The identification of organic matter is fundamental for reconstructing the history of an environment. The traditional methods of analysis for petroleum geochemistry could give a first idea of the quality of the source rock, but if a more detailed understanding is required (i.e. the composition and diversity of organics) the use of other techniques is a priority. Pyr-CG-MS is technique that allows the rapid determination of organics using small amounts of sample. Together with other analysis, some geological processes occurring in the Pimienta Formation can be envisioned. Pyr-GC-MS is a rapid method for the identification of molecules and tracing their provenance. A comparison of the biomarkers obtained by traditional extraction protocols is necessary in the future, to compare the scope of the results. Equally necessary is to complement these studies with isotopic analysis, to unequivocally determine the origin of the fluids and organic matter.
Contributions of authors
The authors confirm contribution to the paper as follows: study conception and design: MCG, ACC, FNU; data collection: FNU, ML, EFG, JJEC; analysis and interpretation of results: MCG, ACC, DC, ACM; draft manuscript preparation: MCG, ACC, FNU, funding acquisition MCG. All authors reviewed the results and approved the final version of the manuscript.
Financing
This study was supported through the DGAPA-PAPIIT research grant IN111720 and personal allocations to UNAM academicians.
Conflicts of interest
The authors declare that they have no known conflicts of interests, financial or personal, that could have appeared to influence the research.
Handling editor
Francisco J. Vega

