


 nueva página del texto (beta)
 Inglés (pdf)
 Artículo en XML
 Referencias del artículo
 Enviar artículo por email
 Citado por SciELO
  Similares en
SciELO
Similares en
SciELO 
 Permalink
Introduction
In the twenty first century Brazil has emerged as the world’s second largest exporter of cotton. This sudden expansion of national production represents the third distinct cycle in the history of cotton cultivation in Brazil whose cultivation preceded the arrival of the Europeans and would end with Brazil becoming a major world exporter. Our survey of this history is based on an extensive documentary and statistical review of the information on cotton cultivation in Brazil from the 18th century to the present. This review has allowed us to observe the different stages through which this crop has passed. It uses a regional historical approach and has as fundamental variables: the change and displacement of the production regions over time, the characteristics of the type of cotton that is grown and marketed, the dynamics between production for the internal and external market, as well as the characteristics of the type and size of producers. We also evaluated other intervening variables such as the relationship between growth and stagnation of production, the causes that originate the end of each stage, cultivation practices, production amounts, and production value, by region and over time.
At the end of the 18th century Brazil was the world’s largest exporter of Gossypium barbadense (also known as arboreal or bush cotton) with production concentrated in two northeasters states. Brazil’s importance in international exports went into relative decline as United States production of Gossypium hirsutum (also known as herbáceo or upland cotton), entered the market in the late 18th and early 19th century. But during the "cotton famine" crisis of the US Civil War in the 1860s, Brazil re-emerged again as a major world producer. Thereafter the Northeastern producers maintained a relatively stable volume of exports with a final boom in exports occurring before and after World War I.
The next phase of cotton production would occur after World War I. As early as the 1870s upland cotton began to be grown in São Paulo, but that state would not become the dominant producer until the 1930s. This shift in centers of production and in the type of cotton produced was also reflected in changes in consumption. By the 1930s the primary consumption of cotton was the internal market and Brazil’s expanding textile and clothing industries, although the country still maintained modest exports. But this period ended in the 1980s as disease and the end of tariff protection reduced production to such an extent that Brazil could no longer supply even its internal market and it became a major importer of cotton in the 1990s. At the same time significant production of bush cotton in the northeast came to an end and even the small southern and southeastern farms producing upland cotton began to decline. In the decade of the 1990s Brazil for the first time in its history become a significant importer of cotton.
The third and final period in this history of Brazilian cotton production occurred at the beginning of the twenty-first century when Brazilian farms again began to grow cotton, but this time in the newly developed region of the Center-West where thousand-hectare cotton farms became the norm. Today Brazil is currently the fourth largest grower of cotton in the world, surpassed by India, China and the United States and is also a major consumer of the product for its extensive textile sector. It is now the second leading world exporter of the product, shipping about 9 000 000 bales, against 15 000 000 sent into the world market by the United States. How this recent expansion occurred and how it relates to earlier periods of growth is the central theme of this essay.
Phase 1
This phase can be said to have begun before the arrival of Portuguese colonists in Brazil, since they adopted the native American Gossypium barbadense plant as their source for cotton. Wild cotton plants pre-date modern man, with several varieties scattered around the world, and there were several different continental centers where the plant was domesticated (Wendel et al., 2009). Both in the American continent and in Asia there is evidence of domesticated cotton since at least 6 000 years ago and complete textiles date from at least 3 000 years BC. In coastal Peru cotton of the Gossypium barbadense variety, sometimes called kidney cotton for the shape of its pods, or bush cotton for its growth on small trees or bushes, was cultivated as early as 2 500 BC (Stephens and Moseley, 1974, p. 110). In Brazil there is evidence of its use by the Native Americans in western South America prior to the arrival of the Portuguese (Amaral, 1958, v. ii ; Souza, 1851, p. 126). In turn East Indian produced cotton cloths were to be found throughout Eurasia since the beginning of the Christian era, and already by the 15th century East Indian cotton was well known in Europe and would became a staple in Portuguese world trade (Riello, 2013).
Thus, cotton was cultivated by the Portuguese from the earliest period of colonization. In this first phase the dominant plant was the Gossypium barbadense which in the Guianas and Brazil obtained two crops per annum and usually remained productive for five to six years (Baines, 1835, pp. 290-291). It produced an extra-long staple cotton and was initially highly desired in the first cotton weaving looms of Europe.1 Already in the 16th century Brazilian cotton lint was being imported into northern European markets.2 But its major growth came in the 18th century with the direct support of the Portuguese government. To settle the northern frontier of its colony the Portuguese government under Pombal established two merchant monopoly companies. The Companhia Geral do Comércio do Grão-Pará e Maranhão was founded in 1755 to develop Maranhão, and the Companhia Geral de Pernambuco e Paraíba was established four years later to promote the further expansion of production in Pernambuco. These private merchant companies were given monopolies over slave imports and cotton exports. While cotton produced by African slave labor dominated in the Maranhão province and began with the merchant company support, in the case of Pernambuco cotton was already being produced by small free farmers well before the establishment of the company (Carreira, 1988; Diegues Jr., 1950; Martins and Melo, 2018). It would appear that Maranhão began exporting cotton before Pernambuco, and that this began in the 1770s on an annual basis, whereas Pernambuco did not enter the trade on a serious basis until the 1790s.3 Maranhão remained the primary exporter and over two thirds of its exports went to England throughout most of the 19th century.4
Brazil, of course, was not the only American region producing cotton and until the 1780s the British imported most of their American produced cotton from the French West Indies. But the growing conflict with France and the slave uprisings in Saint Domingue in 1791 led the British to seek new American imports and they turned to Brazil as a major supplier (Krichal, 2013, pp. 17, 20). The first Brazilian cotton imported into England seems to have occurred in 1781. 5 Already in the year 1786 some 2 000 000 out of the 20 000 000 tons of cotton imported into England came from Brazil (Baines, 1835, p. 304). By the next year it exported some 2 500 000 tons (Donnell, 1872, p. 43). The first cotton from the United States also appeared to have been first imported in the 1780s and it became significant by the 1790s (Baines, 1835, p. 302). Both the United States and Brazil thereafter were among the principal foreign suppliers for cotton for the British textile industry for most of the 19th century.6
Initially Brazil’s production of long-fiber cotton was considered of better quality than short fiber of the so-called upland cotton that was being produced in the United States and was initially more suitable for the production processes then adopted in English manufactures (Pereira, 2017). This allowed Brazil to maintain a prominent position in cotton exports to the English market for many years.7 In the period from 1785 to 1815, Brazil represented a fifth of cotton imports to Liverpool and the United States only started to take the lead in the next few decades.8 By 1820 England was importing 152 000 000 pounds of cotton, of which Brazil accounted for 19%. Despite the fact that England had obtained preferential treatment in Brazil and became a major market for British exports in this period, the value of raw cotton exports of Brazil to England exceeded the value of British cotton goods imported into Brazil until 1825.9 The intrinsic quality of Northeastern cotton and its adaptability to the technical conditions required by the market did not mean that the exported product was of good quality. Fraud and poor packaging were a constant complaint from importers and from Brazilian government officials (Albano, 1918, p. 23; Soares, 1860, pp. 47-53). Although Brazilian imports remained the second most important foreign cotton for British producers in the period from 1820 to 1833, its volume remained relatively stable while imports from the United States in this period more than doubled (see table 1).
Table 1 Imports of raw cotton into England, 1820-1833
| Origin | USA | Brazil | Turkey & Egypt | Other foreign | Sub total all foreign | British colonies | Total |
|---|---|---|---|---|---|---|---|
| 1820 | 89 999 174 | 29 198 155 | 285 350 | 2 045 147 | 121 527 826 | 30 144 829 | 151 672 655 |
| 1821 | 93 470 745 | 19 535 786 | 856 868 | 2 504 180 | 116 367 579 | 16 169 041 | 132 536 620 |
| 1822 | 101 031 766 | 24 705 206 | 395 077 | 1 534 483 | 127 666 532 | 15 171 096 | 142 837 628 |
| 1823 | 142 532 112 | 23 514 641 | 1 334 547 | 1 988 773 | 169 370 073 | 22 032 430 | 191 402 503 |
| 1824 | 92 187 622 | 24 849 552 | 7 719 368 | 1 278 720 | 126 035 262 | 23 344 820 | 149 380 082 |
| 1825 | 139 908 699 | 33 180 491 | 18 938 246 | 7 245 229 | 199 272 665 | 28 732 626 | 228 005 291 |
| 1826 | 130 858 203 | 9 871 092 | 10 032 400 | 755 153 | 151 516 848 | 26 090 553 | 177 607 401 |
| 1827 | 216 924 872 | 20 716 162 | 5 071 519 | 1 279 873 | 243 992 426 | 28 456 483 | 272 448 909 |
| 1828 | 151 752 289 | 29 143 279 | 6 926 288 | 1 579 711 | 189 401 567 | 38 359 075 | 227 760 642 |
| 1829 | 157 187 396 | 28 878 386 | 5 986 385 | 1 070 800 | 193 122 967 | 29 644 444 | 222 767 411 |
| 1830 | 210 885 358 | 33 092 072 | 3 401 710 | 639 823 | 248 018 963 | 15 942 489 | 263 961 452 |
| 1831 | 219 333 628 | 31 695 761 | 8 081 024 | 697 691 | 259 808 104 | 28 866 749 | 288 674 853 |
| 1832 | 219 756 753 | 20 109 560 | 9 113 890 | 598 048 | 249 578 251 | 37 254 274 | 286 832 525 |
| 1833 | 237 506 758 | 28 463 821 | 987 262 | 1 696 108 | 268 653 949 | 35 002 888 | 303 656 837 |
Source: Donnell (1872, pp. 79-177).
Brazilian production in that period was primarily arboreal or tree cotton, which required little investments to enter into production, and the profitability of its export attracted both small and large farmers in the Northeastern region. Although there were large landowners using slave labor cultivating the crop, there was a significant participation of small landowners, renters and even squatters. The processing of cotton was in the hands of small traders who bought cotton from producers and sold it to exporters after processing (Andrade, 2011, pp. 158-159).
But new technological transformations occurred in cotton processing and fabric production in the early 19th century which allowed the use of other cotton varieties in the English textile industry.10 This resulted in the United States becoming the main source of cotton supply to England (Watts, 1871, p. 5). Although Brazilian exports also grew in this period, they now fell below 5% of total English cotton imports even though their exports to England had doubled by mid-century. Thus, by the 1850s Brazil was exporting on average of around 124 000 bales (51 000 000 tons of cotton) per annum to England, but this was well behind cotton imports from the East Indies and the United States (see table 2).
Table 2 Imports of raw cotton into Great Britain (in bales), 1852-1861
| Year | USA | Brazil | West Indies | Egypt | East India | Total | Average weight per bale | Total in pounds |
|---|---|---|---|---|---|---|---|---|
| 1852 | 1 794 698 | 142 839 | 9 468 | 189 230 | 221 379 | 2 357 614 | 418 | 785 482 600 |
| 1853 | 1 531 709 | 132 174 | 7 710 | 106 522 | 485 385 | 2 263 500 | 426 | 901 987 600 |
| 1854 | 1 667 902 | 107 037 | 8 252 | 81 218 | 308 184 | 2 172 593 | 408 | 886 417 900 |
| 1856 | 1 626 086 | 134 528 | 6 708 | 113 961 | 396 027 | 2 277 310 | 396 | 901 814 700 |
| 1856 | 1 758 295 | 121 521 | 11 323 | 113 111 | 469 508 | 2 463 768 | 414 | 1 019 999 900 |
| 1867 | 1 481 717 | 168 340 | 11 467 | 75 528 | 680 466 | 2 417 588 | 403 | 974 287 900 |
| 1858 | 1 855 340 | 108 886 | 6 897 | 101 405 | 350 218 | 2 422 746 | 419 | 1 018 130 000 |
| 1869 | 2 086 341 | 124 867 | 8 338 | 99 876 | 509 688 | 2 829 110 | 421 | 1 191 065 300 |
| 1860 | 2 580 843 | 103 050 | 9 956 | 109 985 | 562 852 | 3 366 686 | 421 | 1 417 374 800 |
| 1861 | 1 842 610 | 99 120 | 10 390 | 97 280 | 987 530 | 3 036 930 | 415 | 1 260 326 900 |
Source: Williams (1868, p. 8).
This pattern of cotton imports to England was broken with the closure of North American ports to cotton exports during the US civil War. The result was a massive increase of Brazilian exports to England, as England encouraged alternative sources to expand production to meet its needs. Brazil succeeded in tripping its exports in a short period of time, reaching 384 000 bales by 1865 and 624 000 bales by 1868, and increased its share to 19% of all cotton imports to England (see graph 1).
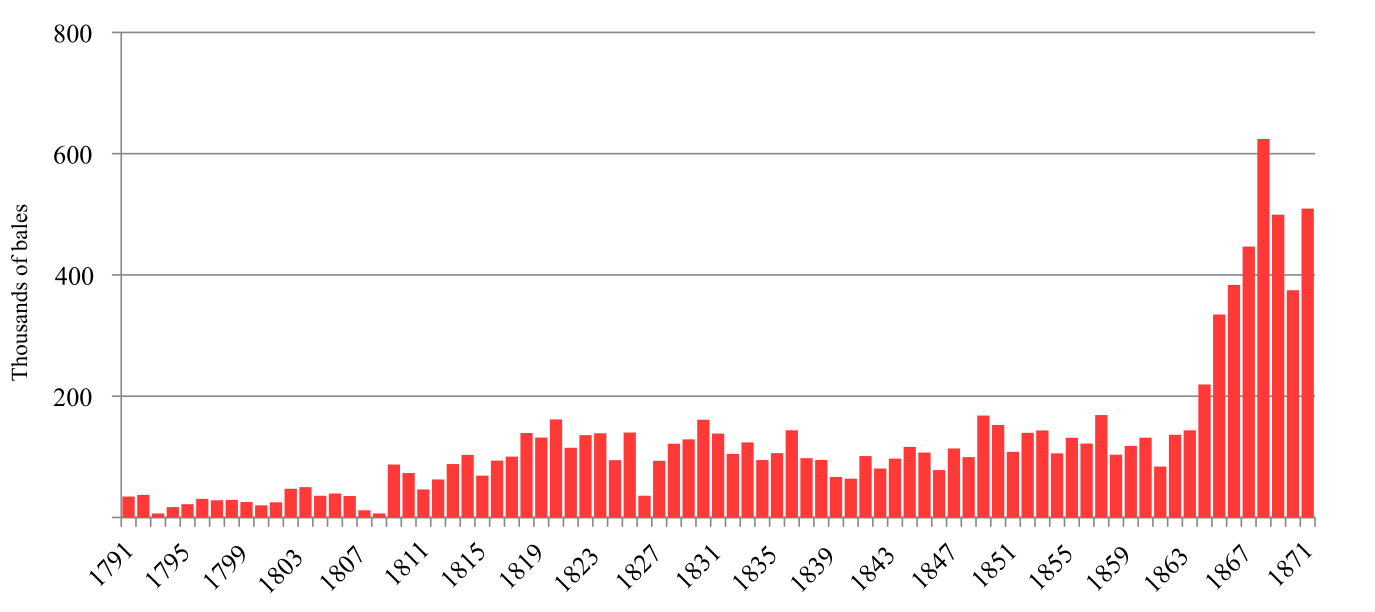
Sources: Smithers (1825, p. 147); Donnell (1872).
Graph 1 Brazilian raw cotton imports into Great Britain, 1791-1871 (in bales)
Except at the beginning and middle of the 19th century, and in early 20th century the share of cotton exports in the total value Brazilian exports was quite limited. Throughout the years 1821 to 1860, Brazilian exports remained practically stable, but their share in Brazilian exports fell from a quarter to 5% of the total as coffee came to dominate Brazilian exports (see graph 2casi no escucho podcast :P). In this period, production and exports were concentrated in the Northeast. In the middle of the 19th century, in some provinces, such as Maranhão, Paraíba, Ceará and Alagoas, cotton represented about 80% of the value of exports, but they were a reduced percentage in Bahia and Pernambuco due to their high sugar exports. Of these cotton exports, 80% went to England, 10% to Spain and 5% to France (see table 3).
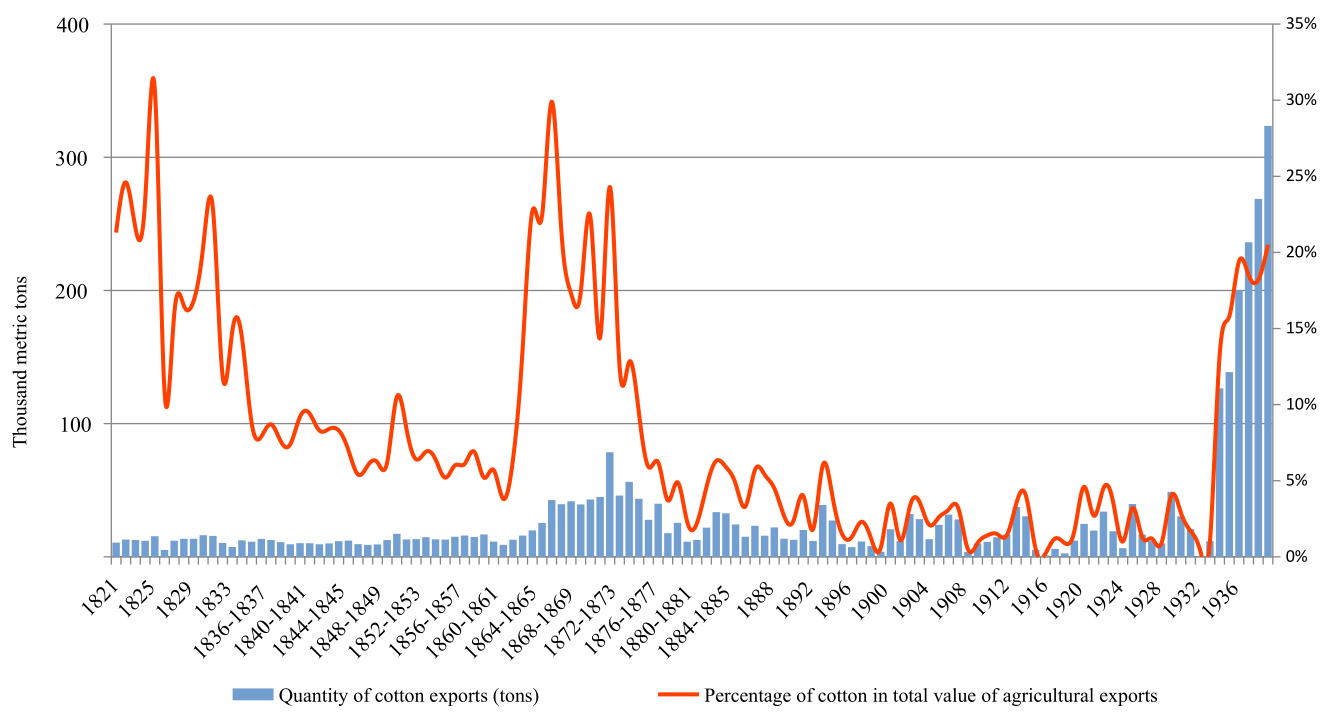
Source: Instituto Brasileiro de Geografia e Estatística (1939/1940).
Graph 2 Quantity of Brazilian Cotton Exports (in tons) and their Importance in the Value of Total Agricultural Exports of Brazil 1821-1939
Table 3 Brazilian exports of cotton by province, 1849-1850
| Provínce | Arrobas | Value (mil réis) | Value of cotton in total provincial exports (percentage) |
|---|---|---|---|
| Maranhão | 409 378 | 1 954 637 | 22 |
| Pernambuco | 203 178 | 1 048 271 | 14 |
| Alagoas | 177 968 | 1 121 317 | 49 |
| Paraíba | 176 078 | 864 869 | 58 |
| Bahia | 95 913 | 466 398 | 41 |
| Ceará | 43 043 | 204 553 | 88 |
| Pará | 3 544 | 13 877 | 1 |
Given the small investments required to produce cotton and its adaptability to semi-arid conditions, cotton growing in the Northeast was carried out on all sizes of farms. It also became a crop associated with livestock, as cotton residues could be used to feed animals (Koster, 1941, p. 452; Lirbório, 2017, p. 104; Nogueira and Simões, 2009, p. 4). In Maranhão the cultivation was carried out on large farms by slave labor, while in other areas of the Northeast, production by small non-slave producers was important. In Pernambuco and neighboring regions cultivation methods were rudimentary differing little from traditional Amerindian practices. The plow was almost unknown, plant diseases were not treated and seeds were not selected (Albano, 1918, p. 33). Not only was the agriculture rudimentary, but so was the ginning and packaging processes (Koster, 1941, p. 452). The causes of the loss of Brazilian competitiveness over the years 1820 to 1860 are multiple. Several memoirs and studies of the period point to the problems related to the baling and commercialization process. Although the Brazilian fiber was of high quality, the bales arrived mixed with low quality cotton. Finally, recent studies have also emphasized the high tax burden on cotton exported by Brazil (Pereira, 2017). These multiple causes reduced Brazil’s competitiveness, which thus remained a secondary supplier in the growing European cotton market.
Nevertheless, there were two periods of growth in cotton exports in the 19th and 20th centuries (see graph 3). The first was during the American Civil War when the US left the market creating a "cotton famine" (Watts, 1871, pp. 7, 12-13). England seeking alternative supplies started to stimulate the expansion of production in several countries, including Brazil. As early as 1857 the Cotton Supply Association was established to develop alternative supplies. India was the principal area of initial activity, but the English also found Brazil a good area for growing cotton.11 Although several Northeastern provinces, such as Pernambuco, Maranhão, Pará, Ceará, Rio Grande do Norte, Bahia, and Paraíba produced cotton for export, it would be in the province of São Paulo, with no history of production or export until 1861, that the Association would begin its experiments with the New Orleans seed (Watts, 1871, p. 85).12 Prices and demand were high and this drew small producers to concentrate on cotton and British merchants provided advances to farmers so that they could concentrate on cotton cultivation (Beckert, 2004, p. 1414).
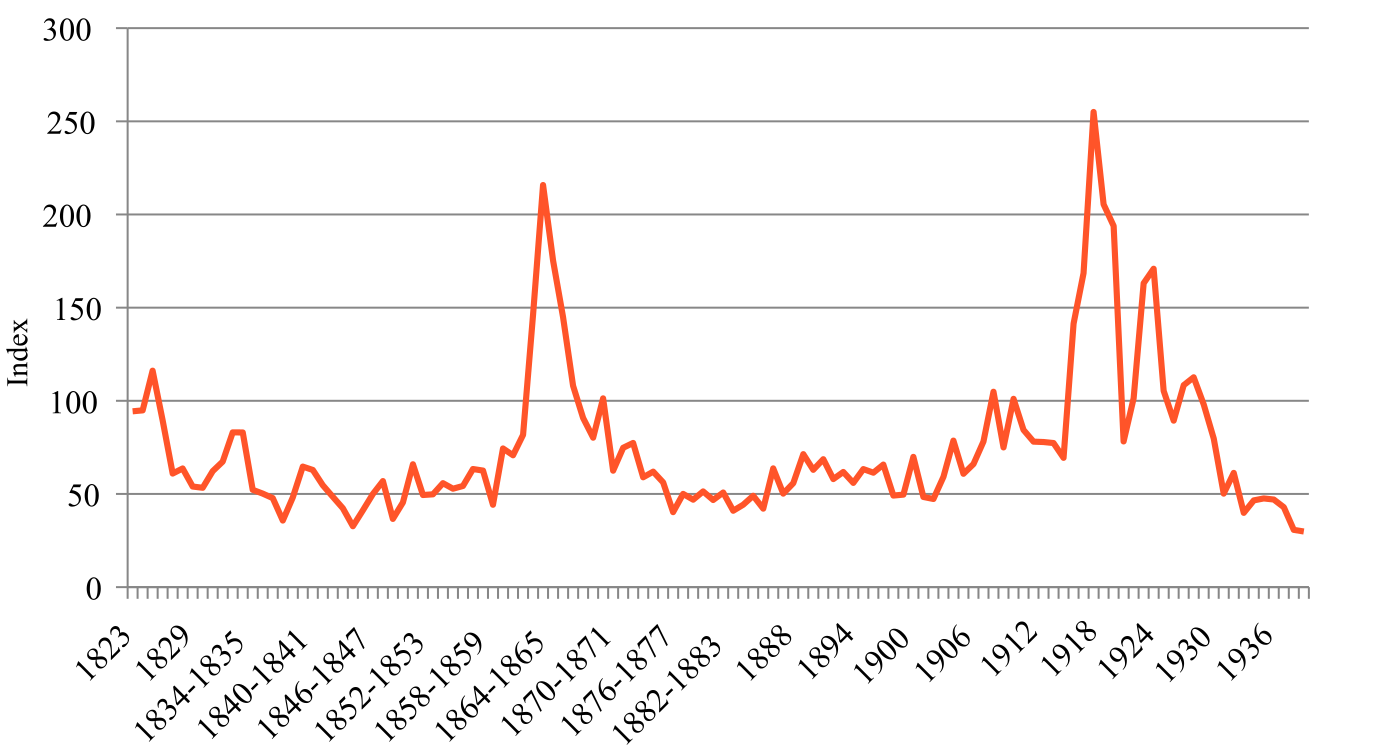
Source: Instituto Brasileiro de Geografia e Estatística (1939/1940).
Graph 3 Average value of Brazilian exports of cotton in gold pounds (1821-1823=100)
Average prices for Brazilian cotton exports doubled between 1860-1861 and 1865-1866 and exports tripled between 1850 and 1860 and its share of the Liverpool market increased from approximately 5% to 12% of all cotton imports. At the same time the share of cotton in total Brazilian agricultural exports increased in value from 6% to 18% in the same period. But with the end of the Civil War, the price gradually decreased. In 1870/71 prices returned to pre-war levels, putting an end to the euphoria of the cotton boom for Brazil. Nevertheless São Paulo, now had become an important producer and exporter, and by the 1870s was the second largest exporter after Pernambuco and accounted for a fifth of production. An 1875 Brazilian survey of imperial cotton production found that São Paulo production yielded extraordinary profits.13
Cotton production in the state of São Paulo was different from the Northeast not only in the type of cotton grown, but also in the form of its organization. The small farms which dominated São Paulo production in the 19th and 20th century, were primarily cotton producers and only produced food for local consumption. Moreover, landowners and workers both participated in its profits through land rentals or sharecropping. All agree that this system encouraged a large labor force to participate in growing and harvesting the crop, and enabled poor workers to share in the profits of production. This proved to be a highly efficient system beneficial to both farmers and landowners, but it could lead to conflict over contracts.14 For all local producers, the internal market now became fundamental due to the rapid expansion of the national textile industry (Canabrava, 1984, pp. xi-xiv ). Not only was the growing national market satisfied, but enough cotton was exported that even by 1871-1872, the value of imported cotton cloth, which came mostly from England and France, was close to the value of the raw cotton exported.15
The demand for local cotton increased steadily due to the rapid growth of the national textile industry in the late 19th and early 20th century. By the time of the 1920 industrial census there were 266 cotton spinning and weaving factories in Brazil, employing 92 000 workers (Ministerio da Agricultura, Industria e Commercio, Directoria Geral de Estatistica, 1924a, vol. v, 1ª, pp. xvi-xxii, xxiv, lxxii, lxxiii ). Considering all fabric manufacturing establishments, there were 319 that year, of which 112 were in São Paulo. Cotton was the dominant cloth produced, with wool and linen fabrics of lesser importance.16 Moreover the two types of cotton crops in the two different centers, were still produced. As late as 1920 the Northeast still accounted for 63% of cotton output. However short strand upland cotton from São Paulo became important for local industry as both São Paulo and the traditional Northeastern states now primarily serviced national industry. But exports never stopped in this entire period.
Phase 2
The period from 1920-1999 represented a new period of growth and also of effective modernization of Brazilian cotton production, but ended in the worst crisis in the history of Brazilian cotton. It was in this period that earlier research led to the creation of new seed varieties and São Paulo cemented its position as the dominant cotton producer as it began to replace coffee on large estates. There was also a second international boom in cotton exports in the 1920s due to rising prices which reflected the recovery of international demand after the crisis of World War I. Some 24 000 tons of cotton were exported, corresponding to 5% of Brazilian exports. But in that same year, the local market already consumed a large share of national cotton production. It has been estimated that from 1900 to 1925 the national cotton textile industry doubled every decade. National cotton textiles production was 33 000 000 meters of cloth in 1900, 75 000 000 meters 1910 and 186 000 000 by 1920. The 17 factories in 1900 increased to 54 factories in 1920 and 64 in 1925. In this same period workers in these factories went from 4 570 in 1900 to 38 000 in 1925, and the looms increased from 2 838 to 20 560 (Pestana, 1926, pp. 63-65, 89-90). In 1920 the production of 332 000 tons of seed cotton (algodão em caroço), which consists of seed and lint before cleaning, would produce about 113 000 tons of cotton lint, of which only 24 000 tons were exported, and the rest was destined for the internal market. 17 São Paulo was by this date the unquestioned dominant producer of cotton, followed by Pernambuco (see table 4).
Table 4 Production of cotton by state by number of cotton farms, their size and output, 1920
| States | No of farms | Hectares cultivated | Quantity produced (tons) | Kilos of cotton per hectare | Average area of cotton farms | Average production (kg) |
|---|---|---|---|---|---|---|
| São Paulo | 19 764 | 109 788 | 104 584 | 953 | 5.6 | 5 292 |
| Pernambuco | 10 406 | 70 013 | 61 978 | 885 | 6.7 | 5 956 |
| Paraíba | 9 944 | 49 007 | 35 797 | 730 | 4.9 | 3 600 |
| Ceará | 2 811 | 30 762 | 29 426 | 957 | 10.9 | 10 468 |
| Rio Grande do Norte | 2 062 | 15 798 | 18 344 | 1 161 | 7.7 | 8 896 |
| Bahia | 3 886 | 18 508 | 15 910 | 860 | 4.8 | 4 094 |
| Alagoas | 5 225 | 16 474 | 15 634 | 949 | 3.2 | 2 992 |
| Sergipe | 4 021 | 16 053 | 14 593 | 909 | 4.0 | 3 629 |
| Maranhão | 2 401 | 22 633 | 13 616 | 602 | 9.4 | 5 671 |
| Minas Gerais | 11 690 | 10 429 | 8 667 | 831 | 0.9 | 741 |
| Piauí | 2 486 | 5 902 | 5 315 | 901 | 2.4 | 2 138 |
| Pará | 8 380 | 6 870 | 4 036 | 588 | 0.8 | 482 |
| Paraná | 482 | 2 165 | 1 782 | 823 | 4.5 | 3 696 |
| Goiás | 5 117 | 1 023 | 925 | 904 | 0.2 | 181 |
| Rio Grande do Sul | 422 | 1 222 | 610 | 499 | 2.9 | 1 445 |
| Santa Catarina | 2 068 | 727 | 372 | 511 | 0.4 | 180 |
| Rio de Janeiro | 45 | 501 | 302 | 602 | 11.1 | 6 707 |
| Espírito Santo | 339 | 437 | 263 | 601 | 1.3 | 775 |
| Mato Grosso | 162 | 132 | 80 | 604 | 0.8 | 492 |
| Amazonas | 42 | 86 | 52 | 602 | 2.0 | 1 233 |
| Território do Acre | 31 | 63 | 51 | 810 | 2.0 | 1 645 |
| Distrito Federal | 1 | 6 | 4 | 600 | 6.0 | 3 600 |
| Total Brasil | 91 785 | 378 599 | 332 338 | 878 | 4.1 | 3 621 |
| Nordeste total | 43 242 | 245 150 | 210 613 | 859 | 5.7 | 4 871 |
Source: Ministerio da Agricultura, Industria e Commercio, Directoria Geral de Estatistica (1924b).
As of the 1920 census there existed 92 000 cotton farmers, with a planted area of 379 000 hectares, representing 6% of the cultivated area that year. The production was 332 000 tons of cotton seed and the average was 878 kilograms of cotton lint produced per hectare and the average area cultivated was just 4.1 hectares. Cotton represented 16% of the value of the production of agricultural crops, against 25% for coffee and 24% for corn (Ministerio da Agricultura, Industria e Commercio, Directoria Geral de Estatistica, 1924b, p. xix ). By now the state of São Paulo led in national cotton production, with 20 000 farmers growing cotton on 102 000 hectares producing 105 000 tons of cottonseed. This represented about one third of national production, with average productivity per hectare similar to the Brazilian average. The second state in terms of production was Pernambuco, followed by Paraíba and Ceará. Together, the northeast was still the most important region, representing two thirds of production with an average cultivated area of 5.7 hectares.
A major transformation in cotton cultivation would occur after the crisis of the 1930s, which would be carried out mainly in São Paulo. The crisis of coffee production in the 1930s would result in the coffee economy losing its dynamism and resulted in territorial displacement of coffee production within the state and to other states. At the same time, there were major changes in land ownership and use in the state, with an important process of subdivision of properties (Albuquerque, 1981, p. 180; Gonçalves and Ramos, 2008, pp. 28-29).
There were also important advances in the production process. Since the early years of the 20th century, studies were developed to improve cotton cultivation, particularly at the Instituto Agronômico de Campinas (iac), a research institution of the government of the State of São Paulo which had been created in 1887.18 It soon became one of the most important centers of research in Brazil, with a fundamental role in the development of crops in general, but especially with coffee and cotton. The institute began working on cotton in 1907 and its work intensified after the creation of the Cotton Section in 1922 which would be responsible for new seed development (Albuquerque, 1981, pp. 137-138; Albuquerque, Ortega, and Reydon, 1986, pp. 79-132; Junqueira, 1936, pp. 8-9; Neto and Freire, 2013, pp. 49-83).
In this post 1930 period there was also an integration of agronomic research, seed production and distribution services, technical assistance and the fiber market. Research programs until 1970 were aimed at improving fibers, increasing productivity and resisting diseases and the maturity of the fiber and an increase in its productivity. There were also new research centers created or older ones now devoted to cotton studies. Thus, the Instituto Agronômico de Campinas launched the improved seeds known as iac-17 and iac-18 which resulted in an average increase in productivity on the order of 30%. The Northeast also received greater attention in the development of cotton technology adapted to the region after the installation of the National Cotton Research Center of Embrapa –the Brazilian Agricultural Research Corporation– in Campinas Grande in Paraíba in 1975. Embrapa was a government created agricultural research organization which would become the largest such center in the tropical world and was fundamental in the modernization of all aspects of Brazilian agriculture (Beltrão, 2003, p. 14; Freire, Moreira and Medeiros, 1980, pp. 383-413).
In addition to the use of cotton to produce the fiber used for yarn production, in the 20th century seed began to be used industrially in Brazil for the production of vegetable oil. Before World War I the country exported the seed and imported cottonseed oil in a volume of 1 000 000 kilograms per annum, mainly from the United States. Palm oil and linseed oil were also consumed nationally (Ministério das Relações Exteriores, 1941, pp. 189-194). 19 It was in this post war period that cottonseed oil became a major consumption item in Brazil. As in other Latin American countries, the leadership in this industrial process fell to the Bunge group, through Sanbra Sociedade Algodeira do Nordeste Brasileiro S. A., its subsidiary in Brazil. It began to produce cottonseed oil in 1929 which quickly became one of the most consumed food oils in Brazil, until its replacement by soybean oil at the end of the century (Costa and Silva, 2020).
All these changes led to the massive growth of cotton production after 1920. Between 1920 and 1960 the number of cotton farms increased by a factor of five and thereafter maintained a high level of production until the late 1990s. Over this period there was also a shift in Southern production as Paraná increased its participation and by 1980 it would become the largest Brazilian cotton producer. In that year, the Center-West also began to produce cotton. The decline of Northeastern production in this period meant the loss of participation of tree cotton, which was only produced in that region. Arboreal production systematically declined from 35% of production in 1956, to 24% in 1973 and 14% in the 1980 census and its production would practically disappear as of the 1990s (see table 5).
Table 5 Cotton production by state, and region, for area and output, 1920-1996
| 1920 | 1940 | 1950 | 1960 | 1970 | 1980 | 1996 | |
|---|---|---|---|---|---|---|---|
| Number of farms | |||||||
| Brazil | 91 785 | 442 407 | 351 432 | 453 481 | 358 156 | 260 422 | 93 688 |
| Northeast | 43 242 | 286 753 | 245 532 | 342 645 | 205 120 | 193 425 | 54 089 |
| Center-West | 5 279 | 16 053 | 9 306 | 13 497 | 16 951 | 6 508 | 5 455 |
| São Paulo | 19 754 | 100 700 | 72 934 | 54 418 | 49144 | 14 419 | 5 934 |
| Paraná | 482 | 17 220 | 4 439 | 22 822 | 68675 | 34 898 | 20 527 |
| Cultivated area (hectares) | |||||||
| Brazil | 378 599 | 2 412 484 | 2 037 411 | 2 180 800 | 1 485 280 | 1 044 457 | 640 124 |
| Northeast | 245 150 | 885 127 | 1 213 764 | 1 546 399 | 425 569 | 422 056 | 182 918 |
| Center-West | 1 155 | 5 107 | 10 430 | 32 022 | 86 442 | 61 662 | 152 103 |
| São Paulo | 109 788 | 1 416 482 | 719 623 | 408 297 | 531099 | 236 687 | 91 315 |
| Paraná | 2 165 | 24 884 | 27 222 | 131 131 | 373287 | 263 731 | 171 039 |
| Production (in tons) | |||||||
| Brazil | 332 238 | 1 284 895 | 769 528 | 956 249 | 1 261 704 | 1 170 597 | 816 743 |
| Northeast | 210 613 | 392 059 | 295 377 | 356 209 | 100 923 | 124 634 | 78 763 |
| Center-West | 1 005 | 2 637 | 4 026 | 18 139 | 114 540 | 106 385 | 269 439 |
| São Paulo | 104 564 | 840 598 | 445 559 | 442 046 | 610 222 | 433 388 | 150 967 |
| Paraná | 1 782 | 27 785 | 18 695 | 112 903 | 397 063 | 452 490 | 267 433 |
| Share of State in total production (pergentage) | |||||||
| Northeast | 63 | 31 | 38 | 37 | 8 | 11 | 10 |
| Center-West | 0 | 0 | 1 | 2 | 9 | 9 | 33 |
| São Paulo | 31 | 65 | 58 | 46 | 48 | 37 | 18 |
| Paraná | 1 | 2 | 2 | 12 | 31 | 39 | 33 |
Sources: Instituto Brasileiro de Geografia e Estatística (1920/1999).
Even as Brazil turned more inward in its cotton production, it remained a significant world producer. In the 1960s and 1970s, Brazil was the fifth largest cotton producer in the world and also the fifth largest exporter of cotton lint. At that time, the country had more than 12% of the world area planted in cotton with more than 3 600 000 hectares and almost half of the population of the Northeast directly or indirectly, lived off cotton and its by-products. Not only in the semi-arid Northeast, but also in other producing regions, cotton farming was the least risky agricultural activity. The cultivation of cotton, whether rain fed or irrigated, single or intercropped, required between 0.3 to two employees per hectare depending on the exploitation regime. In the Northeastern semiarid, in the drier areas, cotton was not an option, but was in fact the only crop capable of generating income (Beltrão, 2003, pp. 14-15).
The 1980 census contains detailed information on the productive structure of cotton. In that year there were more than 500 000 producers, distributed in a relatively equal way among those dedicated to tree and herbaceous cotton. This was roughly the same number of producers as in the agricultural census of 1960, although the Northeastern region then accounted for two thirds of the cotton farmers (Instituto Brasileiro de Geografia e Estatística, 1960, p. 52, table 36b). Although the area dedicated to tree cotton as late as 1980 accounted for two thirds of the total area cultivated with cotton, its production represented only 12% of the total, showing a brutal difference in land productivity, and probably labor productivity as well. Given the low costs of entry into even herbaceous cotton production, in São Paulo and Paraná a third of cotton farmers were tenants and sharecroppers, a percentage higher than in the Northeastern states (Salinas, 2009). In the Northeastern states arboreal cotton production was intercropped with livestock in about a third of farms, compared to only one fifth of the herbaceous cotton growers who also produced livestock. In both types of cotton there were a large proportion of small farms, but there was a great difference between the arboreal and herbaceous cotton crops in output. The average production per producer was eight times higher in the herbaceous; considering the production per hectare the proportion increased to twelve times (see table 6).
Table 6 Characteristics of Herbaceo and Arbóreo cotton farms in 1980
| Arbóreo Cotton | Herbáceo Cotton | |||||
|---|---|---|---|---|---|---|
| Farms | Production | Area | Farms | Production | Area | |
| Total | 271 371 | 156 156 | 1 655 595 | 260 422 | 1 170 597 | 1 044 457 |
| Status of producer (percentage) | ||||||
| Owner | 71 | 83 | 85 | 60 | 63 | 67 |
| Renter | 6 | 4 | 3 | 19 | 23 | 19 |
| Sharecropper | 7 | 5 | 5 | 6 | 10 | 8 |
| Squatter | 16 | 8 | 7 | 15 | 3 | 6 |
| Destiny of production (percentage) | ||||||
| For coop | 5 | 14 | 14 | 4 | 13 | 11 |
| For industry | 4 | 14 | 15 | 10 | 46 | 32 |
| For intermediary | 84 | 70 | 69 | 82 | 40 | 55 |
| Economic activity of producer (percentage) | ||||||
| Agriculture | 69 | 77 | 67 | 80 | 95 | 88 |
| Ranching | 24 | 14 | 23 | 15 | 2 | 8 |
| Agriculture & Ranching | 5 | 8 | 8 | 4 | 2 | 4 |
| Size of farms producing cotton (percentage) | ||||||
| Less than 10 ha | 40 | 15 | 10 | 59 | 15 | 22 |
| 10 -100 ha | 49 | 47 | 44 | 35 | 50 | 47 |
| 100- 1 000 ha | 11 | 33 | 38 | 6 | 28 | 26 |
| 1 000 -10 000 ha | 1 | 5 | 8 | 0 | 6 | 6 |
| 10 000 ha or more | 0.0 | 0.1 | 0.2 | 0.0 | 0.1 | 0.1 |
| Area cultivated in cotton (percentage) | ||||||
| Less than 1 hectare | 16 | 4 | 1 | 38 | 1 | 4 |
| 1-2 | 20 | 7 | 4 | 21 | 3 | 7 |
| 2-5 | 31 | 19 | 15 | 24 | 13 | 19 |
| 5-10 | 14 | 18 | 15 | 9 | 15 | 16 |
| Less than 10 hectarers | 81 | 48 | 36 | 92 | 32 | 45 |
| 10-100 ha | 14 | 43 | 48 | 7 | 48 | 41 |
| 100-500 ha | 0 | 8 | 13 | 0 | 15 | 11 |
| 500+ ha | 0 | 1 | 3 | 0 | 5 | 3 |
Source: Instituto Brasileiro de Geografia e Estatística (1980, vol. 2, t. 3).
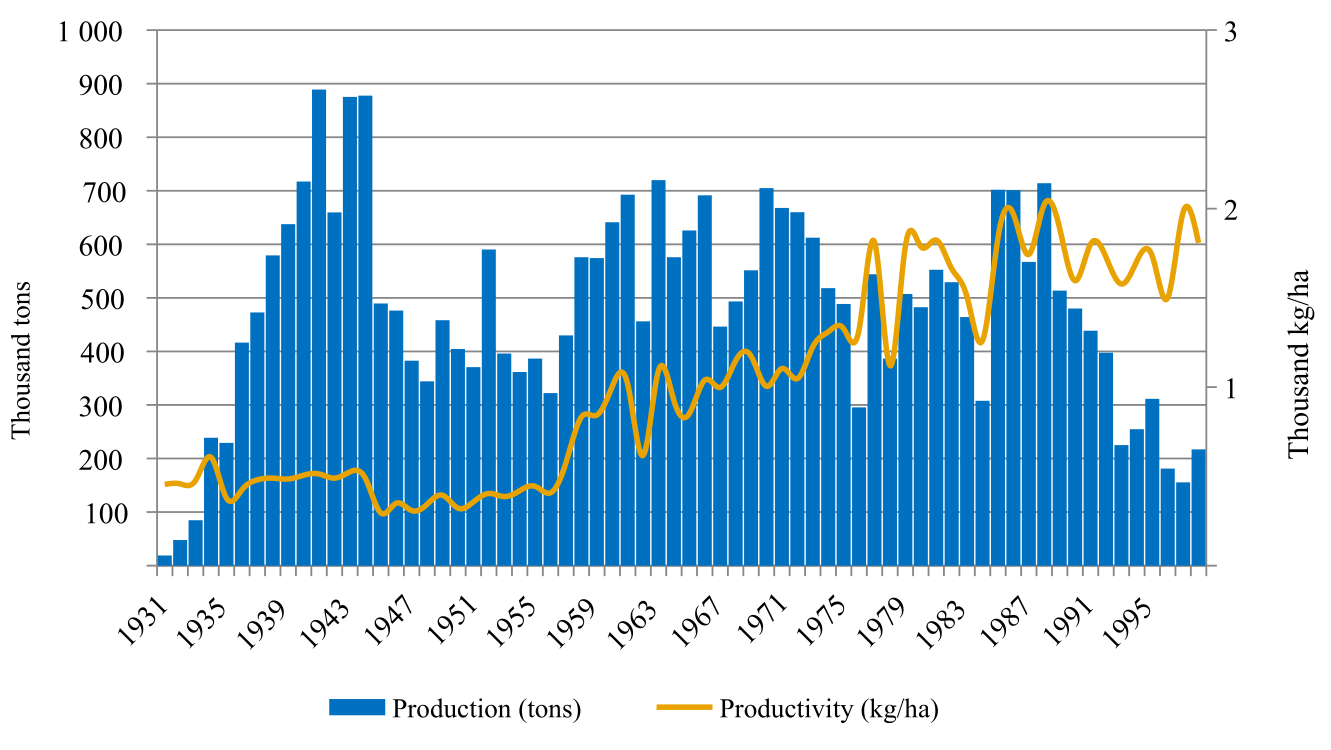
The evolution of the harvested area in cotton in the state of São Paulo is impressive. Modest at the beginning of the 1930s, it rose to above 1 000 000 hectares in the 1940s and 1950s and accounted for almost a third of all cultivated lands in the state, and gradually decreased thereafter reaching under 400 000 hectares by the late 1980s and absorbing only around 5% of cultivated lands in the state. However significant increases in productivity by area, allowed the state to maintain an average annual production on the order of 500 000 tons throughout the decades of the 1940s to the 1980s, even with the effects of the boll weevil after 1983 (see graph 4).
The second half of the 1980s and the decade of the 1990s was a period of acute crisis in national cotton culture. In the mid-1980s, the boll weevil plague spread. First identified in São Paulo and Paraíba in 1983, it appeared in Paraná the following year. Two harvests after its first appearance, the insect appeared in all the main cotton producing areas. As it was a well-known pest, and with control methods already developed in other countries, containment or even eradication plans were developed, but the operational limitations and the social and economic consequences of a radical plan made its execution unfeasible (Braga Sobrinho and Lukefahr, 1983; Miranda and Rodrigues, 2015, pp. 9-46; Pimentel et al., 1983). By the 1983-1984 harvest, there was a decline in areas planted with cotton and a significant decline in productivity (Azambuja and Degrande, 2014; Campanhola, Martin, and Schattan, 1988). Although the boll weevil represented an extraordinary event in the trajectory of cotton cultivation, it ultimately had a limited effect on Brazilian production. Thus, if we compare the average production of the five years before 1983 and the five years after, there was an increase in the average annual production by 30%. Yet in the following years there would be a profound crisis in Brazilian cotton culture, which lasted until the end of the 20th century. Not only did production decline, but exports virtually disappeared in the 1970s and again in the 1990s, such that Brazil was forced to import cotton to satisfy national consumption (see graph 5).
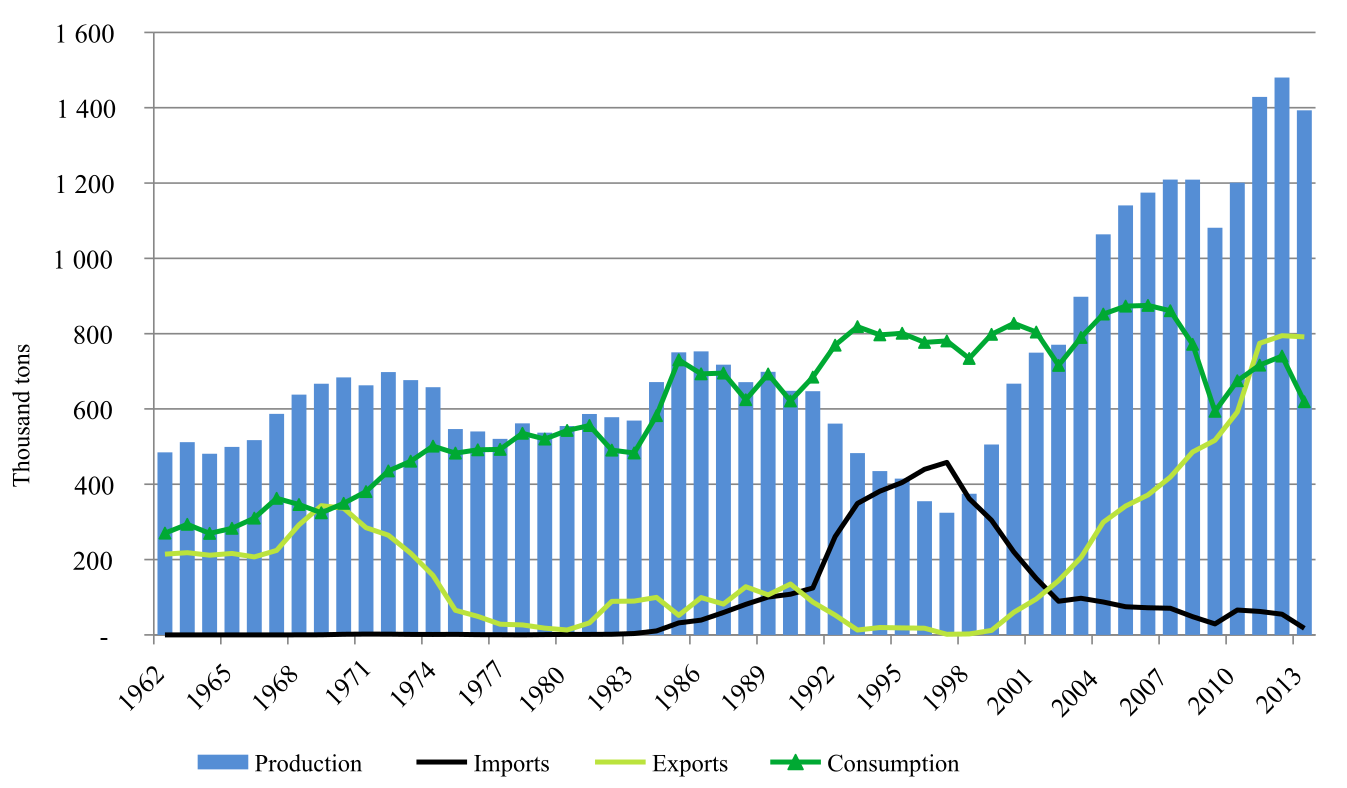
Note: Consumption = production + imports − exports.
Source: Food and Agriculture organization of the United Nations (2022, years 1961-2019).
Graph 5 Brazilian production, importation, exportation and apparent consumption of cotton lint, 1961-2019 (three year moving average)
The key cause for this collapse was a change in government policies with the adoption of the Washington consensus and the abolition of all protective tariffs on agricultural imports. Thus, from the decade of the 1980s to the decade of the 1990s Brazil went from being a net exporter to a major importer of cotton. This occurred when the world stocks of cotton were elevated and world prices were low. In addition to the cheaper foreign product, and the removal of tariffs, the financing conditions (in terms and interest) for the purchase of cotton in the international market were developed within Brazil. In 1988, as a protection and stimulus mechanism for the national textile industry, there was a reduction in the tariff on imported cotton from 50% to 10%, and the tariff was eliminated altogether in 1990. This abruptly exposed the domestic production of cotton to foreign competition, which at the time was abundant and even subsidized by the North American government. Finally, the terms of credit offered for financing cotton imports were better than those available for financing national production (Gonçalves and Ramos, 2008, p. 37). The prices received by the farmers, which were already declining, fell even further. At deflated prices there was a 50% drop between the average price paid for cotton between the 1980s and the 1990s.
The result of these changes was a dramatic decline in Brazilian cotton production. Cultivated area went from over 2 000 000 hectares in the last five years of the 1980s, to just 800 000 hectares between 1995 and 1999. The same occurred with the production of seed cotton which declined in half in the same period (see graph 6). 20 Although the effects were felt in all regions, the Northeast was particularly affected. By the end of the decade of the 1990s average production was only a quarter of the average of the 1980s. It has been estimated that between 1985 and 1989 cotton farming generated about 2 100 000 jobs; ten years later employment in the sector would be just 736 000 workers, of which 278 000 were in the Northeast. Unlike the Sothern states, there was no alternative economic activity to replace cotton in the states of the Northeast. The effects on the countryside, cities, personal income and public finances were dramatic (Biehl and Zandonadi, 1998, p. 12; Santos and Barros, 2000).
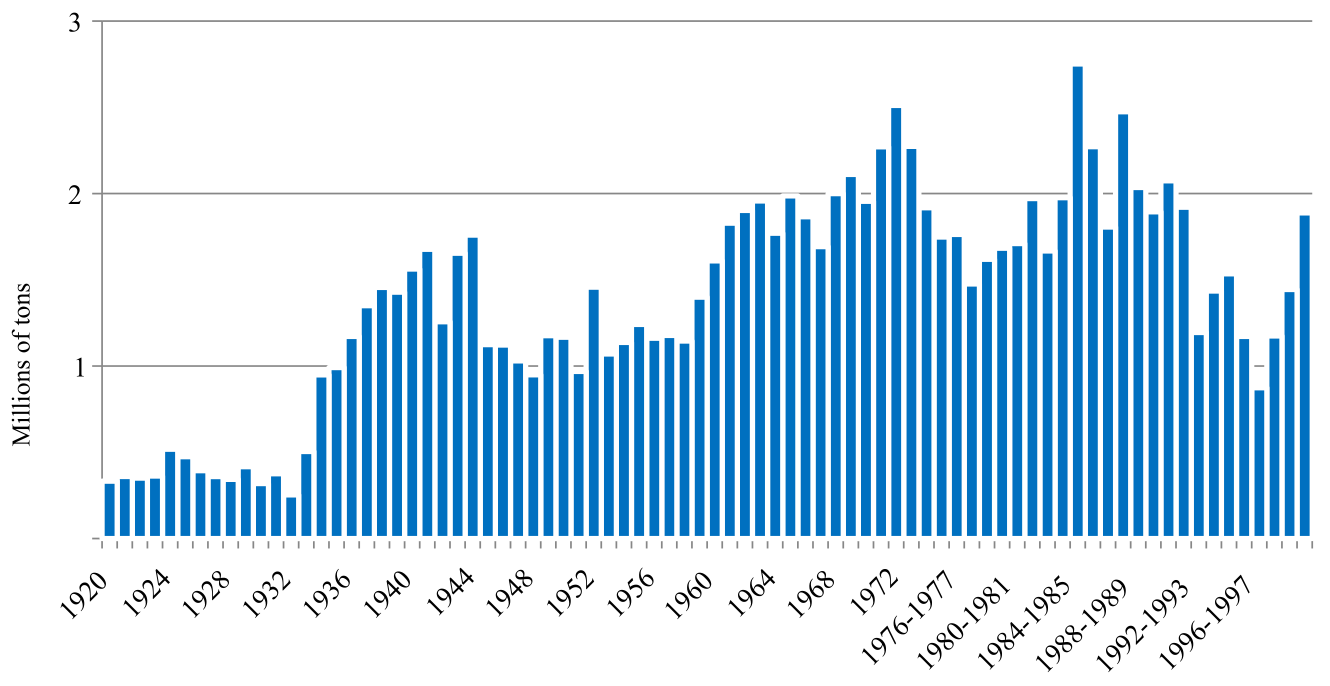
Sources: Instituto Brasileiro de Geografia e Estatística (1920/1999); Companhia Nacional de Abastecimento (2020c).
Graph 6 Brazilian production of seed cotton, 1920-1999
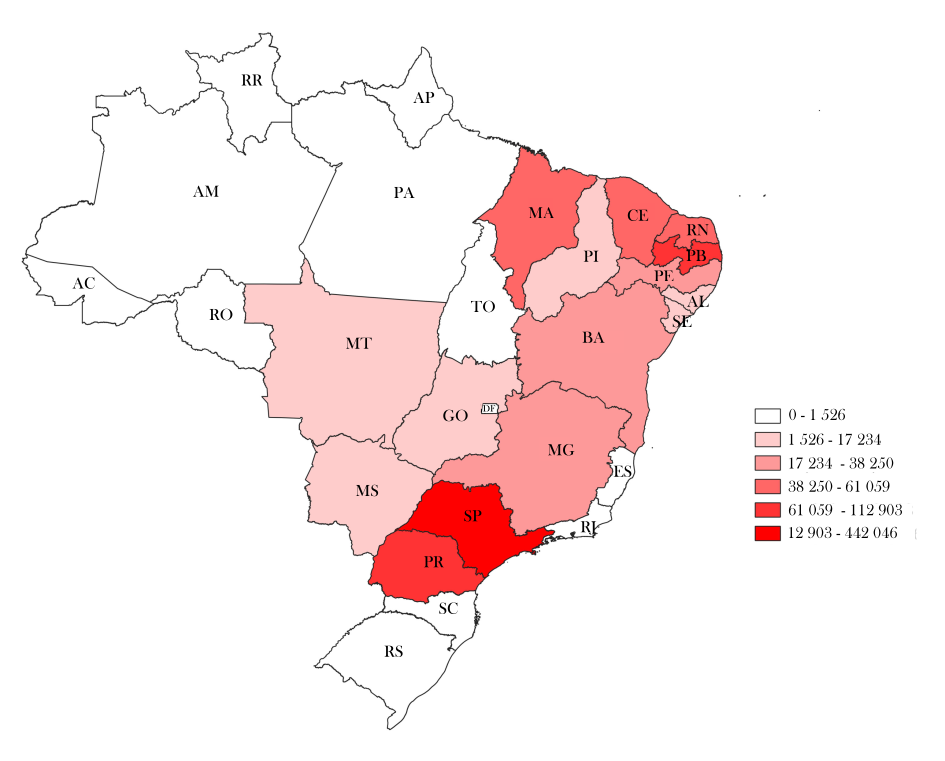
Source: Instituto Brasileiro de Geografia e Estatística (1960).
Map 1 Cotton production by state, 1960
Phase 3
If the opening of the economy, which integrated domestic prices with foreign prices, was initially a negative factor in Brazilian cotton agriculture, it started to represent a stimulus for continuous increases in productivity. Nevertheless, the development in new cultivation practices, new regional production centers, and the expansion of production of all crops had an impact on cotton production as well. 21 The new large-scale production structure of the Brazilian Cerrado region stimulated systematic increases in productivity for cotton, which had an important domestic market, but slowly allowed for the penetration into the international market as local producers could now compete with international ones. Thus, the average productivity of cotton kept increasing from the early 1990s. By 2000-2002 it had increased two and a half times above the earlier period and increased another 30% in the following decade (Food and Agriculture organization of the United Nations, 2000-2002). So rapid was this increase in productivity, that Brazilian yields of seed cotton per hectare, which in 1980 was only 40% of that obtained in the United States, passed that of the United States in 1999 and is currently about 36% higher than that of the United States (see graph 7).
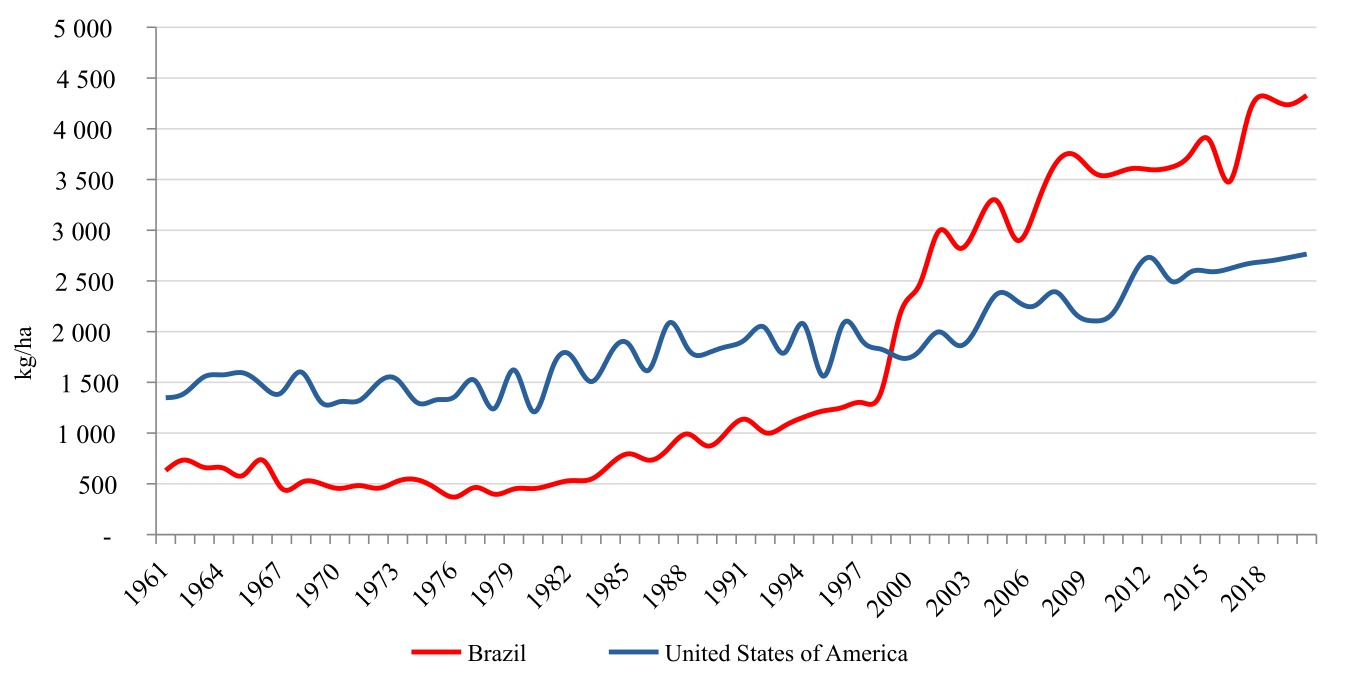
Source: Food and Agriculture organization of the United Nations (2022).
Graph 7 Productivity of seed cotton production Brazil and the USA, 1961-2020 (kg/ha)
Furthermore, Brazil benefited from the exceptional increase in prices that started in the first decade of the 21st century and intensified in the following decade (Alves, Barros and Bacchi, 2008; Coelho, 2004). Thus, planters were more than able to expand production as the local cotton prices began to expand in this period (see graph 8).
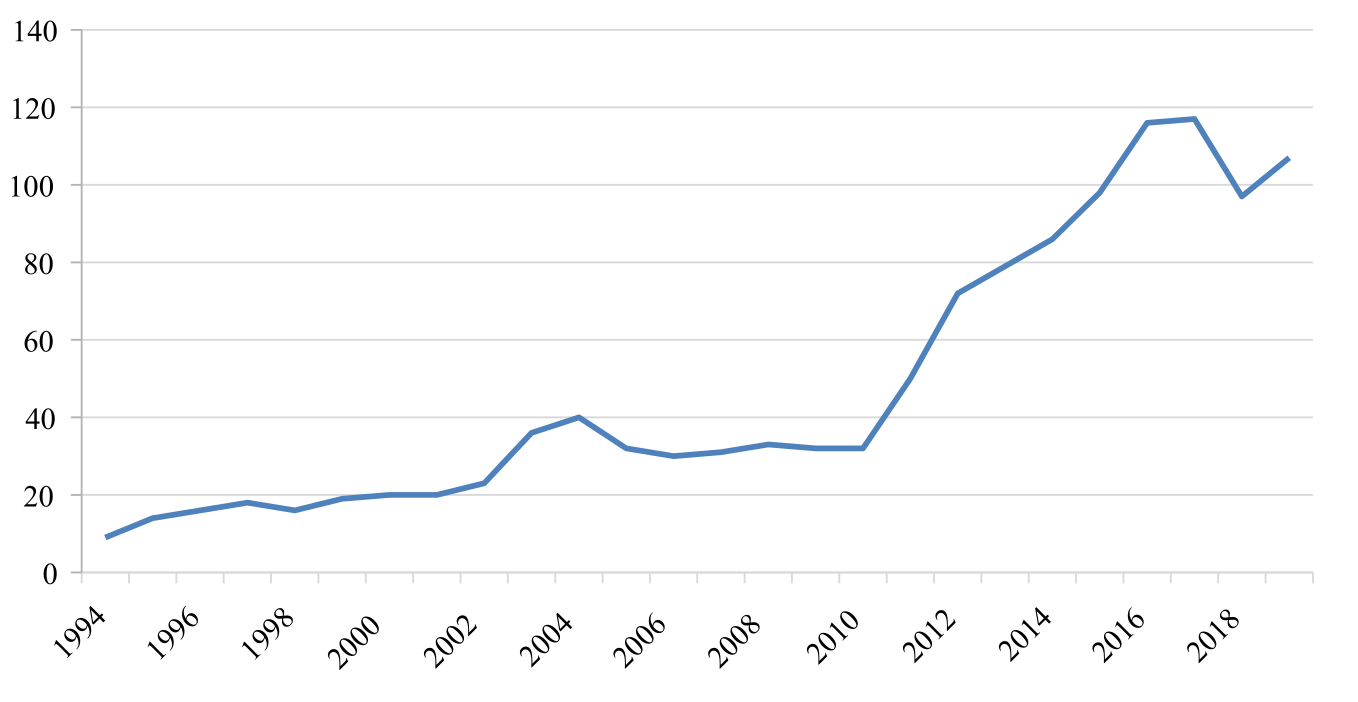
Source: Food and Agriculture organization of the United Nations (2022).
Graph 8 Index of producer price of cotton lint in Brazil, 1994-2019 (100=2014-2016)
The causes of this exceptional performance can be credited to such advances as no-tillage farming and the introduction of genetically modified seeds. Also, such new lands as the Cerrado were opened up to cotton production and the Embrapa Cotton Research Center played a fundamental role making this possible in encouraging cotton production in the Cerrado (Lirbório, 2017, pp. 152-153). Cotton is one of the crops with the highest incidence of pests, so a fundamental issue was the management of pest control, with several of these plagues, such as the boll weevil, endemic. Pest control can represent 30% of the total production cost, due to the need for numerous sprayings (Xavier, 2018, p. 21). This explains why the first genetically modified organisms introduced in Brazil were aimed at resistance to pests or resistance to the main pesticides used in cotton cultivation (Goodman, Sorj, and Wilkinson, 1990, p. 33). Although previously introduced in other countries, the first approval of genetically modified seeds for commercial use in Brazil occurred in 2005. By 2019 there were 22 transgenic cotton seeds approved for sale in Brazil, the majority tolerant to insects and herbicides (Informativo de biotecnologia Céleres, 2019). In the latest harvest, the area planted with transgenic cotton, represented about 90% of the area planted in cotton, a ratio similar to the corn and soybean crops. Here as well multinationals dominate the market for genetically modified seeds (Xavier, 2018, p. 49). Nevertheless, Embrapa still plays a fundamental role and has even allied with the Monsanto Company to carry out genetic improvements of cotton lines and cultivars containing Monsanto’s technology using Embrapa’s germplasm, which allowed Embrapa to launch new cotton cultivars on the market (Lirbório, 2017; Xavier, 2018, p. 58, 151) .
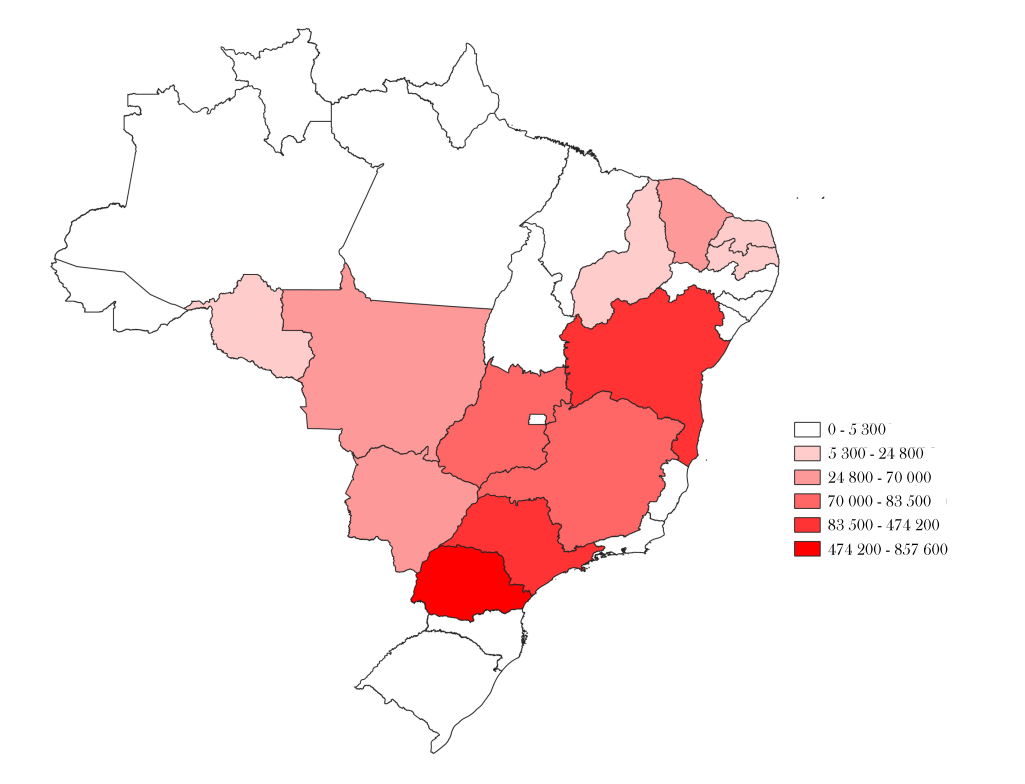
Cotton farming is now centered in the Cerrado region where it grown almost exclusively on large farms. Average productivity per hectare in the Cerrado has multiplied by four compared to the early 1990s. Cotton within the Cerrado district was predominantly in Mato Grosso and in the Northeastern savanna areas of the Cerrado which are mainly in Bahia (see map 3). Today, these two states grow 90% of the national cotton production, 73% in the state of Mato Grosso and 17% in western Bahia (Companhia Nacional de Abastecimento, 2020a). The states of São Paulo and Paraná, previously important producing centers, currently have a marginal position in the market. Even within the two leading states of Mato Grosso and Bahia, there is also a high concentration of production in a few municipalities (see table 7).
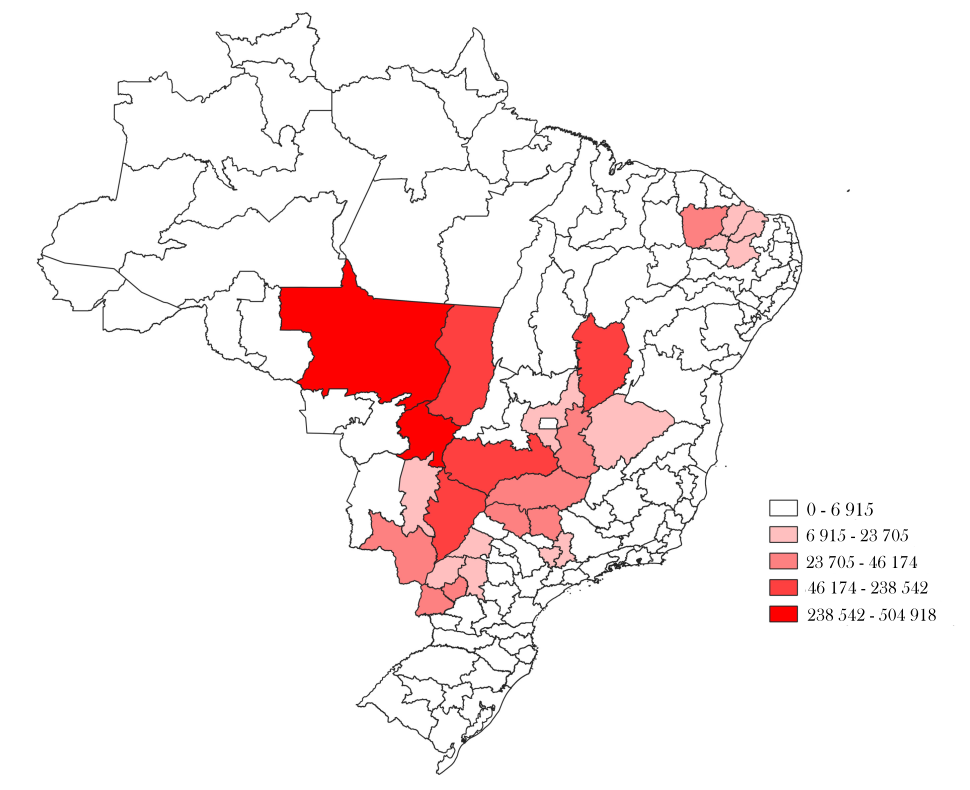
Table 7 Production in tons of the principal cotton municipalities in Mato Grosso and Bahia, 2019
| Mato Grosso | Bahia | ||
|---|---|---|---|
| Total Estado | 4 652 784.00 | Total do Estado | 1 493 474.00 |
| Sapezal | 894 794 | São Desidério | 592 700 |
| Campo Novo do Parecis | 454 315 | Formosa do Rio Preto | 207 241 |
| Campo Verde | 415 800 | Barreiras | 155 509 |
| Diamantino | 277 468 | Correntina | 153 354 |
| Campos de Júlio | 255 911 | Riachão das Neves | 129 919 |
| Primavera do Leste | 202 710 | Jaborandi | 100 444 |
| Lucas do Rio Verde | 179 789 | Luís Eduardo Magalhães | 94 955 |
| Sorriso | 179 029 | ||
| Nova Mutum | 137 683 | ||
| Tapurah | 129 600 | ||
| Paranatinga | 120 859 | ||
| Nova Ubiratã | 107 776 | ||
| Santo Antônio do Leste | 95 400 |
Source: ibge, sidra tabela 1612. Produção Brazil production = 6 893 340 tons.
Total production of seed cotton in the last five harvests of the 20th century was around 1 000 000 tons, in the following two decades rose to more than 3 000 000 tons in the 2000s and to 4 800 000 tons in the following decade. The harvest forecast for the year 2021-2021 is approximately 7 000 000 tons (Companhia Nacional de Abastecimento, 2022). Although there was an increase in planted area, from approximately 823 000 hectares in the 2000-2001 harvest to 1 600 000 hectares in the 2021-2022 harvest, it was the exceptional increase in productivity that explains this increase in volume of production.
The dominance of large producers can be seen in the latest 2017 agricultural census. Whereas there were over 500 000 small producers of cotton in 1980, the elimination of tree cotton producers in the Northeast region and the total mechanization of the crop everywhere else had drastically reduced the number of producers by the latest agricultural census. There were only 3 211 cotton producers in Brazil registered in 2017. This compares to 1 600 000 corn producers, 315 000 bean producers, 236 000 soybean producers and 35 000 wheat farmers. Although there are small cotton farms of under 100 hectares, their participation is negligible. In fact, if we consider only the 95 establishments with more than 10 000 hectares, their production accounts for 62% of total cotton output, clearly demonstrating the new characteristic of the cotton producer in Brazil in this third period (see table 8).
Table 8 Main factors of cotton production in Brazil, Mato Grosso and Bahia, Agricultural Census of 2017
| Brasil | Mato Grosso | Bahia | ||||||||||
|---|---|---|---|---|---|---|---|---|---|---|---|---|
| Size of cotton farms | Farms | Production in tons | Value in 1000 réis | Area cultivated ha | Farms | Production in tons | Value in 1000 réis | Area cultivated ha | Farms | Production in tons | Value in 1000 réis | Area cultivated ha |
| Less than 10 ha | 1 597 | 710 | 1 192 | 1 300 | 872 | 411 | 668 | 859 | ||||
| 10-20 ha | 490 | 369 | 602 | 603 | 268 | 184 | 292 | 356 | ||||
| 20-50 ha | 460 | 743 | 1 487 | 763 | 208 | 416 | 755 | 427 | ||||
| 50-100 ha | 156 | 845 | 1 352 | 807 | 58 | 327 | 584 | 484 | ||||
| 100-200 ha | 60 | 2 933 | 11 414 | 1 150 | 3 | 1 350 | 7 257 | 300 | 21 | 195 | 360 | 295 |
| 200-500 ha | 42 | 10 180 | 36 769 | 2 833 | 7 | 4 926 | 17 293 | 1 148 | 6 | 379 | 731 | 323 |
| 500-1 000 ha | 46 | 81 026 | 318 691 | 21 010 | 27 | 71 421 | 281 374 | 18 158 | 1 | - | - | - |
| 1 000-2 5000 ha | 106 | 267 735 | 867 202 | 70 103 | 70 | 214 723 | 686 829 | 53 687 | 9 | 17 228 | 56 047 | 5 340 |
| 2 500-10 000 ha | 159 | 1 041 086 | 2 122 574 | 268 891 | 85 | 641 554 | 1 228 479 | 168 665 | 44 | 237 389 | 532 327 | 59 638 |
| 10 000+ ha | 95 | 2 341 478 | 4 116 704 | 544 942 | 51 | 1 463 702 | 2 610 155 | 354 617 | 28 | 647 621 | 1 080 654 | 135 918 |
| Total | 3 211 | 3 747 105 | 7 477 987 | 912 402 | 243 | 2 397 676 | 4 831 387 | 596 575 | 1 515 | 904 150 | 1 672 418 | 203 640 |
Sources: ibge, sidra table 6959; Instituto Brasileiro de Geografia e Estatística (2017).
Currently, Mato Grosso accounts for more than two thirds of both the cultivated area and cotton production in Brazil. In this state cotton is usually grown as a second crop, with millet or soybeans as the first crop, and currently about 85% of the cotton cultivated area is second crop (Bélot and Vilela, 2020, p. 13). The use of genetically modified varieties in Mato Grosso started around 2008, with Monsanto’s RR (roundup ready) and BG (bollgad) technologies. Then in the 2010-2011 crop were used the liberty link varieties, resistant to the herbicide glufosinate ammonium, widely applied in the control of weeds resistant to conventional herbicides. But this technology has been replaced for WideStrike and RF (roundup ready flex), resistant to glufosinate and glyphosate. Currently, with the appearance of the Helicoverpa armigera caterpillar in the last years, second generation biotechnologies have been introduced. 22 The correct technological package is essential, as seeds, fertilizers and pesticides represent more than 80% of the crop expenses (Companhia Nacional de Abastecimento, 2020b). Another key issue is soil management. Second cycle cotton is increasingly practiced after early soybean plantings. To ensure the long-term sustainability of the activity, it is important to use more alternative crops as well as no-till practices, which favor crop rotations and the use of cover crops (Bélot and Vilela, 2020, pp. 56-57; Santos, 2019). That Brazil has so far succeeded in this enterprise is seen in the fact that in the harvest of 2019-2020 it produced five times more cotton lint on less than half the hectares than it did in 1976 (Companhia Nacional de Abastecimento, 2020c).
One of the advantages of Brazilian cotton production its adaptability to cultivation without irrigation, particularly in the Cerrado biome that has regular rainfall, suitable for rain fed irrigation. In the 2016-2017 harvest, for example, 96% of production occurred in crops without irrigation and Brazil has the highest ratio of production per hectare in non-irrigated crops compared to all the other major producers of cotton in the world.23
In the past few years there has been a major shift in production technology with a move to planting genetically modified seeds and adopting no-till agriculture. The change in the production costs between traditional and the new technology production can be seen in two of the most important cotton producing municipalities, Campo Novo de Perecis in the state of Mato Grosso, and Barreiras in the state of Bahia (see table 9). In the harvest of 2006-2007 both municipalities used conventional methods, and in 2019-2020 both adopted the new technology and the costs are expressed in values per hectare.24 The high cost of the seeds, seedlings, fertilizers and pesticides-insecticides is evident in the new system. The labor costs directly associated with production are negligible or nil in the new system. In the highly mechanized process, the labor factor related to the operations of machines, equipment and even airplanes are computed in the cost of this service, without segregating out their values.
Table 9 Cotton production costs in two of the largest producers (2006-2007 and 2019-2020)
| 2 006-2007 Harvest (perc entages) | 201 9-2020 Harvest (percen tages)* | |||
|---|---|---|---|---|
| Con ventional te chnology | High tech nology | |||
| Costs | B arreiras, BA | C. N. Perecis, MT | Bar reiras, BA | C. N. Perecis, MT |
| Current expenses | 57.3 | 80.4 | 65.6 | 69.4 |
| Operation of machines and planes | 9.7 | 9.9 | 7.2 | 5.3 |
| Labor | 2.6 | 5.9 | 0.0 | 0.0 |
| Seeds and seedlings | 2.1 | 1.6 | 9.9 | 6.5 |
| Fertilizers | 12.7 | 14.2 | 14.8 | 18.9 |
| Pes ticides/Insecticides | 29.9 | 48.8 | 33.5 | 35.0 |
| Others | 0.3 | 0.0 | 0.1 | 3.7 |
| Other expenses | 12.8 | 6.0 | 13.7 | 16.5 |
| External transport | 1.2 | 0.8 | 0.4 | 1.4 |
| Processing | 7.9 | 0.4 | 9.3 | 9.1 |
| Technical assistance | 1.1 | 1.6 | 0.8 | 1.2 |
| Production insurance | 2.2 | 3.1 | 1.7 | 1.5 |
| Others | 0.3 | 0.0 | 1.6 | 3.3 |
| Financial expenses | 5.3 | 4.0 | 3.1 | 3.8 |
| Total variable cost | 75.4 | 90.4 | 82.4 | 89.7 |
| Depreciation | 13.3 | 3.5 | 6.6 | 5.8 |
| Other fixed costs | 3.0 | 1.7 | 0.5 | 0.3 |
| Total operating cost | 91.7 | 95.6 | 89.5 | 95.8 |
| Factor income | 8.3 | 4.4 | 10.5 | 4.2 |
| Fixed capital remuneration | 4.5 | 0.9 | 2.5 | 2.0 |
| Land | 3.7 | 3.5 | 8.0 | 2.2 |
| Total cost | 100.0 | 100.0 | 100.0 | 100.0 |
| Value of total costs (R$) | 4 050.61 | 4 441.05 | 9 247.11 | 9 796.89 |
In addition to representing an agricultural product which uses lots of inputs and technology, cotton is an essential raw material for the textile sector, and there thus exists a complex value chain for this product. Of the inputs used in the production process, the most significant items were estimated to be pesticides (34.7%), fertilizers (25.7%), seeds (12.5%), fuels and lubricants (14.0%). In the 2016-2017 crop, inputs would total 1.3 billion dollars (Associação Nacional dos Exportadores de Algodão, 2011, graph A.1). It was estimated that in this highly mechanized crop approximately 10 000 people were involved in its cultivation, 170 000 were involved in the preparation and spinning of cotton fibers and textile industries, 655 000 in the clothing industry and another 384 000 workers in retail activities, for a total of 1 200 000 people across the chain (Associação Nacional dos Exportadores de Algodão, 2011, tabela A.3). Abrapa, the Brazilian Association of Cotton Producers, has estimated that the gdp of the cotton chain would represent a value in the order of 74 billion dollars (Associação Nacional dos Exportadores de Algodão, 2011, 2017, p. 19, tabela A.1; Buainain and Batalha, 2007).
According to United States Department of Agriculture, Foreign Agricultural Service usda estimates, Brazil will export 2 100 000 tons (or 8 900 000 bales) of cotton lint in the 2022-2023 harvest, out of a total of 2 800 000 tons produced. It estimated that Brazilian exports will represent 21% of world cotton exports in this year, while the leading exporter, the United States, which is to export 3 100 000 tons (United States Department of Agriculture, Foreign Agricultural Service, 2022, p. 9). As expected Brazilian exports are going to primary textile and apparel producers in the world (see table 10). Also, these agricultural exports, as with many other Brazilian agricultural products, are organized primarily by multinational trading companies and a few Brazilian ones. Such multinational companies as Cargill, ADM, Bunge, Glencore, Dreyfus, Omnicotton and Olam are among the important cotton exporters of Brazil (Associação Brasileira dos Produtores de Algodão and Associação Nacional dos Exportadores de Algodão, 2022).
Table 10 Major countries importing Brazilian cotton, 2015-2020 (in tons)
| Country | 2015 | 2016 | 2017 | 2018 | 2019 | 2020 |
|---|---|---|---|---|---|---|
| China, mainland | 103 819 | 57 773 | 82 954 | 283 681 | 501 725 | 658 752 |
| Viet Nam | 135 762 | 105 730 | 166 171 | 134 423 | 217 165 | 339 240 |
| Pakistan | 54 366 | 69 893 | 48 844 | 35 291 | 113 037 | 285 351 |
| Türkiye | 97 139 | 94 669 | 113 490 | 67 002 | 146 781 | 239 457 |
| Bangladesh | 16 915 | 55 101 | 87 629 | 86 870 | 189 895 | 211 738 |
| Indonesia | 133 536 | 145 028 | 170 588 | 137 783 | 201 791 | 202 343 |
| Malaysia | 80 255 | 57 144 | 47 708 | 50 702 | 87 423 | 83 086 |
| Republic of Korea | 99 886 | 116 742 | 50 328 | 50 869 | 45 528 | 49 962 |
| Thailand | 40 205 | 37 941 | 24 033 | 21 390 | 24 042 | 18 757 |
| Sub-total | 763 898 | 742 037 | 793 762 | 870 029 | 1 529 406 | 2 090 706 |
| Total world exports | 834 253 | 804 802 | 834 028 | 915 542 | 1 613 670 | 2 125 418 |
Although Brazil is a major world textile and apparel producer, local cotton lint production is sufficient to meet national needs and still send a majority of the cotton overseas.25 As of the harvest of 2014-2015 more than half of production is exported, reaching an estimated 73% in the harvest of 2020-2021 (see table 11).
Table 11 Brazilian production, consumption and stock of raw cotton, 2013-2014, 2020-2021 (in tons)
| Areas | 2013-2014 | 2014-2015 | 2015-2016 | 2016-2017 | 2017-2018 | 2018-2019 | 2019-2020 | 2020-2021a |
|---|---|---|---|---|---|---|---|---|
| Initial stock | 445.5 | 652.3 | 712.9 | 585.1 | 629.1 | 1 020.9 | 1 487.7 | 2 000.3 |
| Production | 1 734.0 | 1 562.8 | 1 289.2 | 1 529.5 | 2 005.8 | 2 778.8 | 3 001.6 | 2 737.9 |
| Importation | 31.5 | 2.1 | 27.0 | 33.6 | 30.0 | 1.7 | 1.0 | 1.0 |
| Supplyb | 2 211.0 | 2 217.2 | 2 029.1 | 2 148.2 | 2 664.9 | 3 801.4 | 4 490.3 | 4 739.2 |
| Consumption | 810.0 | 670.0 | 640.0 | 685.0 | 670.0 | 700.0 | 570.0 | 690.0 |
| Exportation | 748.6 | 834.3 | 804.0 | 834.1 | 974.0 | 1 613.7 | 1 920.0 | 2 010.0 |
| Final stock | 652.3 | 712.9 | 585.1 | 629.1 | 1 020.9 | 1 487.7 | 2 000.3 | 2 039.2 |
Notes: aEstimate of November, 2020. bSupply is the sum of stock+production+importation.
Although Brazil has become the world’s second largest exporter of cotton, this product still represents a small percentage of the Brazilian export basket, given the country’s representativeness in the world agribusiness market. In 2021 raw cotton exports were valued at 3.5 billion dollars, just half of the value of cellulose and just a tenth of the value of soybean exports. In the total mix of national exports, it represented 6% of all crops exported and 3% of all crops and pastoral products (Secretaria de Comércio Exterior, Ministério da Economia, 2022).
Nevertheless, Brazil has been active in defending its exports. Thus, it was the lead litigant against the United States and its policy of subsidization of cotton exports. These cotton subsidies and incentives became the subject of a long-standing dispute between the Brazilian and United States governments from the time of the founding of the World Trade Organization. The dispute which began in 2002 was concluded in 2014, with the commitment of the United States to make adjustments to its program to support cotton exports, and included an additional payment of 300 000 000 dollars to all the countries, which, like Brazil, were affected by its cotton support policies.26
Conclusion
Thus, over six centuries after Portuguese colonists first brought American originated cotton on to the world market, Brazilian cotton has again become an even more important component of international trade. This has been a long and complex history with shifting production zones and changing farming practices. For most of its history Brazilian produced cotton has gone to satisfy the needs of the internal market. But Brazilian cotton of both arboreal and herbaceous varieties never disappeared from the world market. These cottons were important in world commerce in periods when the United States left the market, as during the American Civil War of the 1860s and around the two World Wars.
Although arboreal cotton dominated production until well into the 20th century, the Northeastern producers could not complete against the short strand cotton which had become dominant in the United States and which was introduced into the fields of São Paulo in the 1870s. In this long second phase of Brazilian cotton development it was the Southeastern and Southern states of São Paulo and Paraná, which grew to be competitive to the Northeastern producers. As internal needs for cotton grew both the traditional Northeastern as well as these new centers satisfied local demand and still exported. But this all came to an end with the crisis of the 1990s when neo-liberal policies ended tariff protection for the industry and plant diseases proved difficult to eliminate and temporarily reduced plantings. The result was a decade of major cotton imports and the elimination of exports.
But this was not the end of cotton in Brazil. As part of the modernization of Brazilian agriculture in the late 20th and early 21st century, there was also a complete renovation of Brazilian cotton production as well. The move of cotton production to the Center West opened up a new phase in national production. The adaptation of crop rotation and no till agriculture along with genetically modified seed ushered in a new age in cotton production. In the space of just two decades Brazil went from being an importer of cotton to becoming the second largest exporter of cotton in the world, a position it had temporarily attained two centuries before.

