




 nueva página del texto (beta)
 Español (pdf)
 Artículo en XML
 Referencias del artículo
 Traducción automática
 Enviar artículo por email
 Citado por SciELO
  Similares en
SciELO
Similares en
SciELO 
 Permalink
Introduction
The urban forest is highly relevant due to its capacity to provide numerous ecological, social, psychological, medical, economic, and aesthetic benefits (Nowak & Crane, 2000; Dobbs et al., 2013), crucial to the well-being of citizens and to help mitigate negative environmental impacts of urbanization. The vast array of ecosystem services provided by the urban forest are directly related to its composition, structure (Nowak & Crane, 2000), distribution, and variability over urban space (Escobedo & Nowak, 2009). Considering this, characterizing the urban forest compositional and structural conditions across urban areas is a fundamental step towards the implementation of sustainable approaches, such as ecosystem services assessments, or effective management and planning applications (Alvey, 2006; Nowak et al., 2008). For this work, the definition of urban forest includes all trees across different land uses, and from individual trees to groups of trees, private and public trees, trees planted or in remnant ecosystems, as long as are located within the urban area boundaries (Nowak et al., 2001). Applying such a broader and more integrative definition of urban forest allows a better understanding of how urban forest components change across the heterogeneity of the urban landscape (Nowak et al., 2001; Alvey, 2006; Konijnendijk et al., 2006). In this study, the urban area was defined by the boundary from census tract polygons of the National Institute of Geography and Statistics (Inegi).
In Mexico City, most of the studies related to forest structure and composition have focused on specific zones (Ortega-Álvarez et al., 2011; Calderón-Contreras & Quiroz-Rosas, 2017), on individual neighborhoods (Velasco et al., 2014), or on specific green areas (Benavides-Meza & Fernández-Grandizo, 2012; Saavedra-Romero et al., 2016; Chávez-García & Mendoza, 2017; López-López et al., 2018), with only a couple of city-scale urban forest research (Toledo-Garibaldi et al., 2023; Toledo-Garibaldi et al., 2024). City-scale urban forest research allows the assessment of the relationship between different drivers of urban forest structure and composition, such as urban form, population density, land use types, to mention some (Nowak et al., 2008; Dobbs et al., 2013); understanding the influence of these drivers is of great importance to managing and planning for the urban forest (Dobbs et al., 2013). Successful urban forest planning and management actions require that the urban forest, and its structure, composition, and functions, are viewed as green infrastructure and as an integral part of the urban fabric and land use (Nowak et al., 2007).
The influence of land use on urban forest characteristics is described by the intensity of human activities and by the availability of planting space (Nowak et al., 1996). Research exploring the relationship between land use and urban forest characteristics has shown that green areas and open spaces tend to have higher species richness (Ortega-Álvarez et al., 2011; López-López et al., 2018; Saavedra-Romero et al., 2016), canopy width, basal area, and tree density (Sudah & Ravindranath, 2000), while studies have also reported that residential areas have higher tree species richness as compared to commercial areas and even parklands (Bourne & Conway, 2014). Previous research has also explored the urban forest variation along urbanization gradients (Burton et al., 2005; Ortega-Álvarez et al., 2011; Bourne & Conway, 2014), showing different patterns, an increase of tree species diversity as urbanization decreases, or the highest tree species richness at intermediate levels of urbanization. However, there are still fewer studies analyzing the effect of municipal boundaries on urban forest variation, even though municipal or administrative boundaries are an important institutional attribute that influences decision-making on open public spaces or publicly-owned street trees.
From an operational perspective, land use information is key for the implementation of any urban forest planning and management. Land use types are subject to specific regulations and limitations that allow or impede the implementation of actions within the urban forest, thus, city-scale land use plans should incorporate the ecological dimension to better manage and plan urban forests. Complementarily, the analysis at the borough level is needed from an institutional perspective to include urban forest information in borough-level plans (Toledo-Garibaldi et al., 2024). Mexico City is divided into 16 boroughs, each with an individual land use planning instrument called Borough Plan containing baseline information about various physical, geographical, historical, demographic, socioeconomic, and environmental aspects such as air quality, but they lack site-specific ecological information related to the urban forest. The planning implementation related to green areas and urban trees must first be incorporated into Borough-level Plans; from there, the implementation plans can scale-up to the General Program of Territorial Ordination, and finally, into the city-scale General Development Plan of Mexico City (Ley del Sistema de Planeación del Desarrollo de la Ciudad de México, 2019). A better understanding of how urban forest characteristics change between land use types and boroughs can inform decision-making to target the implementation of specific planning or management activities in certain areas with specific needs. Additionally, specific information about tree ownership in Mexico City is still needed and it is important in terms of stewardship and decision-making.
Tree canopy distribution is heterogeneous across Mexico City (Bravo-Bello et al., 2020), and thus, variation between land use types and boroughs is expected. Within land-use types, it is predicted that tree species richness will be higher in the green areas because these larger open areas are used for greening purposes often including a diversity of tree species different than those planted in the streetscape. It is also expected that species richness will be similar between the residential and residential-commercial land uses for having similar urban structure, and a low species richness is predicted at the agricultural and industrial land uses due to the lack of tree cover in these land-use types. Mexico City boroughs are heterogeneous and characterized by variations in their canopy cover; for instance, the borough Miguel Hidalgo in the northwest has the highest canopy cover (26.5%), while boroughs distributed in the north and east parts of the city, such as Venustiano Carranza, Gustavo A. Madero, Iztapalapa, Iztacalco, have less than 8% of canopy cover (Bravo-Bello et al., 2020). Due to this heterogeneity, a high variation in species richness, tree size and density is expected between boroughs, with lower values in boroughs in the east part of the city, which are boroughs with lower canopy cover.
Objectives
The aim of this study was to assess the tree composition, diversity and structure of the urban forest of Mexico City across its entire urbanized area considering publicly- and privately-owned trees, and to evaluate differences within land use types and boroughs.
Materials and methods
Study area
Mexico City is the capital of Mexico and is located at 19.4326° N and 99.1332° W. It is part of the Mexico City Metropolitan Area (MCMA), which includes Mexico City plus two states (State of Mexico and Hidalgo). Here, only Mexico City is included to generate information on the urban forest characteristics that can be incorporated into land use planning and administrative instruments that only operate in Mexico City, as the other states of the MCMA have independent governments. Mexico City has 9.21 million inhabitants (National Institute of Geography and Statistics [INEGI], 2020). It has a surface of 1493 km2, of which, 42% corresponds to developed land and 58% is conservation and agricultural land (Fig. 1a). The city is located at 2240 meters of elevation, and it falls under the biogeographical province termed the Trans-Mexican Volcanic Belt (Morrone, 2010); here, native tree species are species native to this province. The climate in the urban area is temperate with dry winter climate (Cwb), with an average temperature of 16.6 °C (maximum average of 27 °C from March to May, minimum average of 3 °C from November to January), and an average annual precipitation of 625 mm (rainy season from June to September).
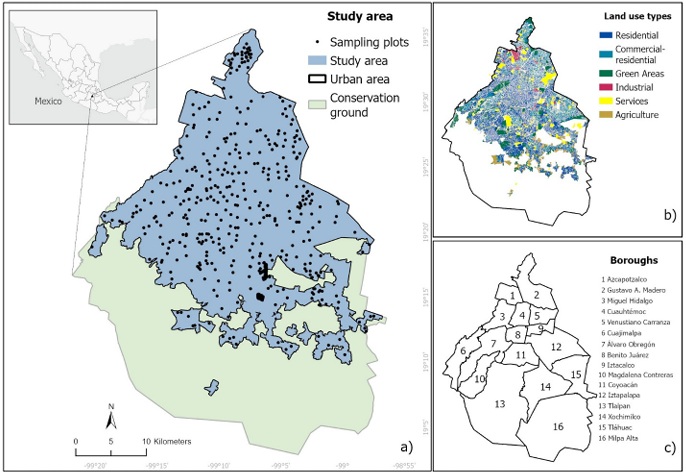
Mexico City’s land-use types and boroughs
The landscape of Mexico City comprises two major land uses, the “urban area” (42%) and the “conservation ground” (58%) (Fig. 1a). In this research, the focus was on the urbanized area and the conservation ground was not included. The “urban area” is defined as areas influenced by a high human population density and activity, a large proportion of build-up and impervious surfaces, vehicular traffic, and a variety of industrial activities (Ministry of Urban Development and Housing [Seduvi], 2003), and was delimited here by census tract polygons of INEGI. The “conservation ground” is defined as protected areas intended to maintain the biodiversity of the natural ecosystems and preserve their ecosystem services (Rivera-Hernández, 2016); is distributed in the south part of the city and includes natural vegetation, rural areas, and agricultural lands. Even though there are natural protected areas within the “urban area” land use, such as Cerro de la Estrella, Ejidos de Xochimilco and San Gregorio, among others, the category of “conservation ground” distinguishes the urbanized from the non-urbanized area of Mexico City.
Within the urban area, land use classification includes 26 types (with a total of 141 sub-categories) (Seduvi, 2003). To simplify land use information and have categories than can be comparative with other cities, all land use types were summarized into six types (Fig. 1b) as follows: residential (33.7% of the urban area), mobility networks (18.6%), mixed residential-commercial (15.3%), green areas (15.0%), services/urban equipment (8.9%), industry (2.7%), and the remaining 5.8% is regulated through Partial Programs of Urban Development (i.e., indigenous territories) (Seduvi, 2003). Land-use information was obtained from the Ministry of Urban Development and Housing of Mexico City (Seduvi). The 16 boroughs of Mexico City were analyzed and the cut of the urbanized area was applied in the spatial polygon leaving outside of the analyses the conservation ground.
Field methods
A total of 500 sampling plots (Fig. 1a) were placed using stratified random sampling throughout the urbanized area of Mexico City. Studies of urban forest structure and diversity frequently used an average 200 plot locations (Nowak & Crane, 2000; Escobedo et al., 2010), thus, a sampling size of 500 plots for a large city such as Mexico City was considered sufficient and it has been reported in other studies (Toledo-Garibaldi et al., 2023, 2024). Stratification was done utilizing several layers representing land use, land cover, canopy cover, and population data, and was used to inform sampling design and reduce bias in the data. The number of sampling plots per land use type ranged between 8 and 189, and per borough ranged between 9 and 107 due to the different surface area covered by each land use type and borough (Supplementary material 1), with smaller areas having fewer sampling plots and larger areas having more sampling plots. For instance, within the study area, the boroughs smaller than 3000 ha had up to 10 plots, while boroughs larger than 6000 ha had more than 40 plots.
A circular plot size of 400 m2 was selected because is commonly utilized in urban forest assessments (i.e., United States Forest Service, Nowak & Crane, 2000). Within each fixed area plot, all trees and shrubs with a diameter at breast height (DBH) ≥ 5 cm were identified to the species level and their DBH, tree height and canopy width were measured (Nowak & Crane, 2000). Canopy width was measured with a metrical tape, averaging two perpendicular measurements of the tree crown. Data from field samplings was used to derive urban forest compositional and structural variables.
Urban forest composition and structure
In total 12 urban forest compositional and structural variables were derived and aggregated at the plot level: (1) species richness, (2) native species, (3) introduced species, (4) species of temperate-affinity, (5) of tropical affinity, (6) of sub-tropical affinity, (7) evergreen species, (8) deciduous species, (9) basal area (BA; m2/ha), (10) canopy cover (m2), (11) number of trees, and (12) tree height (m).
Species richness is a common trait used to describe vegetation communities and urban forests, and it allows making comparisons between cities (Staudhammer et al., 2018). Native species were those naturally distributed within the biogeographical province of the Trans-Mexican Volcanic Belt (Morrone, 2010), knowing the proportion of native vs non-native species shades light on the ecological integrity of the urban forest in terms of its functions and the associated species (Ordóñez & Duinker, 2013). Evergreen species are those that retain their leaves all through the year, including both gymnosperms and angiosperms, while deciduous species are those that shed most of their leaves in a specific season (Rzedowski, 2006). Biogeographical origin (tropical, sub-tropical, temperate) was assigned to each species based on the available floristic databases (i.e., United States Department of Agriculture, Missouri Botanical Garden, Conabio) and floristic inventories of the region from Rzedowski (2005). The biogeographical origin provides information about the climate and original habitat of certain species (Pataki et al., 2013), and can be related to species' performance, ecosystem services, and the preferences of urban residents (Pataki et al., 2013).
To further characterize the urban forest, species abundances, and DBH classes were described for all sampled trees. The important value index (IVI) was calculated to determine the species’ dominance. The index considers abundance (number of individuals per species), dominance (basal area by species), and frequency (number of times the species occurs in the plots) (Curtis & McIntosh, 1951). Then, the relative values of these attributes were calculated.
Additionally, tree ownership was recorded as publicly owned if the tree was located in open public space, including sidewalks; or privately owned when the tree was located inside the limits of a building, house, or a lot. To measure privately owned trees, residents were asked for permission to access their property and take measurements along with a brief explanation of the purpose of the work.
Data analysis
Species diversity was quantified as species richness (the total number of species recorded by plot), and diversity estimates were performed with the package iNEXT in R (Chao et al., 2014; Hsieh et al., 2016). To compare tree species richness within land use types and boroughs, sample-size based rarefaction and extrapolation curves with Hill numbers of order q = 0 (species richness), q = 1 (Shannon diversity), and q = 2 (Simpson diversity) were used (Chao et al., 2014; Hsieh et al., 2016). Differences in species richness were evaluated using confidence intervals (95%) (Chao et al., 2014). Beta diversity analyses were performed in the iNEXT.beta3D package (Chao & Hu, 2024) and was evaluated using the dissimilarity index Jaccard-type turnover, where β-diversity of 0 indicates identical species composition among plots and 1 represents completely distinct communities.
The Kruskal-Wallis non-parametric test was used to investigate differences in plot-level structural characteristics (basal area, canopy cover, number of trees, and tree height) for land use types and boroughs. When significant differences were found, the Wilcoxon rank sum test was used to identify differences between categories at p < 0.05. The Bonferroni method was used to correct for multiple comparisons. Data analyses were performed using R version 4.3.2 (R Core Team, 2022).
Results
Urban forest diversity and structure
Of the 500 originally targeted plots, 320 (64%) contained trees and 180 (36%) were without trees. In the 320 plots (12.8 ha) with trees, 1640 trees were surveyed. A total of 106 tree species, 72 genera, and 44 families were found (The complete list of species can be consulted in the supplementary material 2). The Shannon diversity index of 33.8 (± 1.1 SE), and a Simpson diversity index of 18.9 (± 0.7 SE). Overall, 30% of all the tree species were native and 70% of the species were introduced. Evergreen species represented 64% and deciduous species represented 36% of the tree species. According to their biogeographical origin, trees were mostly represented by sub-tropical species (45%), followed by temperate and tropical tree species (27% each).
The most important families in terms of tree species were Rosaceae (10 species), Pinaceae (9), Cupressaceae (6) and Myrtaceae (5). Genera represented with the most species were Pinus (9 species), followed by Prunus (5); Citrus (4); Cupressus (4); Ficus (4); and Eucalyptus (3). Tree species represented with more individuals were Shamel ash (Fraxinus uhdei) (12.4%), Mexican white cedar (Cupressus lusitanica) (9.7%), casuarina (Casuarina equisetifolia) (9.6%), weeping fig (Ficus benjamina) (8.3%), and Chinese privet (Ligustrum lucidum) (5.7%). The most abundant introduced species were casuarina (C. equisetifolia), weeping fig (F. benjamina), Chinese privet (L. lucidum), blue gum (Eucalyptus globolus) and Mediterranean cypress (Cupressus sempervirens). As for native species, Shamel ash (F. uhdei), Mexican white cedar (C. lusitanica), American sweet gum (Liquidambar styraciflua), butterfly bush (Buddleja cordata) and Bonpland willow (Salix bonplandiana) were the most frequent.
Most of the species were represented by less than five tree individuals, for instance, 24 species were represented by only one individual (e.g., Chiranthodentron pentadactylon, Juglans nigra, Ginko biloba, Robinia pseudoacacia). The most important species ranked by IVI were F. uhdei (13.3%), C. lusitanica (10.0%), C. equisetifolia (8.2%), F. benjamina (6.7%), and the palm Phoenix canariensis (4.9%). While these species accounted for 43.1% of the total importance, the remaining 106 make 56% of all species.
Trees located on public property represented 71.2% and trees on private property accounted for 28.8% of the individuals. In public property 84 species were registered of which 71.5% were non-native species and 28.5% native species; 51.2% were sub-tropical species, 25.0% temperate, and 23.8% tropical; and 66.6% were evergreen and 33.4% deciduous species. As per private property, there were a total of 70 species, of which 67.2% were non-native and 32.8% native; 47.1% were sub-tropical, 27.1% temperate, and 25.8% tropical species; and 68.5% were evergreen and 31.5% deciduous species. The total basal area in public property was 92.17 m2/ha and in private property was 36.01 m2/ha. Tree height of all trees in public property was 8.9 ± 0.1 and 7.7 ± 0.1 in private property.
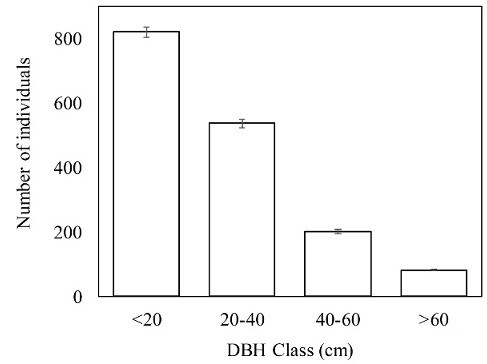
The mean DBH was 25 cm (± 4.7 SE). The size distribution of trees ranged from 5 cm to 170 cm DBH, with half of the trees having DBH < 20 cm, while 32.7% had a diameter between 20 and 40 cm, 12.3% between 40 and 60 cm, and 5% > 60 cm (Fig. 2). The total basal area of the sampled trees was 128.1 m2/ha, and the average basal area per plot was 0.405 m2/ha (± 0.03 SE). The total canopy cover of the sampled trees was 8095 m2 with an average canopy cover per plot was 25.3 m2/ha (± 1.4 SE). The average tree height per plot was 7.8 m (± 0.18 SE).
Urban forest variation by land use types and boroughs
Results indicated that significant differences exist in plot-level urban forest structural characteristics across land use types and boroughs (Table 1). Green areas had higher basal area, canopy cover, number of trees, and tree height than the rest of land use types; only for tree height, green areas were similar to the industrial land use. The commercial-residential land use had the lowest values for all structural variables, except for tree height (Fig. 3). Within land use types, species richness ranged from 8 to 68 in the industrial and residential land use, respectively (Supplementary material 1). A clear trend for changes in species richness within land use types was observed. The agricultural and industrial land uses were similar and registered the lowest values of species richness, while green areas and services formed a distinctive group with intermediate values of species richness. The residential land use had the highest species richness and Shannon diversity, while for the Simpson diversity both residential and services have the highest values (Fig. 4). All land use types except for agriculture, registered a higher number of non-native species than native species (Supplementary material 1).
Table 1 Summary of the Kruskal-Wallis test to compare variations in plot-level basal area, canopy cover, number of trees, and mean height within land-use types and boroughs in the urbanized area of Mexico City.
| Variable | Χ2 | df | p |
| Land use | |||
| Basal area | 47.1 | 5 | <0.0001 |
| Canopy cover | 62.5 | 5 | <0.0001 |
| Number of trees | 44.0 | 5 | <0.0001 |
| Tree height | 42.9 | 5 | <0.0001 |
| Borough | |||
| Basal area | 92.7 | 15 | <0.0001 |
| Canopy cover | 106.2 | 15 | <0.0001 |
| Number of trees | 78.5 | 15 | <0.0001 |
| Tree height | 82.8 | 15 | <0.0001 |
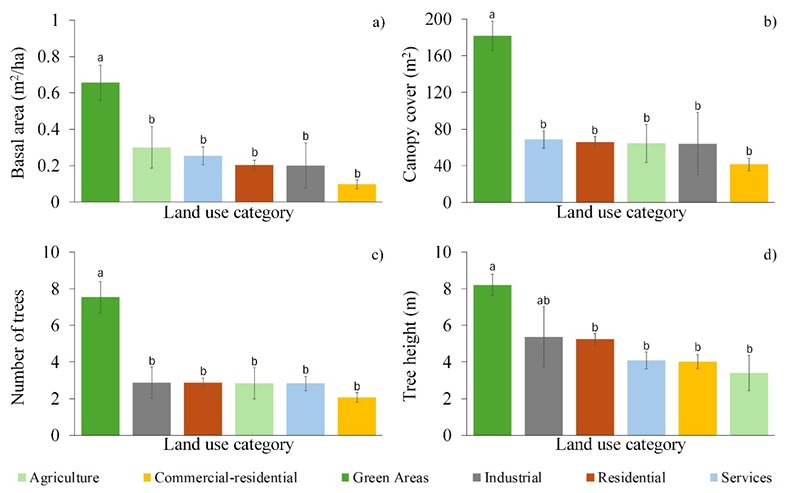
The same letters indicate no significant difference, different letters indicate statistically significant differences resulting from Kruskal-Wallis test and Wilcoxon post-hoc tests (p < 0.05).
Figure 3 Mean values of structural characteristics of the urban forest of Mexico City by land use type.
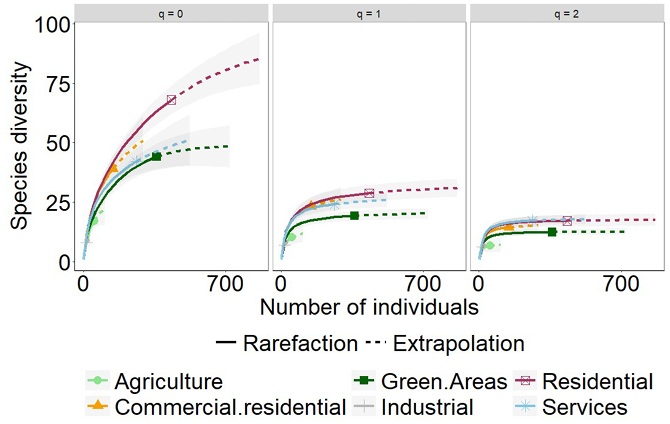
Figure 4 Sample-based rarefaction curves with Hill numbers of the orders q = 0 (species richness), q = 1 (Shannon diversity), and q = 2 (Simpson diversity) of tree species within land use types in the urbanized area of Mexico City (95% confidence intervals).
The highest values of canopy cover and tree density were found in the borough of Coyoacán. Tree height was similar between boroughs and the lowest values were recorded in the boroughs Gustavo A. Madero, Iztapalapa, Magdalena Contreras, and Tláhuac. The borough Benito Juárez had the highest basal area (Fig. 5). The borough Iztacalco located in the east part of the city, had the lowest species richness (8 species) while Tlalpan found in the south had the highest (47 species) (Supplementary material 1). Differences in the species richness indicated by rarefaction curves showed one group of boroughs with lower species richness formed by Azcapotzalco, Cuajimalpa, Tláhuac, and Venustiano Carranza; another group with higher species richness was formed by Álvaro Obregón, Benito Juárez, Coyoacán, Cuauhtémoc, Gustavo A. Madero, Iztapalapa, Tlalpan, and Xochimilco, found in the center, south and east parts of the city. The borough Miguel Hidalgo separated from these former groups (Fig. 6). For Shannon diversity, both Tlalpan and Xochimilco had the highest values, and for Simpson diversity Milpa Alta and Xochimilco were the ones with the highest values (Fig. 6).
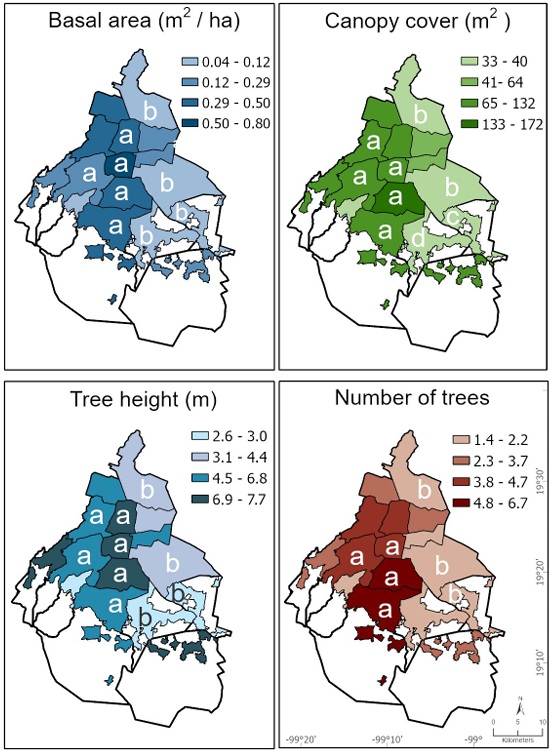
The same letters indicate no significant difference, different letters indicate statistically significant differences resulting from Kruskal-Wallis test and Wilcoxon post-hoc tests (p < 0.05).
Figure 5 Mean values of structural characteristics of the urban forest of Mexico City by borough.
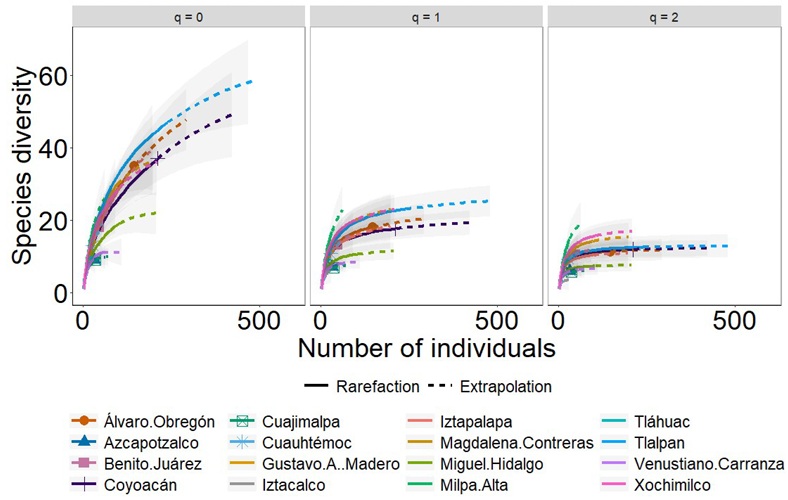
Figure 6 Sample-based rarefaction curves with Hill numbers of the orders q = 0 (species richness), q = 1 (Shannon diversity), and q = 2 (Simpson diversity) of tree species within boroughs in the urbanized area of Mexico City (95% confidence intervals).
Taxonomic beta diversity (dissimilarity) was slightly higher for boroughs (β = 0.63) in comparison to land use types (β = 0.57). Agricultural land use is different in its species composition than the remaining of land uses, whereas the commercial-residential is similar to green areas, residential and services, and the industrial land use is only similar to green areas (Table 2). Within boroughs, Cuajimalpa, Iztacalco, Milpa Alta, Magdalena Contreras, Tlahuac, and Venustiano Carranza are different between them and than the rest of boroughs, and these are all located farther from the central areas of the city (Table 3).
Table 2 Jaccard index between pairs of land use types in the urbanized area of Mexico City.
| Commercial-residential | Green areas | Industrial | Residential | Services | |
| Agriculture | 0.53 | 0.64 | 0.68 | 0.65 | 0.51 |
| Commercial-residential | 0.54 | 0.72 | 0.18 | 0.34 | |
| Green areas | 0.77 | 0.55 | 0.54 | ||
| Industrial | 0.81 | 0.71 | |||
| Residential | 0.36 |
Jaccard values vary from 0-which represents complete similarity to 1-which represents complete dissimilarity in tree species composition. Values in bold type indicate similar sites.
Table 3 Jaccard index between pairs of boroughs in the urbanized area of Mexico City.
| AZC | BJ | COY | CUAJ | CUAU | GAM | IZTA | IZTO | MA | MC | MH | TLAH | TLAL | VC | XOC | |
| AO | 0.67 | 0.30 | 0.31 | 0.82 | 0.54 | 0.08 | 0.17 | 0.64 | 0.32 | 0.66 | 0.48 | 0.78 | 0.37 | 0.69 | 0.21 |
| AZC | 0.31 | 0.58 | 0.80 | 0.50 | 0.57 | 0.58 | 0.23 | 0.64 | 0.71 | 0.58 | 0.88 | 0.83 | 0.64 | 0.67 | |
| BJ | 0.37 | 0.60 | 0.45 | 0.29 | 0.28 | 0.59 | 0.05 | 0.45 | 0.40 | 0.63 | 0.58 | 0.68 | 0.30 | ||
| COY | 0.88 | 0.52 | 0.35 | 0.25 | 0.64 | 0.46 | 0.69 | 0.42 | 0.77 | 0.55 | 0.65 | 0.48 | |||
| CUAJ | 0.75 | 0.86 | 0.80 | 0.61 | 0.60 | 0.67 | 0.84 | 1.00 | 0.81 | 0.95 | 0.69 | ||||
| CUAU | 0.47 | 0.47 | 0.12 | 0.46 | 0.51 | 0.53 | 0.96 | 0.59 | 0.61 | 0.47 | |||||
| GAM | 0.29 | 0.62 | 0.41 | 0.77 | 0.58 | 0.77 | 0.44 | 0.70 | 0.31 | ||||||
| IZTA | 0.43 | 0.47 | 0.61 | 0.31 | 0.72 | 0.51 | 0.58 | 0.33 | |||||||
| IZTO | 0.26 | 0.73 | 0.38 | 0.94 | 0.78 | 0.81 | 0.71 | ||||||||
| MA | 0.51 | 0.51 | 0.77 | 0.57 | 0.82 | 0.48 | |||||||||
| MC | 0.72 | 0.67 | 0.75 | 0.87 | 0.64 | ||||||||||
| MH | 0.77 | 0.64 | 0.72 | 0.48 | |||||||||||
| TLAH | 0.80 | 0.83 | 0.78 | ||||||||||||
| TLAL | 0.72 | 0.50 | |||||||||||||
| VC | 0.60 |
Jaccard values vary from 0-which represents complete similarity to 1-which represents complete dissimilarity in tree species composition. Values in bold type indicate similar sites. AO=Álvaro Obregón, AZC=Azcapotzalco, BJ=Benito Juárez, COY=Coyoacán, CUAJ=Cuajimalpa, CUAU=Cuauhtémoc, GAM=Gustavo A. Madero, IZTA=Iztapalapa, IZTO=Iztacalco, MA=Milpa Alta, MC=Magdalena Contreras, MH=Miguel Hidalgo, TLAH=Tláhuac, TLAL=Tlalpan, VC=Venustiano Carranza, XOC=Xochimilco.
Discussion
This research represents a city-scale urban forest assessment of Mexico City, and it provides information on its composition, diversity and structure for public and private trees, and it identifies differences between land use types and boroughs. Results from this work can help inform planning instruments at different scales and a city-scale urban forest management plan and can support decision-making from different actors in improving guidelines and regulations for tree planting, emphasizing the use of native species.
The urban forest of Mexico City has a moderate to high tree species diversity (106 species), as compared to other North American cities (e.g., New York, 66 species; Toronto, 116 species) (Nowak et al., 2007; City of Toronto, 2013). In Mexican cities, Falfán and MacGregor-Fors (2016) found 140 species in the city of Xalapa, which is a city located within a highly diverse cloud forest (Falfán & MacGregor-Fors, 2016). In this study, it was found that most of the tree species in Mexico City were introduced, concurring with other studies in Mexico (Ortega-Álvarez et al., 2011; Falfán & MacGregor-Fors, 2016; Saavedra-Romero et al., 2016; Toledo-Garibaldi et al., 2023; Toledo-Garibaldi et al., 2024), but contrasting with others conducted abroad (Jim & Liu, 2001; Nowak et al., 2007; Muthulingam & Thangavel, 2012), which may indicate a general trend of dominance of introduced tree species within Mexican cities.
The lower representation of native species in Mexico City can be explained by the preference of local managers and residents towards exotic species, and by the high propagation rate of some non-native species (Ortega-Álvarez et al., 2011; Chimal-Hernández & Corona, 2016; Toledo-Garibaldi et al., 2024). There are examples of introduced species that have negatively impacted native tree species and have been planted extensively across Mexico City and its surrounding rural areas, particularly the genera Casuarina and Eucalyptus (Koleff et al., 2010). Among the dominant introduced species found here, Casuarina equisetifolia, Ficus benjamina, and Ligustrum lucidum are also frequent across urban and rural areas in Mexico.
The dominance of non-native species replaces native species and can increase the risk of biotic homogenization (McKinney, 2002). The analyses of dissimilarity showed a low beta diversity within boroughs and land use types, which can indicate a degree of homogeneization in the tree species composition. Consequently, it is recommended that native tree species be prioritized in Mexico City to offset the current dominance of non-native species. Additionally, a more diverse pool of native tree species should be considered, for instance, the natives Fraxinus uhdei and Cupressus lusitanica were among the most dominant trees in Mexico City, thus is recommended to diversify the palette of native tree species in future planting efforts. However, more information is needed to better understand how native species perform under the stressful conditions of urbanized areas.
Additional considerations regarding the selection of tree species are important, particularly under climate change conditions. The role of non-native species in urban environments and under the context of climate change is still been investigated and is controversial (Davis et al., 2011; Sjöman et al., 2016). It is often recommended that native species should be prioritized as they have a better adaptation to regional environmental conditions (Sjöman et al., 2016), however, this argument may not necessarily apply to novel urban conditions where tree species are usually subject to stressors like heat and drought, which are expected to be intensified by climate change (Roloff et al., 2009). It has been shown that some introduced species can provide habitat and food resources for animals (Sagoff, 2005), however, there is also evidence that non-native tree species can decrease the food resources for herbivores (Chalker-Scott, 2015). Another concern is the potential for some exotic species to become invasive. The challenge of reducing invasion risks should be addressed by identifying the invasive for the targeted region (Sjöman et al., 2016) and avoiding planting these species near natural areas, as the results presented here showed a higher proportion of introduced species as compared to native species in green areas.
The geographical location of Mexico City within the Trans Mexican Volcanic Belt, which is a transition zone comprising Nearctic and Neotropical floras (Morrone, 2010), enables the presence of both deciduous and evergreen tree species, as well as trees of temperate and tropical affinity. However, not all species have the same environmental and managerial requirements, and they may perform differently in the face of the local conditions. For instance, temperate tree species were found mostly in the residential, green areas and services land uses, and within boroghs distributed mostly in the south and southwest parts of the city, highlighting the idea that temperate species should be prioritized in these areas in the south and west parts of the city, which are closer to the peripheral mountains where the temperatere forests distribute naturally and where climatic conditions may be more suitable for the establishment and development of these species. However, within the urban core, where climatic conditions are more extreme with increasing temperatures and more severe droughts (Roloff et al., 2009), is possible that native temperate species will not strive. This idea is supported by the lower proportion of native tree species compared to non-native species found within the commercial-residential and industrial land uses; similarly within boroughs, only one borough located in the southwest part of the city closer to the mountains, had a higher proportion of native species than non-natives. Evergreen tree species were the most frequent in the urban forest of Mexico City, concurring with Ortega-Álvarez et al. (2011), Velasco et al. (2014), and Toledo-Garibaldi (2023, 2024). Leaf persistence is often used as an indicator of environmental services provided by trees, as evergreen trees provide benefits throughout the year, while deciduous would do only in the growing season (seeVelasco et al., 2014). There were fewer tropical species, but they were represented by more individuals. Most of the tropical species found in the urban forest are from Asia and Central America, where the climate is warmer, and the rainfall is heavier. Some tropical tree species, such as those of the genus Ficus, were frequent in Mexico City and are often larger, and their roots often cause damage to the urban structure, however, were planted due to their ornamental value, adaptability to urban environments, and resistance to heat and sun radiation (Vargas-Garzón & Molina-Prieto, 2012).
Previous research has stressed the importance of land tenure on urban forest variability (Escobedo et al., 2006; Dobbs et al., 2013). Most of the trees surveyed here were located on public lands, contrary to the trend observed in North American cities such as Toronto (60% of the trees on private property) (City of Toronto, 2013). This trend in Mexico City can be explained by the city’s high population density coupled with urban planning that favors the development of apartment buildings without impervious surfaces, while detached houses with yards or gardens are less frequent. Similarly, a higher species richness was found in public lands as compared to private lands, this is not surprising as the pool of species available in nurseries is often limited, and it may also be related to the lesser amount of trees recorded in private property. Additionally, tendencies were consistent in both public and private lands in having higher number of non-native species vs native, sub-tropical vs tropical and temperate, and evergreen vs deciduous species. Research on how decisions made on privately owned trees shape the composition and structure of the urban forest as a whole is still needed in Mexico City. A better understanding of the urban forest characteristics based on land tenure helps to make more informed decisions and designate resources more effectively to manage urban trees and represents an opportunity for further research. The higher proportion of publicly owned trees highlights the importance of governmental authorities to the conservation and planning of Mexico City’s urban forests.
Urban forest variation across land use types and boroughs
As expected, land use types and boroughs were ecologically heterogeneous units as indicated by their variations in structure and diversity, which reinforces the idea that urban forest planning needs to be targeted considering the site’s specific conditions. The main differences in structural characteristics between land-use types were found in the green areas. For all structural variables, green areas were significantly higher than the rest of land uses, which can be partially explained by the space availability, the age of the green area, and the management as compared to other land uses. Tree diversity was higher in residential areas, and this is similar to the findings of Ortega-Álvarez et al. (2011), in their analysis of tree diversity across an urbanized gradient in central and southwestern Mexico City, finding a positive asociation between species richness and residential land-use and higher species richness at intermediate developed lands. Both residential and commercial-residential registered higher values of Shannon diversity, indicating more common species within these land uses, whereas for the Simpson diversity the residential and services were the ones with higher values, which indicates more dominant species, individuals between species are more evenly distributed within the residential, commercial-residential and services land use types.
The findings from the present study indicated that the structural variables evaluated here were consistently similar within boroughs located in the center, south, and west parts of the city, while boroughs in the east part formed similar groups with lower values for structural variables. Similarly, boroughs in the east part also had lower species richness, suggesting higher urban forest planning needs in Venustiano Carranza, Iztacalco, Iztapalapa, and Tláhuac. These areas are dominated by hard surfaces (Toledo-Garibaldi et al., 2024), thus reducing the availability of planting spaces and limiting urban forest planning. Demineralization of paved surfaces is a limited option in Mexico City due to the intensity of use of the public space and this strategy could accentuate existing space conflicts. Nonetheless, some wide sidewalks, or spaces in parks, schools, or institutional buildings could be transformed into soft surfaces to plant trees with small to medium final dimensions. Other green infrastructure can be implemented such as green walls, climbing plants, and green roofs. However, there are areas without trees and with no possibility of increasing greenery due to their specific conditions (e.g., industrial sites). Borughs located in the south (Tlalpan, Xochimilco and Milpa Alta) had the highest Shannon and Simpson diversities, showing their ecological importance, and the need to diversify boroughs towards the northern part of the city.
The information obtained in this study can serve as a first step toward the development of a comprehensive urban forest management plan (UFMP). While in North America numerous cities count with UFMP (e.g. Montreal, Ottawa, Quebec City, Toronto, Vancouver, New York, Oakland, San Francisco, Seattle), Mexico lacks compre-hensive management plans at the city scale, and accounting for urban forest variations that highlight the urban heterogeneity is necessary for a better planning and management. A UFMP based on tree inventory data is essential for protecting and planning urban forests and is an effective tool that gives planners, citizens, and government information and recommendations needed to manage public trees. Effective management can help maximize the environmental services of urban trees, increasing the environmental quality of cities and the well-being of city dwellers. By developing and implementing a city-scale management plan, Mexico City would start a long-term commitment to manage, protect, and expand the urban forest, ensuring the provision of environmental services to the city residents.
Conclusions
This study is one of the first efforts to assess the urban forest across the entire urbanized area of Mexico City considering both publicly- and privately-owned trees, and to evaluate the variations on its structure and diversity within land use types and boroughs. Overall, results showed that land use and boroughs are heterogeneous ecological units and thus urban forest planning and management should account for specific site conditions such as level of urbanization, location, and the preexisting conditions of the urban forest. The higher proportion of non-native tree species highlights the challenge to increase the urban forest diversity prioritizing native species; however, more studies are needed to evaluate the differential performance between native and non-native species under the stressful and changing conditions in cities.

