


 nueva página del texto (beta)
 Inglés (pdf)
 Artículo en XML
 Referencias del artículo
 Enviar artículo por email
 Citado por SciELO
  Similares en
SciELO
Similares en
SciELO 
 Permalink
INTRODUCTION
Lahar is an Indonesian term to describe a rapid moving mixture of water and sediment originating on volcanic slopes (Smith and Lowe, 1991). Lahars are the most frequent phenomena on active and quiescent volcanoes. These events are the principal cause of human losses during volcanic eruptions, accumulating 15 % of all historical fatalities (Auker et al., 2013; Brown et al., 2017). Their capacity to rapidly inundate large areas represents a significant threat to property, infrastructure, and life, having caused >30000 casualties in the twentieth century alone (Witham, 2005; Manville et al., 2013). The origin of lahars depends on four parameters (Vallance, 2005): a source of water, unconsolidated debris, steep slopes, and a triggering mechanism which, in most of the cases, is rainfall. Lahars can occur during an eruption (i.e., syn-eruptive lahars) like during the catastrophic event recorded in 1985 at Nevado del Ruiz (Colombia), when small pyroclastic flows eroded part of the glacier cap of the volcano triggering lahars that impacted the town of Armero and killed more than 20000 people. Most frequently lahars occur after an eruptive episode (i.e., post-eruptive lahars) when fresh material is available on the steep slope of the cone, or even during a quiescent period of the volcano (i.e., intra-eruptive lahars) (Manville, 2009).
Rainfall-induced lahars are especially frequent on tropical composite volcanoes, which are seasonally affected by heavy rainfall (Lavigne et al., 2000; Thouret et al., 2007; Charbonnier et al., 2018). The largest and more destructive events take place when hurricanes touch land and induce long lasting tropical rainfall as occurred at the Casita volcano in Nicaragua during Hurricane Mitch in 1998 causing more than 2000 fatalities (Scott et al., 2005), or in 1995 at the Tolimán volcano (Guatemala) during heavy rainfall from Hurricane Stan (Charbonnier et al., 2018) with negative impacts on the surrounding populations. Lahars can undergo multiple and reversible spatial and temporal transformations in flow behavior (e.g., from hyperconcentrated flows to debris flows or vice versa), controlled by bulking and debulking processes that depend on flow velocity, channel morphology, and the interception of secondary drainages (Manville et al., 2013). The definition of lahar dynamic has been hampered by their unpredictability (Manville, 2009), and the difficulties in obtaining specific data (i.e., sediment concentrations, velocity, hydrographs, etc.).
Over the last ten years, the understanding of lahar initiation processes and flow behaviors has benefited from multi-parameter geophysical measurements (Doyle et al., 2011; Vazquez et al., 2014, 2016a, 2016b; Coviello et al., 2018; Walsh et al., 2020). These systems normally include seismometers, video cameras, infrasound sensors, and rain gauges. Data from monitoring indicate that rainfall behavior (accumulation and intensity) largely controls lahar initiation processes (Mead et al., 2016; Capra et al., 2018; Baumann et al., 2020), and that lahar propagation and longitudinal transitions from hypercontracted flows to debris flows, which can be identified based on the seismic amplitude (Coviello et al., 2018), are common and mostly controlled by the channel slope and morphology and by the downflow water-input from secondary drainage (Doyle et al., 2011; Thouret et al., 2019).
The Volcán de Colima (VdC), one of the most active volcanoes in Mexico (Figure 1), is largely exposed to hydrometeorological events during the rainy season from June to October, thus representing a natural laboratory for the study of lahars. Up to 40 lahars per year are detected along the main ravines of the volcano and these affect the villages and infrastructure in a radius of 15 km from the volcano summit. Since 2011, real-time lahar monitoring systems have been progressively deployed in the main ravines of the VdC (Figure 1) to provide a better understanding of lahar initiation and flow behavior (Vazquez et al., 2014, 2016a; Coviello et al., 2018; Walsh et al., 2020), especially for the more frequent and low magnitude lahars.
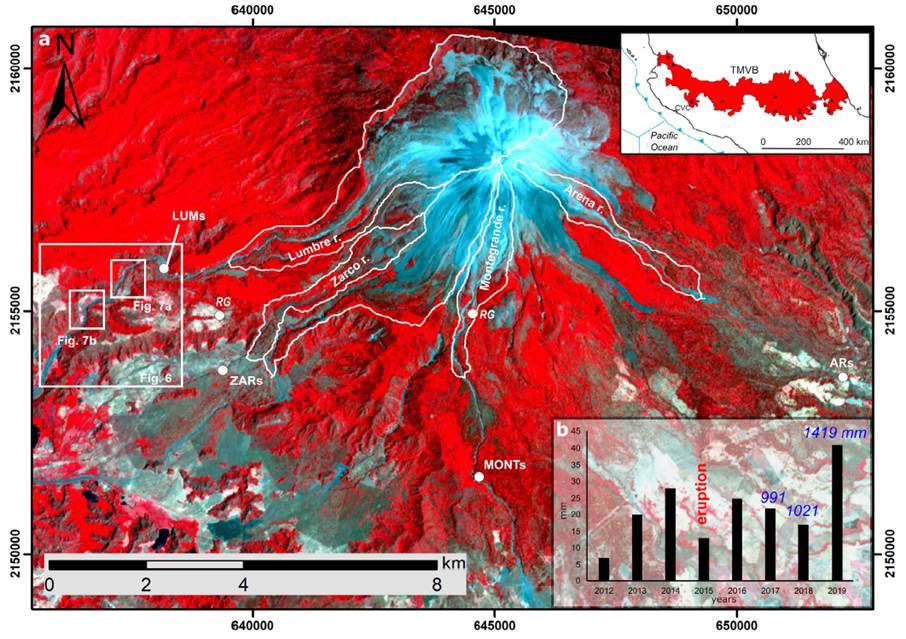
Figure 1 a) Satellite image of the Colima Volcanic Complex (CVC) where the main watersheds are depicted on the Volcán de Colima cone (Image projection: Universal Transverse Mercator-UTM). Lahar monitoring stations are also shown along the main ravines: Lumbre (LUMs), Zarco (ZARs), Montegrande (MONTs), Arena (ARs). The insets refer to the geodynamic setting of the Trans Mexican Volcanic Belt and the location of the CVC within it (above) and to the lahars detected along the Montegrande ravine since 2012; b) total accumulated rainfall is reported for the last three years showing that lahar frequency is closely related to rainfall. White squares indicate the location of figures 2, 6 and 7.
In this paper, we focus on analyzing the lahar formed along the La Lumbre ravine during the 2015 Hurricane Patricia, for which a complete visual and seismic record is available. The latter provides an exceptional opportunity to better understand long-lasting, multi-pulse lahars that are commonly responsible of catastrophic effects on populated areas. In particular, the seismic record is here analysed and compared with the frames captured by the camera during the event to better correlate flow behaviour with the recorded seismic amplitude and frequency.
Volcán de Colima and its lahars
The Volcán de Colima (VdC) is one of the most active volcanoes in Mexico, not only for its explosive activity but for the generation of several lahars along its main ravines. The VdC is an andesitic stratovolcano located in the western sector of the Trans-Mexican Volcanic Belt (TMVB) (Figure 1). Historical activity at the volcano has consisted of dome growth and collapse, lava flows, and periods of explosive activity, mainly vulcanian in nature but occasionally sub-Plinian and Plinian (Saucedo et al., 2005). The continuous magmatic activity of the VdC, with the growth of summit domes and their subsequent collapse, has generated large volumes of unconsolidated pyroclastic material on its flanks (Sulpizio et al., 2010; Capra et al., 2014), with the 2015 event being the largest one recorded over the past 100 years (Capra et al., 2016; Reyes-Dávila et al., 2016; Macorps et al., 2018).
The VdC is periodically exposed to intense seasonal rainfall responsible for the occurrence of lahars from June to late October (Dávila et al., 2007; Capra et al., 2010; Vázquez et al., 2016b, Capra et al., 2018). Lahars are more frequent just after an eruption and in the years following it, but their magnitude is a function of the characteristics of the rainfall (Capra et al., 2010, 2018) (Figure 1). In fact, over the last twenty years, the most catastrophic events occurred during rainfall associated with hurricanes, such as in 2011, 2013, and 2015 (Capra et al., 2018). These events provoked damages to roads and bridges leaving some inhabited areas isolated for a few days.
The systematic detection of lahars at the VdC has been carried out since 2011 using seismic data from the RESCO (Red Sísmica Telemétrica de Colima) network, the Seismological network of Universidad de Colima and from monitoring sites with video cameras and geophysical and hydrological instrumentation installed along the Montegrande, La Lumbre, Zarco, and Arena ravines (Vázquez et al., 2016a) (Figure 1). The monitoring station at La Lumbre (LUMs), whose data are used here, consists of a 12 m high tower built on an 8 m-high terrace around 3 m from the edge of the channel (Figure 2). In 2015, the monitoring site was equipped with a rain gauge HOBO RG3 coupled with a soil moisture sensor HOBO EC10, a 10 Hz geophone Sercel SG-10 with a sampling rate of 250 Hz, and a video camera taking pictures every 2 s (Coviello et al., 2018). The data was transmitted in real time to RESCO facilities.
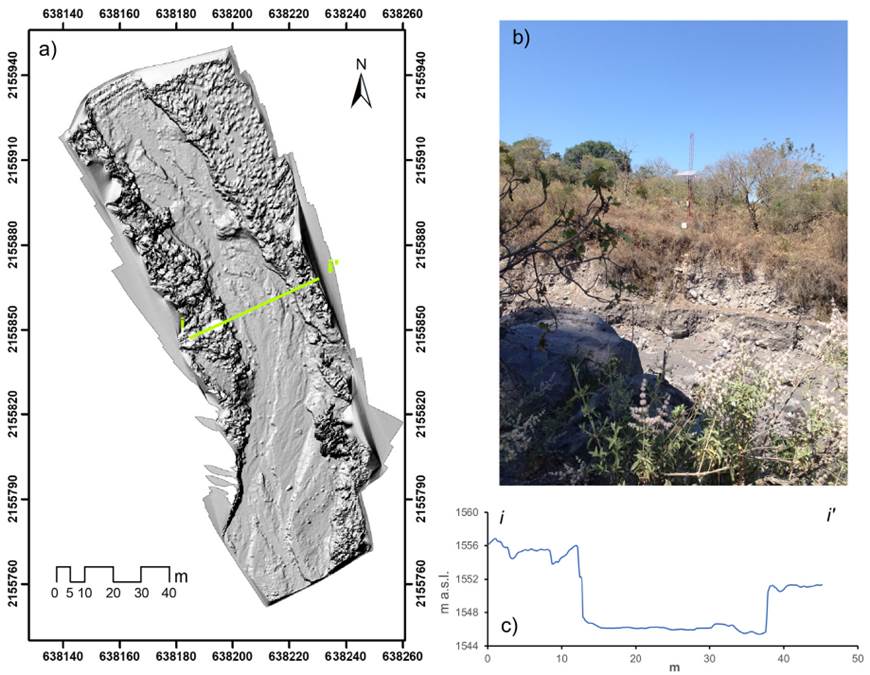
Figure 2 a) Digital elevation model of the La Lumbre channel obtained with an unmanned aerial vehicle at the monitoring site (Map projection: Universal Transverse Mercator-UTM). b) Picture of the monitoring station and c) topographic section of the channel (i-i’).
Data acquired from the lahar monitoring stations have been used to characterize lahars at the VdC. Their initiation mechanism and their magnitude can differ throughout the rainy season. Low volume (from 104 to 105 m3) single-pulse lahars usually form during orographic events at the beginning of the rainy season, which have a short duration (<1 hour) and high intensity (>80-100 mm/hour) rainfall and quickly vanish as the rain stops (Vázquez et al., 2014, 2016a). In contrast, large volume (106 m3), multi-pulse flow lahars flood for several hours during stationary, long-lasting (>2 hours up to 24-48 hours) and low-intensity (~50 mm/hour) rainfall events, such as tropical rains, after an initial stage of low water runoff where infiltration processes prevail (Capra et al., 2010; 2018). During these long-lasting events, the main flow surges are either controlled by watershed discharge or by peaks in rainfall intensity (Capra et al., 2018). Frontal surges are commonly characterized by large blocks (m-sized), sometimes preceded by streamflow/hyperconcentrated flows, or without any scouring before the arrival of the main front. Major lahars have been observed along the La Lumbre ravine, which is fed by the largest watershed (4 km2) out of the ravines (Figure 1). Here, main-stage flow is usually preceded by an initial streamflow followed by a hyperconcentrated flow with sediment concentrations in the range of 0.3-0.45 (Coviello et al., 2018). A straightforward correlation has previously been found between the amplitude of the seismic signal and the sediment concentration of the flow, and a value of 1.8×10⁻³ m/s was identified as a threshold to recognize the transition from the stream flows to the hyperconcentrated phase (Coviello et al., 2018), of importance for setting up an early warning system. Data from Coviello et al. (2018) are here reanalyzed to better interpret the Patricia lahar flow transitions; both events were recorded with the same seismic sensor.
Hurricane Patricia event
In October 2015, Hurricane Patricia originated on the southwestern coast of Mexico and traveled along the Mexican pacific coast to the area of the Colima and Jalisco states. On the morning of October 24, it was announced as a hurricane of category 5 on the Saffir-Simpson scale. As it traveled inland, it hit the Sierra Madre Occidental highlands and rapidly declassed to tropical rainfall (CONAGUA, 2015). The event accumulated up to 440 mm of rainfall over 35 hours (Capra et al., 2018). This amount of rain triggered several lahars along the main ravines of the VdC, including the Montegrande ravine (Walter et al., 2018), which was largely affected by pyroclastic flows three months earlier (Capra et al., 2016). The lahar formed at the La Lumbre ravine (here named the Patricia lahar) was the biggest and most destructive in the area with considerable damages to the bridge in the town of La Becerrera which connects the Colima and Jalisco states; the communication between these two states was interrupted for more than three days. The lahars lasted for more than five hours, and the LUMs was able to document this lahar with a complete record of seismic data and video acquired during daytime.
Visual data and seismic analysis
The seismic signal obtained by a geophone Sercel (10Hz) at LUMs was used with the original sampling frequency (250 sps), to analyze a time interval of four hours during the event (22 h 23/10 - 02 h 24/10 GMT). This time interval corresponds with the initial stage of hyperconcentrated flows with a seismic amplitude of 0.087 mm/s until a significant decrease in amplitude values (back to the background noise). It is worth mentioning that stream flows were already visible on the channel at 16:24 h 23/10 and sediment-laden flows continued up to 04 h 24/10 of the next day (Capra et al., 2018) but images were only available up to approximately 00 h 24/10.
The seismic analysis started with the instrumental correction to physical units, presented in mm/s (Figure 3). The linear trend and mean were removed. We used the Welch method to obtain the Power Spectral Density (PSD) with a one-minute window and 50 % of overlapping.
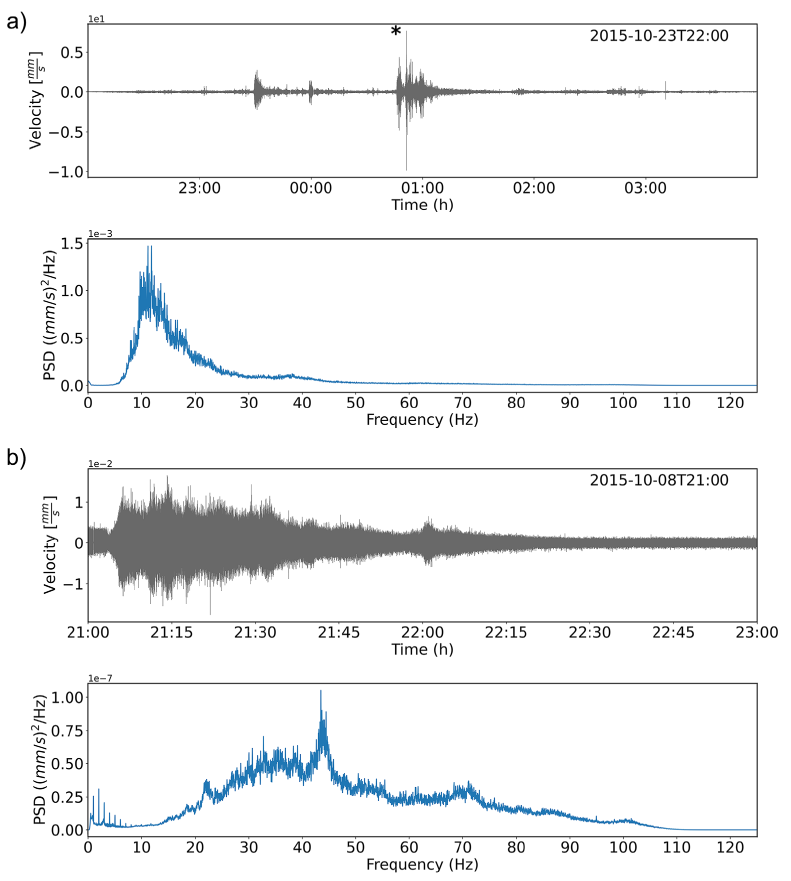
Figure 3 Amplitude and Power Spectral Density (PSD) of the seismic signal obtained for a) the Patricia Lahar, asterisk indicates the maximum seismic amplitude recorded during the event and b) the low-magnitude hyperconcentrated event recorded on October 8, 2015, at the LUMs monitoring site (Coviello et al., 2018). This record shows the wide frequency band produced by flows in the hyperconcentrated phase, in contrast to the Patricia Lahar, a high-magnitude debris flow event, where the narrow frequency band, which corresponds to the debris flow phase, dominates the energy recorded. The smaller contribution of the higher frequencies corresponds to the hyperconcentrated phases.
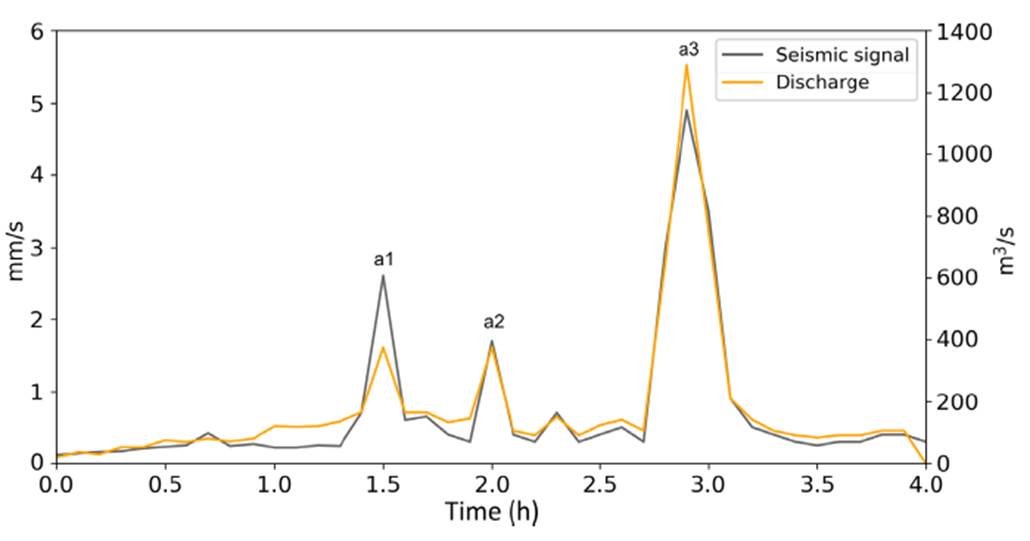
As previously observed for lahars at the VdC and other volcanoes (Tuñgol and Regalado, 1996; Vázquez et al., 2016a; Coviello et al., 2018), the amplitude of the signal can be assumed to be proportional to the flow discharge. To confirm this assumption, the flow depth and inundated area were estimated based on scaled images. The section of the channel at the monitoring site has a rectangular shape, is ~25 m in width and 5 m in depth (Figure 2b). The flow depth and inundation area were estimated for each frame. Finally, an average flow velocity of 10 m/s estimated at this point during previous events (Zobin, 2012) was used to calculate the flow discharge which was compared with the envelope curve of the seismic amplitude. The area below the envelope curve was also calculated to estimate the flow volume at the monitoring site (Figure 4).
The event
The first stream flows were observed starting at 16:25 h (23/10/15 GTM, hereafter dates and times will be given in GTM), with seismic amplitudes in the range of the background noise (Figure 5a). Flow discharges progressively increased, and the stream flows started to inundate the whole channel width (Figure 5b). After six hours, the main channel was almost totally inundated by flows, with seismic amplitudes between 0.08 and 0.42 mm/s, a range characteristic for hyperconcentrated flows at the La Lumbre ravine (Figure 3b, Coviello et al., 2018). Based on measurements on scaled images, the flow depth increased from a few centimeters for the initial streamflows which remained confined in the central portion of the main channel up to 2-3 meters for the hyperconcentrated flow that inundated the entire channel section (Figure 5b).
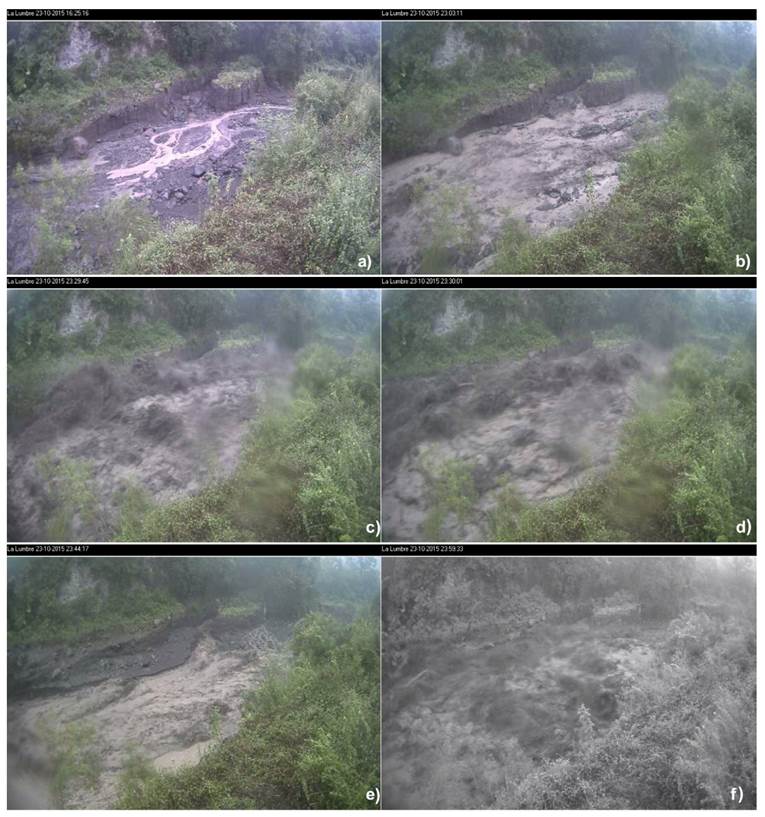
Figure 5 Selected frames acquired with the video camera at the Lumbre monitoring site. a) First stream flow; b) transition to hyperconcentrated flow; c and d) a1 front; e) hyperconcentrated flow between main fronts; f) a2 front.
The arrival of the first main front (a1) was observed at 23:29 h (Figure 5c and 5d), characterized by an increment in seismic amplitude up to 2.67 mm/s (Figure 4) and a flow depth of ~5 m. After the transit of this front (lasted approx. 3 minutes), a sudden decrease in flow depth occurred, with the amplitude decreasing down to 0.5 mm/s, similar to the previously detected hyperconcentrated flows (Figure 5e). The passage of the second front (a2) was recorded at 23:59 h, approximately 30 minutes after a1; the event lasted approximately 2-3 minutes and was characterized by an amplitude of 1.54 mm/s (Figures 4 and 5f). At this time, the images were recorded in gray-scale because of the darkness. However, it was possible to estimate its maximum depth at ~4 m.
Images were not available for the last main pulse (a3). It was recorded at 00:47 h on the 24/10/15 with an amplitude of 4.9 mm/s (Figure 4), according to which it probably represented the largest pulse of the lahar.
The highest peak recorded at 00:50 h on the 24/10/15 with an absolute amplitude of 9.9 mm/s, a significant value outstanding from the rest of the waveform (Figures 3a), was related to an external event such as rockfall, a single impact of a block within the flow, or thunder. This feature of the seismic signal was not considered to calculate the envelope. The PSD curve shows a positive skewness with a maximum peak in frequency around 10.5 Hz and secondary peaks between 18 and 38 Hz (Figure 3a).
Finally, the calculated discharge curve approximates the shape of the seismic amplitude envelope, confirming the assumption that the seismic amplitude can be used to estimate the flow discharge when no other data are available (Figure 4). For the first part of the event (from time = 0 to a2, Figure 4) the discharge Q was calculated using the formula:
where the cross-sectional area A is calculated by multiplying the flow depth by the channel width, both estimated from the video images. An average flow velocity ѵ was used for this calculation. For the final part of the event (from a2 up to the end, Figure 4) the video images were not available. Thus, the discharge curve was extrapolated using a linear regression between the available flow-depth values from the first part of the event and the corresponding seismic amplitudes. Based on this estimation, the main flow surges had discharge values from 400 up to 1200 m3/s, which can be considered as mean values since an average value for the flow velocity was used here. A total flow volume of ~2.5×10⁶m3 was estimated from the discharge curve.
NUMERICAL MODELING
Lahar propagation and dynamics can be simulated using depth-averaged numerical models. The numerical modeling of lahar dynamics is non-trivial due to spatial and temporal variations in flow behavior (Kavanagh et al., 2018). Few mathematical models can simulate lahars precisely due to their complex behavior. The FLO-2D computer code (O’Brien et al., 1993) is one of them and was used here to simulate the Patricia lahar. FLO-2D is a simple two-dimensional volume conservation model that uses a quadratic rheological model for predicting viscous and yield stress as a function of sediment concentration. The empirical relationships are:
and
where α and β are empirical coefficients and exponents of the material, defined by O’Brien and Julien (1988) by laboratory experiments, and Cѵ is the volumetric sediment concentration.
(2) and (3) equations are related in the friction slope equation:
where:
S f |
-total slope-friction |
γ m |
-specific weight of the flow |
h |
-flow depth |
K |
-empirical resistance parameter |
V |
-flow velocity |
n td |
-Manning coefficient |
The FLO-2D model solves a quadratic solution for (4) to calculate the velocity for the momentum equation and to compute the output values. The h and V values are calculated by the model and the rest of the parameters (input parameters) are assigned by the user (Figures 6, 7 and 8). Here, the rheological parameters were established based on previous simulations for non-cohesive lahars along the Montegrande ravine (Table 1) at the VdC (Caballero-García et al., 2017). The flow hydrograph curve is based on the previously described discharge curve (Figure 4), and the inflow point is set at the LUMs monitoring site (Figure 1 and 6). Finally, sediment concentration (Cv) was considered in to range from 0.45 to 0.5 for the main surges and from 0.3 to 0.4 for the initial hyperconcentrated phases and recessional flows between the main pulses based on the seismic amplitude (Coviello et al., 2018).
Table 1 Parameters and values for the simulation.
| Rheological parameter | Value |
|---|---|
| Yield strength | τy = 0.0765e16.9Cѵ |
| Viscosity | η = 0.0648e6.2Cѵ |
| Froude number | 0.9 |
| Manning number | 0.065 |
| Laminar resistance | 2000 |
The topographic surface is based on a Digital Elevation Model (DEM) with a resolution of 12.5 m based on the ALOS PALSAR RTC product, and the computational domain was set with a grid of 15 m in the GDS (Grid Developer System, the interface of FLO-2D model). The results were validated using the fitness function (5) proposed by Spataro et al. (2004):
where:
e 1 is the level of coincidence between the real inundated and the simulated areas. Values up to 1 correspond to a perfect coincidence and values up to 0 are referred to as a complete difference.
RESULTS AND VALIDATION
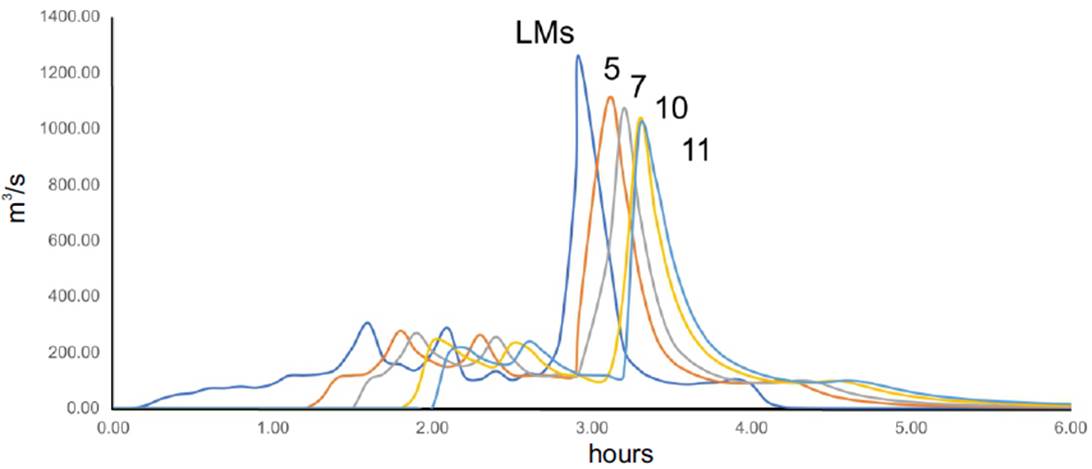
The maximum flow depth and maximum flooded area map obtained from the simulations were compared with the total inundated area delineated from multispectral Planet images (Planet Team, 2017) acquired in February 2016 (with a pixel resolution of 3×3 m) and field observations. The simulated flow reproduces well the total inundated area (Figure 6). The results from applying the fitness function show a value of 0.78, meaning that the inundated area obtained by the simulation reproduced 78 % of the real event. Overestimations were detected mostly in places where the simulated flow laterally overspilled from the channel but with low flow depths (less than 50 cm). This effect was probably due to the DEM (Digital Elevation Model) resolution that was unable to reproduce the channel geometry well. Reliable results were obtained at sites where lahars provoked several damages. For example, at the El Borbollón site (Figures 7a and 7b), the lahar eroded and reached a small house located at the limit of the ravine which then collapsed into the channel. Here, the simulated flow overflowed the left margin of the ravine with a maximum flow depth of ~10 m (Figure 7b). The interstate 16 was severely affected and the lahar inundated and eroded the paved road (Figure 7c and 7d). After a 90-degree bend, the river channel was well confined and the lahar was not able to overflow the road, as reproduced by the simulated flow (Figure 7d). Finally, several profiles were traced to check the maximum flow discharge along the channel for the simulated flow. Values exceeding 1000 m3/s were maintained up to the village of La Becerrera to then decrease at 100 m3/s progressively at the junction with the Armeria river (Figure 8). The main flow fronts of the simulated flow traveled from the monitoring station to the village of La Becerrera in less than an hour.
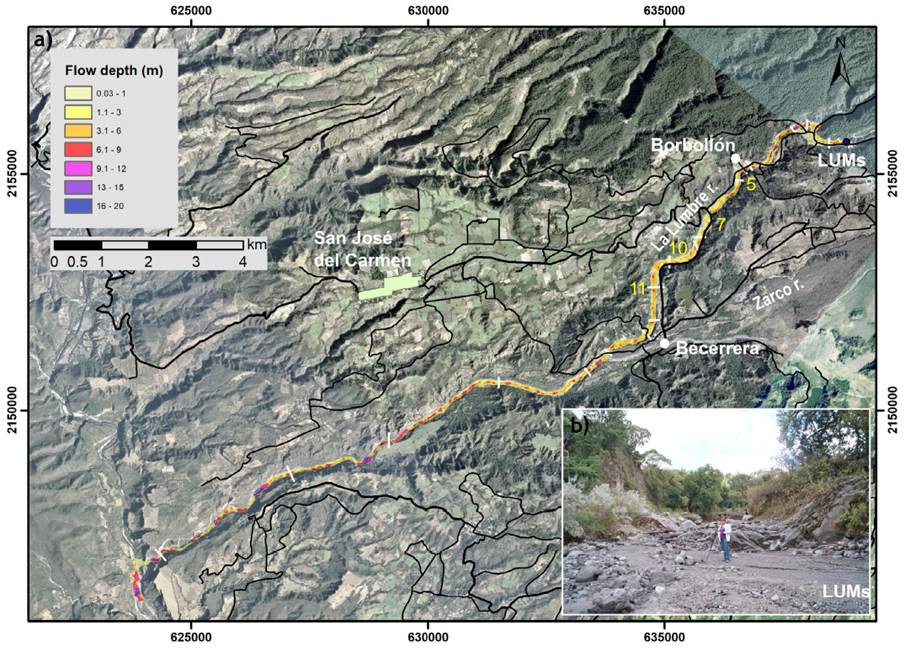
Figure 6 a) Flow depth of the simulated flow obtained with the FLO-2D code. Sections 5, 7, 10, and 11 refer to the flow discharge of Figure 8 (Image projection: Universal Transverse Mercator-UTM). The inset b) refers to the picture of the channel of the La Lumbre ravine at the LUMs monitoring site.
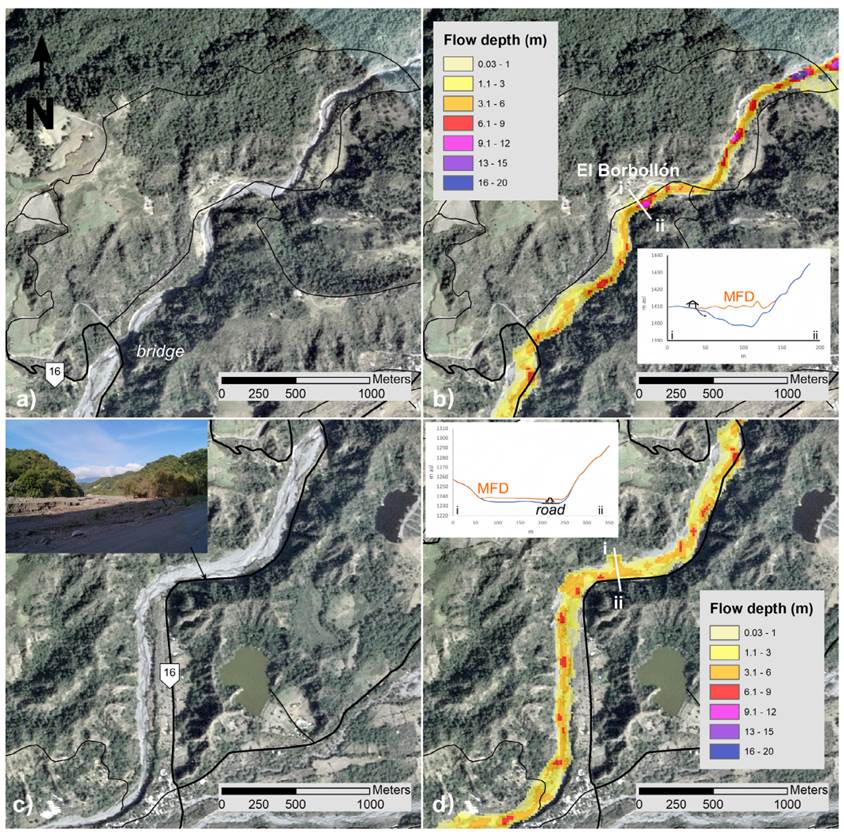
Figure 7 Comparison between the Planet image acquired in February 2016 and the simulated flow at the El Borbollón site (a and b) and along the interstate 16 (c and d) (Image and map projection: Universal Transverse Mercator-UTM). Profiles in b) and d) shows the simulated Maximum Flow Depth (MFD) along these two control points. See Figure 1 for area location.
Hazard assessment for hurricane-induced lahars
The results of the Patricia lahar simulation were used to evaluate the possible impact of a similar event along all the main ravines that drain from the main cone. Hurricane-induced lahars could produce a significant inundation in all these ravines, especially in El Zarco, Montegrande, and Arena (Figure 9). Watershed feeding these ravines are relatively smaller than the La Lumbre, so the flow hydrograph was adjusted to a flow volume equal to 1×10⁶ m3. This value represents an average flow volume for a 1 km2 basin such as Montegrande and Arena (Capra et al., 2019), during a rainfall event of 440 mm and a Cv of 0.3-0.4. In particular, the flow simulated along the El Zarco ravine reproduced well the damage observed at the small bridge along the interstate 16 which was completely destroyed during the 2015 events (Figures 9b and 9d). In the town of San Marcos, where the Arena ravine crosses the inhabited areas, lahars can cause damages to the main street where the bridge crosses the ravine, and close to the hospital. Large lahars could be expected considering the high availability of loose sediments along the Montegrande ravine following the 2015 eruptions. During the 2015 Hurricane Patricia, lahars were detected but these apparently had a low magnitude since a main channel had not been pre-eroded on fresh block-and-ash flow (BAF) deposits, promoting superficial dispersion during flooding. No images were available from the lahar monitoring station at the Montegrande ravine because a cloud of vapor formed from the hot lahars. At present, a well-defined channel is now eroded on m-thick BAF deposits, and lateral collapses during the dry season are feeding the channel with a large volume of loose sediments promoting lahar initiation during rainfall. Indeed, large lahar events have been detected along the Montegrande ravine during seasonal rainfall since 2019 (Figure 9e).
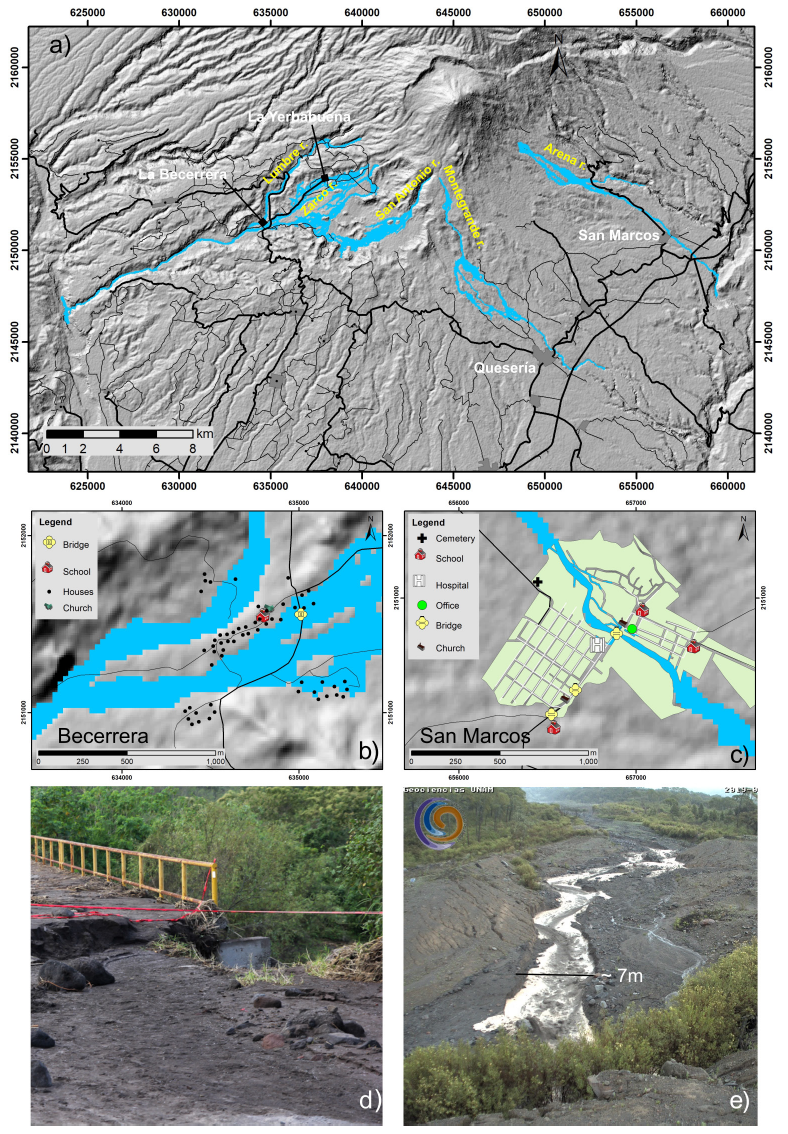
Figure 9 a) Inundation map for hurricane-induced lahars at the Volcán de Colima. Close-up of b) La Becerrera and c) San Marcos towns; d) damaged bridge along the El Zarco ravine; e) picture of a lahar recorded on 24 July 2019 from the monitoring station at the Montegrande ravine. (Maps projection: Universal Transverse Mercator-UTM).
DISCUSSION
The VdC is a natural laboratory for the study of lahars, with up to 40 events per year during the rainy season. The largest events occur during periods of mesoscale rainfall usually related to hurricanes that form along the pacific coast (Capra et al., 2018). The Patricia lahar is probably one of the best examples recorded at the volcano to understand large-magnitude lahars and to evaluate their impact. The Patricia lahar lasted over four hours during which it gradually transformed from hyperconcentrated to debris flows up to 5 m in depth. Its seismic waveform was characteristic of a multi-pulse event such as those described by Vázquez et al. (2016a). The arrival of the main flow fronts corresponded with the three main peaks in amplitude identified in the waveform. These main fronts were related to the maximum values of flow depth, sediment concentration, and hence discharge. The secondary peaks were associated with fluctuations in flow discharge probably accompanied by variations in sediment concentration. The frequency spectrum showed a remarkable main peak at 10.5 Hz and secondary peaks between 18 Hz and 38 Hz (Figure 3). The first maximum coincided with the value reported by Vázquez et al. (2014 and 2016a) for the frequency of main fronts in the sediments range of debris flows; the secondary range could be more likely correlated with the hyperconcentrated flow stages (Coviello et al., 2019), where higher frequencies could be related to turbulence and to clast-to-clast collisions and channel interactions (Figure 3b). It is important to point out that the non-attenuation of the seismic energy was here assumed because of the closeness of the seismic sensor to the channel (Figure 2). With data collected at the VdC so far (Vazquez et al., 2016a , Coviello et al., 2018, Walsh et al., 2020), with sensor deployed at few meters from the channel, frequency ranges are here better constrained for flows with different sediment concentrations (debris flow vs hyperconcentrated flow), respect to the general assumption that lahars spread across a wider range from 5-100 Hz for both hyperconcentrated and debris flows (Marcial et al., 1996; Lavigne et al., 2000; Huang et al., 2004; Cole et al., 2009).
The flow discharge curve reconstructed with scaled images and a mean value for the flow velocity generally coincides with the seismic amplitude confirming that the seismic amplitude depends on the mass and the velocity of the flow (Coviello et al., 2019) and the waveform is proportional to the flow discharge for non-cohesive lahars (i.e., Tuñgol and Regalado, 1996; Suwa et al., 2000, Vazquez et al., 2016a). This correlation is important for early warning systems, but the distance of the seismic sensor from the channel should be always considered since energy attenuation can result in low seismic amplitudes. According to the flow magnitude, duration, and the associated damage, this event probably represents the largest one recorded over the last 20 years and is here used to produce an updated hazard map for lahars at the VdC.
The hazard assessment of the most recent lahars at the VdC includes two main scenarios with volumes of 5×10⁵ m3 and 5×10⁶ m3, the first one representing the most frequent events recorded during the rainy season and the second being based on syn- and post-eruptive lahars associated with the 1913 Plinian eruption (Capra et al., 2019). This former map was obtained using the semi-empirical LAHARZ model (Schilling, 2014). The Patricia lahar was here used to define the maximum inundated area for hurricane-related rainfall using the FLO-2D code, which has the advantage of considering variations in flow discharge, rheology, and sediment concentrations. The new map shows that the occurrence of a hurricane-triggered lahars scenario would represent a severe threat for several towns, ranches, and sugarcane and avocado fields. The map presented here can be combined with previous zonifications to produce a multi-scenario lahar hazard map of the VdC.
CONCLUSIONS
Lahars are among the most frequent phenomena on active and quiescent volcanoes, and early warning systems are required especially in climatic regions with well-defined and intense rainfall seasons. The real time monitoring system implemented at the VdC was evidenced as a very useful tool to define the spatial and temporal variation of a lahar, to infer its magnitude, and to approximate its sediment concentrations. These findings are essential to define seismic threshold for automatic detection, but also fundamental to improve numerical simulations to better define the impact of lahars on infrastructure and inhabited areas. The data obtained here for the Patricia lahar show that a systematic approach to correlate the seismic amplitude and frequency with the magnitude and type of flow can be useful to design an early warning system for active volcanoes with intense lahar activity.

