


 nueva página del texto (beta)
 Inglés (pdf)
 Artículo en XML
 Referencias del artículo
 Enviar artículo por email
 Citado por SciELO
  Similares en
SciELO
Similares en
SciELO 
 Permalink
Introduction
Wastewater treatment plants (WWTP) are systems that integrate a series of physical, biological, and chemical processes systematically established to carry out the removal of polluting elements found in municipal wastewater (MWW) (Noyola et al., 2013). The WWTPs arose from a water stress situation and from the need to increase the water use efficiency. In Mexico, the distribution of operating WWTP has reached a figure of 2642 and 4698 WWTP for MWW and industrial wastewater, respectively (CONAGUA, 2019). A volume of ~141479 MWW L∙s-1 is treated by different processes in the WWTPs, and ca. 30 % bases its operation on the activated sludge method. However, the flow rate treated using this method represents ca. 50 % of the MWW treated in Mexico (CONAGUA, 2019). The choice of MWW treatment using aerobic biological processes (specifically activated sludge) is based on methods efficiency and treatment rate (Noyola et al., 2013).
Unfortunately, one of the main wastes generated by this type of process is the so-called sewage sludge (SS).Tchobanoglous et al. (2003) reported that ca. 0.94 kg of SS (dry basis) are produced when 3.78 m3 of MWW are treated, i.e., 1000 L of MWW treated produce ca. 250 g of SS and the greatest SS generation occurs during primary and secondary treatment within a WWTP. Considering the treated MWW and the relationship established by Tchobanoglous et al. (2003), around 3056 SS Mg∙day-1 are generated in Mexico, i.e., 1.12 million SS Mg∙year-1 (dry basis). Moreover, the addition of chemicals (e.g., lime) for conditioning and stabilization processes during SS production considerably increases the final mass of this waste (Oropeza García, 2006).
Currently, the SS generation and disposal resulting from the MWW treatment carried out by the WWTPs have become one of the major socio-environmental problems within urban areas. Hence, a standard was drawn up to control and regulate sludge and biosolids use and final disposal, NOM-004-SEMARNAT-2002, which contemplates two types of solid waste: sludge and biosolids (SEMARNAT, 2003). The standard defines biosolids as "sludge that has been subjected to stabilization processes and that due to their content of organic matter, nutrients and characteristics acquired after stabilization, may be susceptible to use". Besides, it defines sludge as “solids with a variable moisture content, originating from urban or municipal sewage systems unclogging, from water treatment plants and from wastewater treatment plants, which have not been subjected to stabilization processes”. In Taxco de Alarcón, Guerrero, Mexico, recently the WWTP “Taxco de Alarcón” started operations in 2016. The maximum installed capacity is to treat a MWW flow of 100 L∙s-1, i.e., 8640 m3∙day-1 (CONAGUA, 2017). From this, the estimated amount of SS produced is ca. 2.16 Mg of SS day-1 (dry basis) taking as a calculation basis the value reported by Tchobanoglous et al. (2003). These wastes, as in most WWTPs constitute a final disposal problem. Thus, a strategy is sought for the final disposal of the SS and to prevent them from becoming a severe problem.
Nowadays, agricultural soils have suffered fertility decline due to intensive management production, as well as the scarce or absent conservation agriculture (Vega-Carreño and Febles-González, 2005). Consequently, it has generated an increase in the global demand for fertilizers (Patel et al., 2020). Nevertheless, one of the main disadvantages of applying synthetic fertilizers to increase crop production is their high cost (Gallardo et al., 2009). An attractive characteristic of the SS is the high amount of nutrients that they present, e.g., total nitrogen, organic nitrogen, total phosphorus, available phosphorus, calcium, magnesium, sodium, and potassium in an average percentage of 4.46, 4.31, 1.59, 0.11, 1.18, 0.24, 0.40, and 0.19 %, respectively (Ortiz-Hernández et al., 1995). Besides, they have a high moisture content and organic matter (Ortiz-Hernández et al., 1995). Therefore, in regions with eroded soils or with low organic matter content, the use of SS as a soil conditioner is better than the application of synthetic fertilizers and depicts one interesting and acceptable ways of biosolids disposal (Salcedo Pérez et al., 2007; Vásquez Aleman and Vargas Martínez, 2018). Also, to reduce the application of synthetic chemical fertilizers and their associated effects, some developing countries have decided to adopt dispersing the SS in agricultural soils (Ottaviani et al., 1991). The use of SS in nutritionally worn or eroded soils improves their physicochemical and microbiological characteristics. Its use decreases the soil bulk density, favors aggregate formation and stability, increases the organic matter content, moisture retention and pore size, microbial activity, and nitrogen and phosphorus content. All these characteristics mentioned are part of a fertile soil (Tester, 1990; Canet et al., 1996; Salcedo Pérez et al., 2007).
Campos Medina et al. (2009) evaluated the potential of using SS as quality enhancers of nutritionally depleted soil. The SS used received an alkalinization pretreatment to stabilize them. Then, SS composition was subject to analysis. The analysis showed that the SS used had a high content of nutrients feasible to incorporate into eroded soils. On the other hand, Vásquez Aleman and Vargas Martínez (2018) directly used SS to evaluate the growth of edible crops, such as Lactuca sativa and Daucus carota, lettuce, and carrot, respectively, during 120 days. However, using SS for direct consumption crops represents a health risk to human population. Thus, there are alternatives crops with a commercial interest that could be cultivated directly on SS without direct health risk, e.g., Panicum maximum better known as mombaza grass (MG). It is a forage grass used as a food source for cattle in tropical grasslands. Cattle production is a principal economic activity in Mexico, especially in northern states (Moral Barrera and Murillo Villanueva, 2015). MG constitutes an important source of low-cost nutrients compared to other food sources (Minson, 1990; Mendoza Martínez and Ricalde Velasco, 2016). Therefore, this work aimed to evaluate the growth capacity of Panicum maximum, also known as MG using SS generated within the "Taxco de Alarcón wastewater treatment plant" as substrate.
Materials and methods
Study site
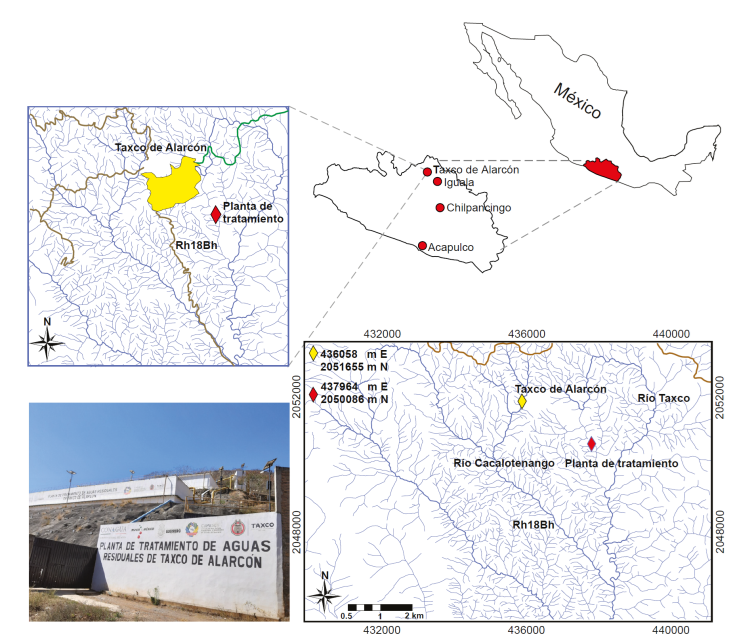
Taxco de Alarcón wastewater treatment plant is located in the northern zone of Guerrero state, in the Municipality of Taxco de Alarcón between coordinates 437964 m E and 2050086 m N (UTM coordinate system), within the INEGI topographic chart Taxco scale 1:50000 (E14-A68). It is located within the hydrological region No. 18 (HR 18) Balsas Region, Balsas-Mexcala Basin. The WWTP treated effluent is reincorporated to the Taxco River, and at a distance of ~ 21 km, it joins to Cacalotenango River (Figure 1).
Experimental design
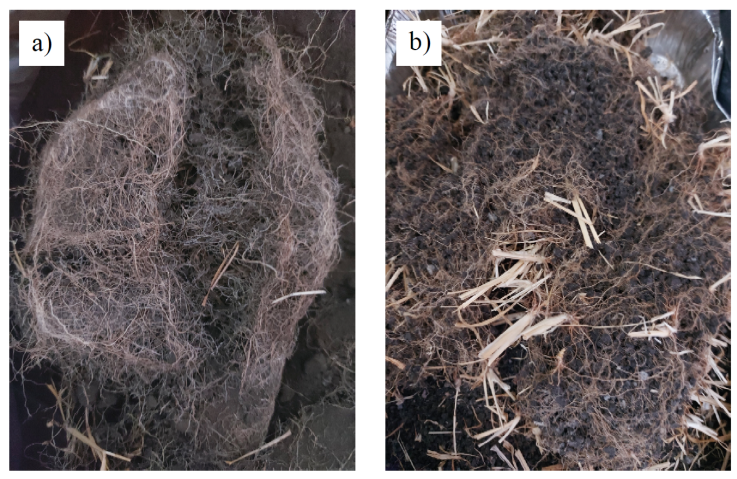
Aluminum trays with dimensions of 45×34×6 cm were used as a seedbed for the MG. Each tray was washed three times using drinking water. Afterwards, 5 kg of SS previously weighed on an analytical balance were placed inside it, and 4 g of weighed MG seed were dispersed on the surface. An analytical balance (OHAUS brand, explorer model) was used. This seeding procedure was carried out by triplicate. As a control, a pattern soil (PS) was used on which MG was seeded and subjected under the same experimental conditions. The dehydrated SS were sampled from the “Taxco de Alarcón wastewater treatment plant” in a site destined for their internal disposal. The PS was purchased at a departmental store. It is an ecological, commercial fertilizer brand. The PS specifications indicate that it is a composted soil obtained from natural materials and organic waste from fruits and vegetables. It has a dark color and compacted appearance, unlike the SS, which have a grayish and porous appearance (Figure 2).
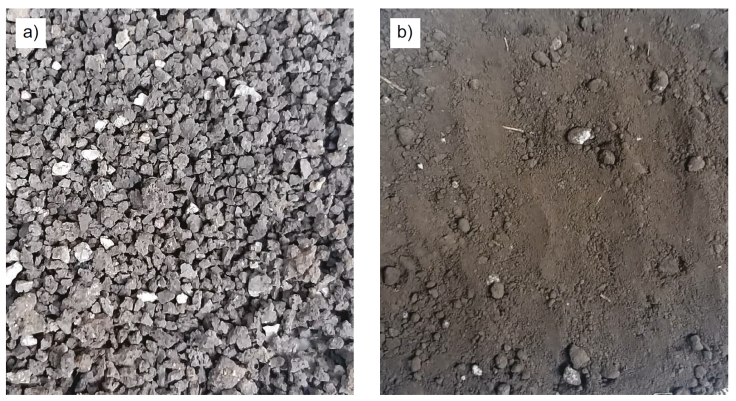
Figure 2 General view of the substrates used for the cultivation of Mombaza grass: a) dehydrated sewage sludge and b) pattern soil.
The seedbeds were placed in a greenhouse. In the beginning, the SS and PS substrates were fully hydrated using 4 and 1 L of drinking water, respectively. The difference in water volume used was due to the initial moisture content of every substrate. After this, each seedbed was hydrated daily with 1.5 L of the same water quality. The drinking water used for irrigation was purchased from a drinking water purifier located in Iguala, Guerrero. The water quality was evaluated previously and met with the NOM-127-SSA1-1994 (Ramírez Mata and Flores Real, 2008). The treatment method used for the drinking water purifier has remained the same.
Three different harvests of MG were carried out. Each one was at 30 days cutting approximately 1 cm from the base of the MG growth. Each seedbed content of SS and PS was taken for analysis after each harvest. For MG, the response variables analyzed were germination time, growth rate (Gr MG ), height (H MG ), and yield (Y MG ), whereas for SS and PS, the organic matter content was analyzed. Additionally, a chemical composition analysis of MG, SS, and PS was carried out through scanning electron microscopy and X-ray energy dispersion spectroscopy (SEM-EDS).
In this study, the experimental design was completely randomized. The experimental model comprises a single factor, that is, the influence that the two substrates SS and PS have on Gr MG , H MG , and Y MG .
Mombaza grass, sewage sludge, and pattern soil sampling
The sampling was carried out every 30 days. The MG was carefully harvested from each sown bed using a razor to avoid detaching the grass from the roots. The harvested MG was placed in Ziploc® bags and hermetically sealed. Afterward, the MG was dehydrated by direct exposure to sun heat for 6 hours. This process was executed during the three hottest months in Iguala de la Independencia: March, April, and May, where the temperature recorded were 36.5, 37.9, and 37.3 °C, respectively (https://es.climate-data.org/america-del-norte/mexico/guerrero/iguala-3422/?amp=true). Then, the MG samples were stored for analysis; meanwhile, each sampling, the total substrate (SS and PS) contained in one seedbed was recovered as a sample and deposited in hermetically sealed plastic bags. They were dried under the same conditions established for MG and later were analyzed.
Analysis
Moisture content and porosity determination
The initial moisture content determination of the substrates was achieved by gravimetry. A mass of 20 g of SS and PS previously weighed using an OHAUS brand analytical balance (navigator model) were placed into porcelain capsules of known mass. Subsequently, the capsules were placed in an oven at a temperature of 105 °C. Dehydration was performed until the weight of the samples remained stable. The moisture content (Hu) percentage was determined by using Equation 1.
where m i depicts the SS or PS initial mass (g) and m f the SS or PS final mass (g). The substrates initial moisture content was determined by duplicate.
The porosity for each substrate was calculated by Eq. 2 using the bulk density and particle density (Sánchez-Vera et al., 2003).
where the porosity is expressed in %, bulk density, and particle density in g∙cm-3. The bulk density was determined using Equation 3, whereas the particle density was calculated using Equation 4. Both values were determined by triplicate.
where bulk density is expressed in g∙cm-3, substrate dry mass in g, and substrate volume in cm3.
where particle density is expressed in g∙cm-3, substrate mass in g, and substrate volume in cm3.
Mombaza grass germination time, height, growth rate, and yield calculation
The germination time was determined by measuring from the sowing of the MG seed until the appearance of the first germination shoots in each substrate. On the other hand, the H MG was measured weekly using a scaler. From this data, it was possible to determine the Gr MG , using Equation 5.
where Gr MG depicts the MG growth rate (cm∙day-1), H MG the MG height (cm), and t the time to reach the corresponding height (days). On the other hand, the Y MG was obtained from the monthly harvested mass of MG for each substrate per unit area (Equation 6).
where Y MG represents the MG yield per month (MG g∙m-2), m MG the MG dry mass (g) harvested every 30 days, and A the sowing area (m2).
Prior to statistical analysis, normality and homogeneity of variances were evaluated for HMG, GrMG, and YMG using a Shapiro-Wilk test (p > 0.05). After this, a paired t-test was used to compare the means for the variables before mentioned among PS and SS during the experiment. All the differences were statistically significant when p ≤ 0.05.
Organic matter and removal quantification
Organic matter (OM) analysis was performed in duplicate for SS and PS. A mass (W) of ~5 g was brought to 105 °C for 2 hours to remove moisture and obtain weight 1 (W 1 ). Once W 1 was determined, the samples were heated at 450 °C for 2 hours in the muffle and the weight 2 (W 2 ) was recorded (Handbook, 1992). The OM content was determined by Equation 7.
where OM represents the organic matter content (%), W is the initial mass of the sample, W 1 the dehydrated mass (g) of the sample, and W 2 the calcined final mass (g).
From the OM content, the organic matter removal (η OM ) was estimated at the end of each cultivation period using Equation 8.
where η OM represents the organic matter removal (%), OM 1 the initial organic matter content (g), and OM 2 the final organic matter content (g).
Chemical composition analysis of mombaza grass, sewage sludge, and pattern soil
From previously dehydrated samples, a mass of ~5 g of MG, SS, and PS was pulverized using a mortar with a pestle until obtaining a thin and homogeneous powder, < 0.063 mm. Afterwards, the MG, PS, and SS chemical composition determination was carried out. The procedure was performed using a mass of ~10 mg of each sample. It was placed in an aluminum sample holder with double-sided graphite tape. The sample was covered with graphite using the thermal evapo ration of carbon. The device utilized for this purpose was a Denton Vaccum brand coater, Desk Carbon Accessory model. The analyzes were carried out using a SEM JEOL IT300-LV equipment, with an EDS Bruker, Quantax: Xflash 6/30.
The SEM-EDS working conditions were escape angle at 35°, 20 keV, and WD = 10 ± 0.5 mm. The chemical mapping was carried out for 60 min in an surface area of ~3.5 mm2.
The SEM-EDS analysis were carried out at Laboratory of Scanning Electron Microscopy and Microanalysis of the Autonomous University of Guerrero.
Results and discussion
Moisture content in pattern soil and sewage sludge
Table 1 shows the initial average moisture present in the substrates used to germinate MG. It is observed that the PS presented a higher moisture content, ca. 15 % more than SS.
Table 1 Moisture content of pattern soil and sewage sludge used for the cultivation of Mombaza grass.
| Substrates | Average moisture (%) |
|---|---|
| Pattern soil | 19.93±0.01 |
| Sewage sludge | 5.45±0.04 |
Data are presented as mean ± standard error (n=2).
In economic terms, the moisture content in the SS is not a problem. The SS constitutes a waste generated by the WWTPs, therefore, its acquisition has not cost. In this sense, the production costs of the MG would not increase with the use of this nutritional source. However, in the case of using PS or another nutritional additive, it is necessary to consider its monetary value in the total production costs of the MG. Additionally, the variation of the moisture content in the PS affects the purchase price. In this work, 1 kg of PS was purchased at $6.00 MXN.
Mombaza grass germination time, height, and growth rate
The MG germination time in the two substrates used was notably dissimilar. The first germination shoots were observed in the seedbeds using PS as substrate. That happened five days after the MG seeds had sown. On the other hand, using SS as a substrate, the first germination shoots were observed until day 7. These values indicate that the germination of MG using PS requires less time, i.e., the difference among MG germination in the substrates was 2 days. On the other hand, Figure 3 shows the height reached by the MG during the first month of growth. During the first two weeks, it was observed that the H MG grown in PS was slightly higher than the height reached by the MG grown in SS. However, from the third and fourth weeks, the H MG showed a favorable change for the SS. The H MG grown in SS exceeded considerably the height reached in the PS. At the end of the first month, the maximum MG heights reached were 20 and 7 cm in SS and PS, respectively, i.e., the maximum H MG reached in SS was 2.85 times higher than the H MG reached in PS. These differences among both treatments were significant only for weeks 3 and 4 according to the paired t-test (third week: t = -6.348, p = 0.002; fourth week: t = -3.243, p = 0.017).
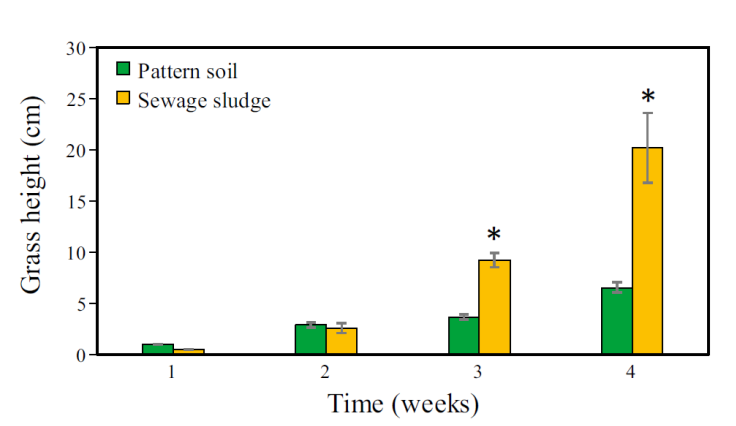
Figure 3 Average height of Mombaza grass plants cultivated on pattern soil and sewage sludge during the first month of experimentation. The asterisk (*) means significant difference (paired t-test, p <0.05) and vertical bars indicate the standard error.
Unlike the first month (Figure 3), in the second and third months (Figure 4), the initial H MG reached during the first week of every month by the MG grown in the SS as substrate was higher than the H MG reached in PS. This behavior is attributed to the fact that the germination factor was eliminated in these months. That is, the monitoring of the height in these months was from previously germinated MG crops.
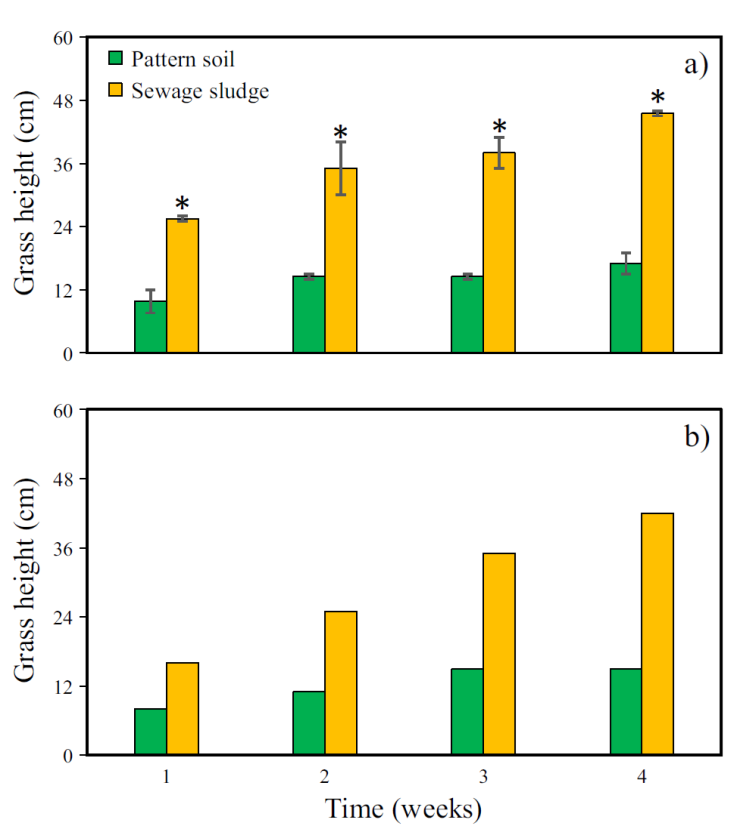
Figure 4 Average height of Mombaza grass plants cultivated on pattern soil and sewage sludge during the a) second and b) third month of cultivation. The asterisk (*) means significant difference (paired t-test, p <0.05) and vertical bars indicate the standard error.
In the second month, a linear tendency to increase the height was observed over time in the case of MG grown on SS (Figure 4a). The equation that describes this behavior is y = 6.3x + 20.25 (R² = 0.9657). However, in the case of MG grown in PS, the tendency to grow was lower, i.e., the slope of the growth curve was lower. This can be observed from the equation that describes this behavior y = 2.16x + 8.55 with R² = 0.8599.
This behavior is attributed to the fact that the MG cultivated on PS began gleaning from the third week of culture, affecting its growth (Figure 5). The H MG of the four weeks belonging to second month was significantly higher in SS compared to PS (paired t-test: p ≤ 0.05).
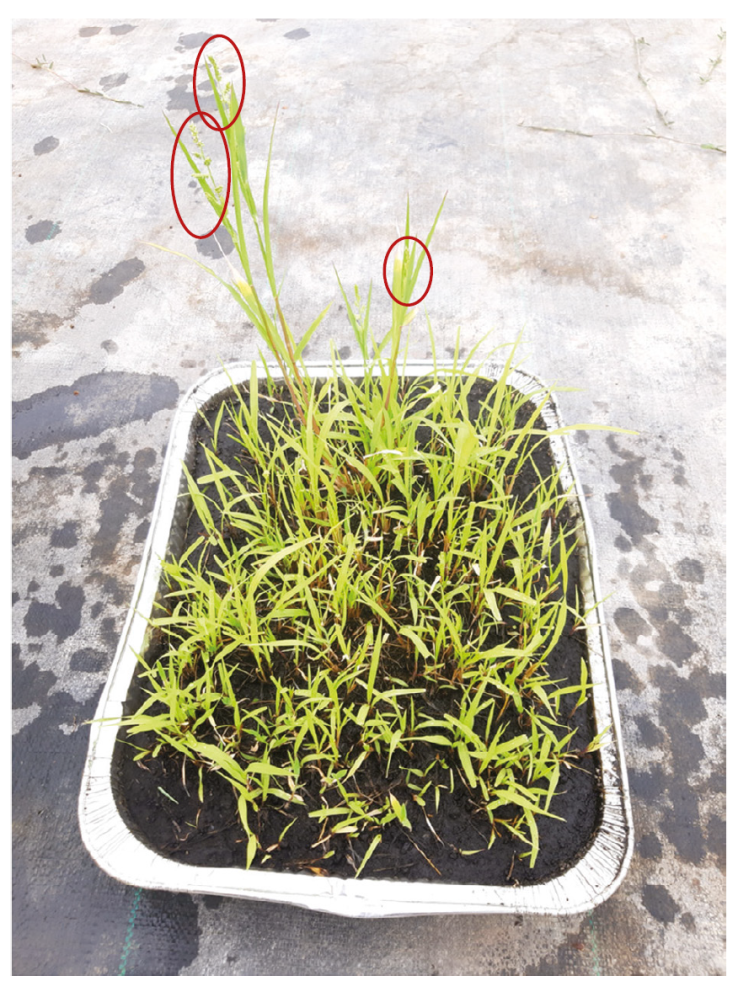
Figure 5 General view of the gleaning of Mombaza grass cultivated on pattern soil observed from seventh week of cultivation (second month).
Soil quality is an important variable in the constitution of plant growth. However, climatic conditions (photoperiod, temperature, and humidity), annual seasons, and even management practices are also responsible for altering plants' flowering and fruiting periods (Velasco et al., 2018). One work carried out to evaluate grass production, dependent on defoliation frequency and height, showed that they also alter flowering (Febles et al., 2009; Márquez, 2014; Velasco et al., 2018). Once the grass is cut or harvested, a metabolic readjustment is generated that promotes a new leaf area formation. The purpose is to reestablish the plant's photosynthetic capacity; this, in turn, could promote flowering if the shoots are large enough or old (Febles et al., 2009). In this work, both crops were carried out under the same climatic and management conditions, therefore, the quality of the PS might be the main factor that caused the growth of MG to stagnate, reaching a plateau at a maximum height of 17 cm. On the other hand, in this second period, the maximum H MG reached in SS was 45 cm (Figure 4a). The H MG cultivated in SS was 2.64 times higher than the recorded in PS.
Finally, in the third month of cultivation, the H MG showed a similar behavior to that of the second month (Figure 4b). The growth curves were y = 8.8x + 7.5 with R² = 0.9954 and y = 2.5x + 6 with R² = 0.8993 for MG grown on SS and PS, respectively. In the third month, the maximum height observed was 42 and 15 cm for MG grown in SS and PS, respectively, i.e., the H MG grown in SS was 2.80 times higher than the height recorded in PS. Additionally, the monthly H MG reached in each substrate is shown in Figure 6. The MG heights among PS and SS were significantly different, both in the second (paired t-test: t = -8.216, p = 0.003) and third month (t = -4.238, p = 0.024).
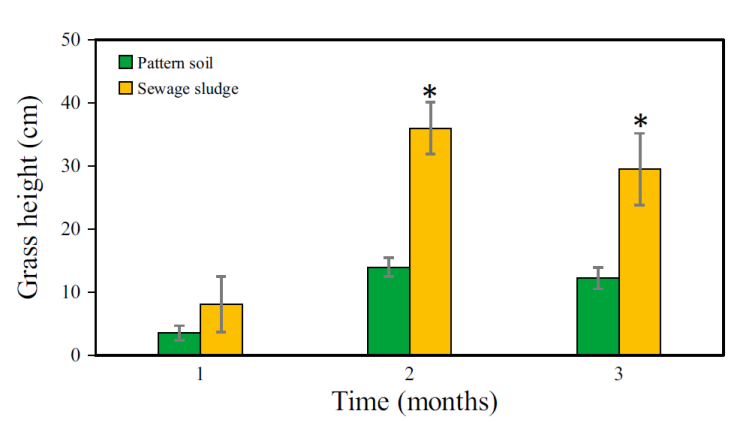
Figure 6 Monthly average height of Mombaza grass plants cultivated on pattern soil and sewage sludge. The asterisk (*) means significant difference (paired t-test, p <0.05) and vertical bars indicate the standard error.
The Gr MG was another important factor that was analyzed. The Figure 7 shows the Gr MG determined weekly during the MG cultivation. In the first week of the first month, Gr MG was higher in PS. This was because of the MG in PS presented a shorter germination time compared to SS. However, from the second week on, the Gr MG observed in SS began to grow linearly with time. In the fourth week, the first harvest or cut of the MG grown in both substrates was carried out. During the first week of the second month, the MG reached its maximum Gr MG in each substrate. In case of the MG grown on SS, the maximum Gr MG reached was 3.64 cm∙day-1 whereas in PS it was 1.40 cm∙day-1. In the following three weeks, Gr MG showed a tendency to decrease in both crops. It was observed that as the H MG increased, the Gr MG decreased (Figure 4 and 7). Finally, in the third month of cultivation, the Gr MG showed a similar behavior to that of the second month. The Figure 8 shows the monthly Gr MG . A paired t-test showed that the monthly Gr MG among PS and SS were statistical different in the second (t = -3.287, p = 0.044) and third month (t = -13.98, p = 0.000).
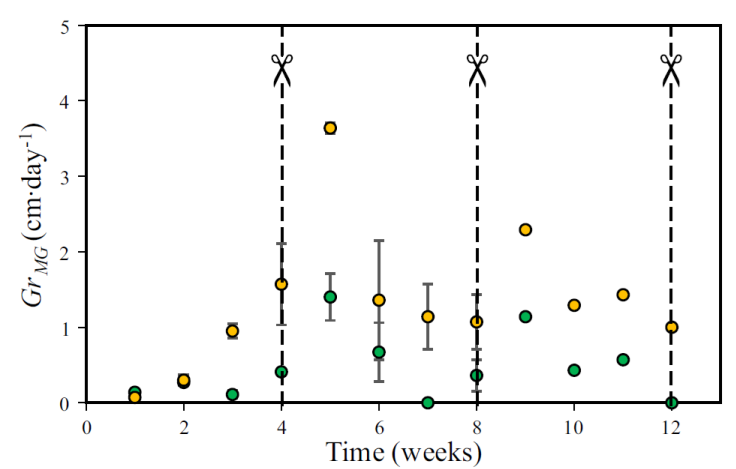
Figure 7 Average growth rate of Mombaza grass plants (Gr MG ) cultivated on pattern soil (presented with green circles) and sewage sludge (presented with yellow circles). The scissors indicate Mombaza grass plants harvest. Vertical bars indicate the standard error.
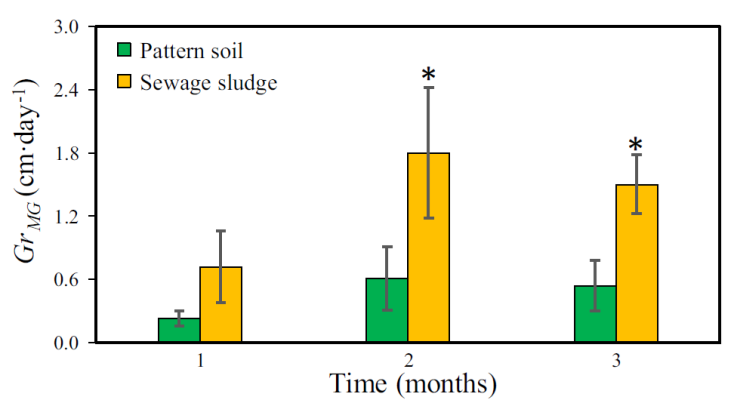
Figure 8 Monthly average growth rate of Mombaza grass plants (Gr MG ) cultivated on pattern soil and sewage sludge. The asterisk (*) means significant difference (paired t-test, p <0.05) and vertical bars indicate the standard error.
The environmental temperature and those of the substrates was monitored during MG cultivation (Figure 9). In general, the environmental temperature was higher, in a range of 34 - 42 °C during the twelve weeks of experimentation. This recorded temperature is within the range established for the optimal growth temperature for MG: tropical climate. This climate characterizes by a monthly average temperature of ~24 °C and no frosts. Also, in the arid tropical climate, temperatures of 40 °C can be recorded, similar to those reached in this experiment (Papadakis, 1980).
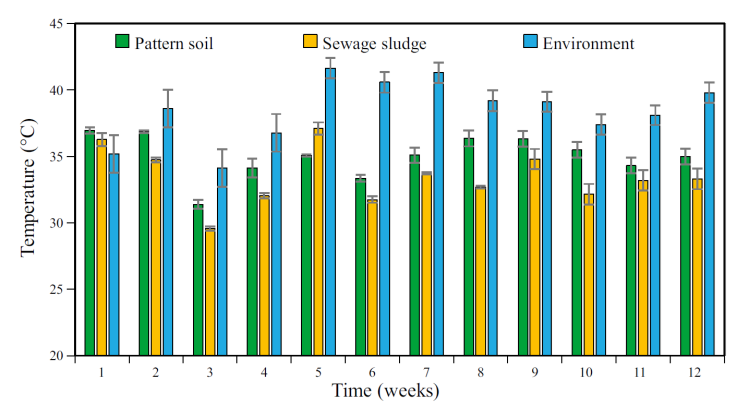
Figure 9 Mean temperature of pattern soil, sewage sludge, and environment throughout the three-month period of Mombaza grass cultivation. Vertical bars indicate the standard error; n=2.
On the other hand, in the first week of cultivation, it was observed that the temperature in both substrates was higher than that recorded in the environment. This is attributed to the fact that there was not a considerable H MG that prevented the supports from absorbing heat.
The environmental temperature was higher than the temperature measured directly on the supports from the second week on. It can be because each substrate already presented a significant MG growth density. Another aspect to highlight is that, in general, the PS temperature was always higher than the temperature determined in SS. The heat capacity of the substrates, related to the amount of water that each one retains can be the main reason because of this difference in temperatures was observed. The PS has a noteworthy effect absorbing water, whereas in SS the water percolates to the bottom of the seedbed. The PS has a silty structure, and the water retention phenomenon is larger than SS. A 60 % of the particles size of PS were <0.125 mm. On the other hand, the SS has a sandy structure (84 % of particles have a size >1 mm and 14.5 % have a size between 0.5 and 1 mm) and the porosity is bigger than the porosity observed by PS, 60 and 38 %, respectively. Thus, the defined structure present in PS leads to retaining more water in the porous space whereas the SS does not have a defined structure (Figure 2). Also, the porous structure and composition of SS promoted the evapotranspiration process. In PS the evapotranspiration phenomenon was noticeable lower than SS (Figure 2). In other words, the presence of water in the substrates affects their ability to absorb and/or release heat. Unlike other materials, water has a high heat capacity value. The heat capacity of water is 4187 kJ∙m-3 °C-1, and its specific heat 1000 cal (kg °C)-1. Specific heat represents the amount of heat that water requires to raise its temperature by one degree (AQS, 2005).
Mombaza grass yield
The Y MG was calculated monthly (Figure 10, Table 2). The first month showed a maximum Y MG of 30 and 146 MG g∙m-2 in PS and SS, respectively. In the first month, both crops needed about a week to germinate. For this reason, the Y MG was lower compared to subsequent months. From the second month on, the MG on SS showed a Y MG significantly higher than that observed in PS. It reached an average Y MG of 416 MG g∙m-2 whereas PS reached an average Y MG 72 MG g∙m-2. In the case of the MG cultivation on PS, in the second month the grass began to glean, this phenomenon affected the H MG and Gr MG and consequently the Y MG . The Y MG values obtained from months 1 and 2 were analyzed using a paired t-test, which showed a statistically significant difference among SS and PS (p < 0.05). The third month was not possible to analyze because of the absence of replicates. However, in the third month, the H MG and Gr MG values for MG cultivated in SS showed significant differences with the values obtained for the MG cultivated in PS (Figure 6 and 8). Moreover, the Y MG depends on variables such as the H MG and Gr MG . Therefore, the Y MG value for third month showed by MG cultivated in SS would represent a difference statistically significant.
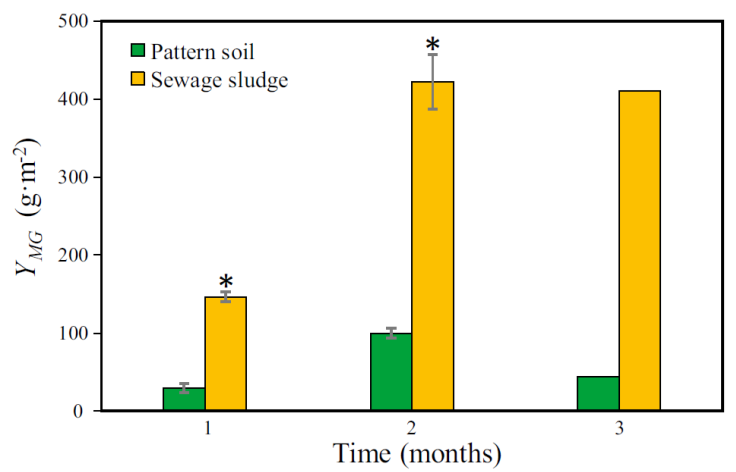
Figure 10 Monthly average yield of Mombaza grass plants (Y MG ). The asterisk (*) means significant difference (paired t-test, p <0.05) and vertical bars indicate the standard error.
Table 2 Monthly average and cumulative yields of Mombaza grass cultivated on pattern soil and sewage sludge for a 3-month period.
| Time (month) | Mombaza grass yield (g∙m -2 ) | |
|---|---|---|
| Pattern soil | Sewage sludge | |
| 1 | 29.63±6.05 | 146.41±6.18 |
| 2 | 100.00±5.88 | 421.90±34.97 |
| 3 | 44.44 | 410.46 |
| Cumulative total | 174.07 | 978.77 |
Data are presented as mean ± standard error; n=3 and 2, for month 1 and 2, respectively.
On the other hand, the Y MG accumulated throughout the three months of cultivation was calculated (Table 2). The results showed a cumulative Y MG ca. 1.0 MG kg∙m-2 using SS as substrate whereas in PS the Y MG was 174 MG g∙m-2.
Organic matter removal
Throughout the MG cultivation time the OM content was monitored. It was determined that the initial OM content in the evaluated substrates were 36 and 15 % for SS and PS, respectively. This difference in OM content is one of the factors related to the quality of the substrate that could have affected the growth of MG in the PS. In terms of η OM determined for PS, it was practically not observed. This value is consistent with the observed Y MG (Table 2). On the other hand, a significant η OM was observed in SS (Table 3). Once again, this value was closely related to the estimated monthly and quarterly Y MG (Table 2). In general, the cultivation of MG on SS contributes with the η OM reached in SS, ca. 12 %. Nevertheless, it is important to consider the OM natural degradation. It is another factor that contributes with the η OM in soils. The substrates used showed a bulk density of 0.4217±0.0218 and 0.5313±0.0150 g∙cm-3 for PS and SS, respectively. The SS depicts a high and major porosity than PS, 60 and 38 %, respectively. The sandy soils such as SS substrate have a better aeration than PS. Hence, the rate of organic matter decomposition influences by chemical and microbial processes in SS is bigger than PS (Clapp et al., 1986). Thus, the major η OM reached by SS was expected (Terry et al., 1979).
Table 3 Percentage of organic matter removal in pattern soil and sewage sludge throughout the cultivation period of Mombaza grass.
| Time (month) | Organic matter removal (%) | |
|---|---|---|
| Pattern soil | Sewage sludge | |
| 1 | 0 | 11 |
| 2 | 10 | 4 |
| 3 | 2 | 3 |
The removal value shown by SS (ca. 12 %) indicates that there is still enough OM that can be used to cultivate MG and that the crop can continue to be growing and obtain similar Y MG to the values obtained if the physical space for the root growth was not limited.
It has been reported, the OM from SS exert significant influence on the physical, chemical, and biological properties of soils. The OM improves the soil's productive capacity, and its structure in terms of porosity and bulk density. Also, the water, air, and heat transmission are impacted. Finally, the soil strength is modified and translated into desirable physical conditions (Clapp et al., 1986). Nevertheless, a detailed chemical analysis must be carried out to know the SS composition prior to agricultural soils application. This type of analysis will prevent the dispersion and accumulation of potentially hazardous compounds such as trace heavy metals and toxic organic compounds (Clapp et al., 1986; González-Flores et al., 2011).
In addition to the previously described important aspects, another difference was observed in the MG cultures: the coloration grass. The MG grown on PS showed a solid green color. In contrast, the MG grown on SS showed a yellow coloration. The yellow color emergence in the leaves of MG is known as chlorosis (Durán Quiroz et al., 1998). This phenomenon originates in the leaf tissue due to the lack of chlorophyll. There are several causes associated with this color deficiency. Some of them are insufficient drainage, damaged roots, compacted roots, high alkalinity, and nutritional deficiencies of the plant. Nutritional deficiencies can occur because the soil is not rich in nutrients or nutrients are not available. Nutrients such as Ca, Mg, Co, Cu, Fe, Mn, Mo, and Zn can be present, although associated to five fractions according to a classification established by Tessier et al. (1979) for particulate trace metals. The particulate trace metals associated with fraction 1 (exchangeable) can be released by a simple change in water ionic composition, whereas the fraction 2 (bound to carbonates) is a pH function. A slightly acid rain phenomenon can lead the trace metals releasing (Krauskopf and Bird, 2003). The particulate trace metals associated with fraction 2 can be released when the environmental conditions reach a pH value between 6.5-7.5. In fraction 3, the particulate trace metals are bound to iron and manganese oxides and under anoxic conditions they are thermodynamically unstable (low Eh value). On the other hand, the particulate trace metals bounded with organic matter (faction 4) requires oxidizing conditions to release soluble nutrients through the organic matter degradation. The SS usually can contain large quantities of trace metals associated to organic matter and the organic matter oxidation control their release (Clapp et al., 1986). Finally, the particulate trace metals associated with fraction 5 (residual) are not expected to be released in solution. The releasing of particulate trace metals from fraction 5, needs conditions normally not encountered in a natural environment. In other words, the nutrients solubility and geodisponibility such as particulate trace metals are in function of environmental conditions (Tessier et al., 1979; González-Flores et al., 2011). Fe, Zn, or Mn inadequacy can cause the chlorosis phenomenon (Oliveira Prendes et al., 2006). Alvira Serrano (2019) carried out a chemical-mineralogical characterization of SS of the Taxco de Alarcón WWTP. In his research results, he reported a pH of 7.1 for the SS and total concentrations of 19.38, 3.13, and 1.83 g of Fe, Zn, and Mn per kg of SS, respectively. However, in fraction 4, concentrations of 6.25, 0.70, and 0.20 g per kg of SS were found for Fe, Zn, and Mn, respectively. Also, in fraction 3, important concentrations were reported: 0.13, 0.70, and 0.50 g per kg of SS for Fe, Zn, and Mn, respectively. Finally, in fractions with major geodisponibility (fractions 1 and 2), the sum reached the following values: 4.33, 1.72, and 1.14 g per kg of SS for Fe, Zn, and Mn, respectively. Hence, pH and availability of nutrients could not be part of the reasons that cause chlorosis in the MG grown in SS.
In the case of PS, the growth of MG kept a relationship with the quantity and size of the roots, i.e., the growth of the roots was abundant, fibrous, or fasciculate and they developed near the surface (Figure 11a). In the case of MG grown in SS, its roots were thicker and longer. Root mass per unit area was lower in SS. The roots dispersed in all directions within the SS. The length of these roots extended to the seedbeds depth where a drainage system was lacking (Figure 11b). In this area, due to the texture of the SS (sandy structure) and porosity (60 %) when the water irrigation was carried out, the water infiltrated and accumulated mainly at the bottom. From this, the MG cultivated in SS developed roots longer than in PS. Thus, the main cause of chlorosis observed in MG grown in SS can be related to the drainage lack in seedbeds.
Pattern soil and sewage sludge chemical analysis
The chemical analysis by SEM-EDS on PS showed the presence of the following elements considered as macronutrients for plants P, K, Ca, Mg, and S (Figure 12a). Also, other elements such as Cu, Cl, Na, Al, Ti, Fe, Si, and O were identified, of which Cu, Cl, Al, and Fe are part of the micronutrients of plants (Figure 12b, c). The combination of essential elements, macro, and micronutrients with sunlight, are the requirements for the correct metabolic development of plants (Kathpalia and Bhatla, 2018). On the other hand, Figure 13a shows all the macronutrients detected in SS (P, K, Ca, Mg and S). Additionally, in this substrate Cu, Fe, Ti, Si, Al, Na, Mn, and Zn were detected. From them Cu, Fe, Al, Mn, and Zn are part of the group of micronutrients for plants (Figure 13b, 13c). In nutritional terms, it was observed that SS and PS contain the same macronutrients. However, in terms of micronutrients, Mn and Zn were detected only in the SS, elements that were not detected in the PS. On the other hand, in SS the presence of Cl was not detected, whereas in PS it was detected.
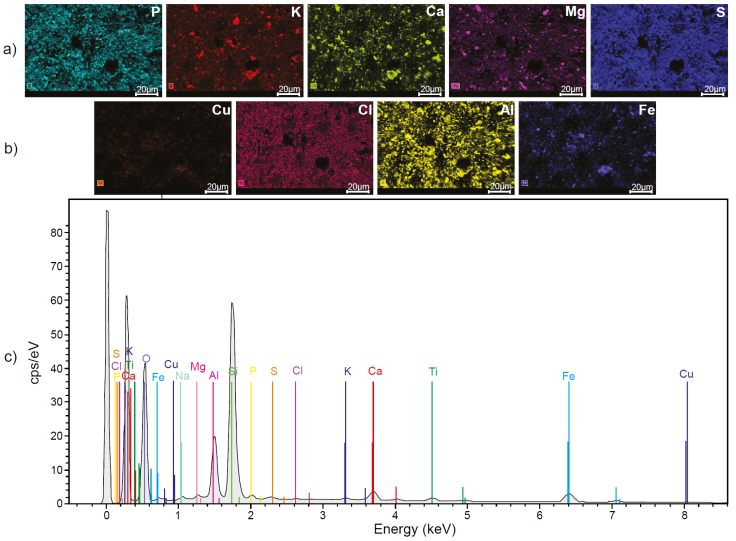
Figure 12 Chemical composition of the pattern soil used for the cultivation of Mombaza grass determined by scanning electron microscopy and X-ray energy dispersion spectroscopy, where the presence of a) macronutrients; b) micronutrients; and c) the full spectrum of all identified elements can be appreciated.
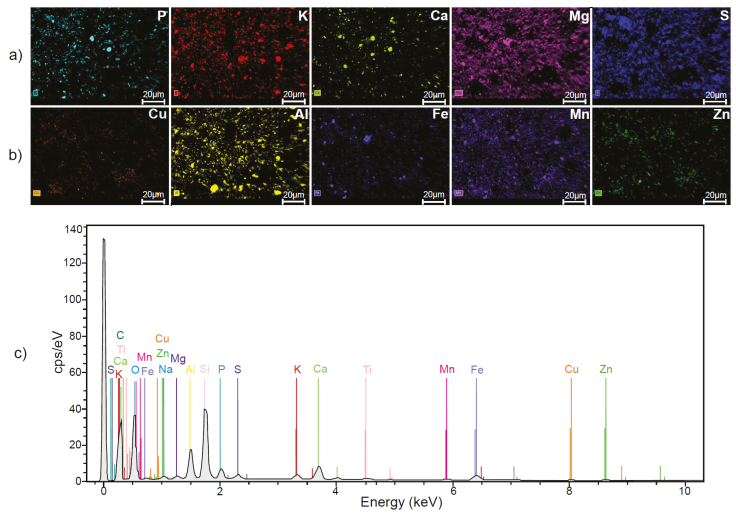
Figure 13 Chemical composition of sewage sludge used for the cultivation of Mombaza grass determined by scanning electron microscopy and X-ray energy dispersion spectroscopy, where the presence of a) macronutrients; b) micronutrients; and c) the full spectrum of all identified elements can be appreciated.
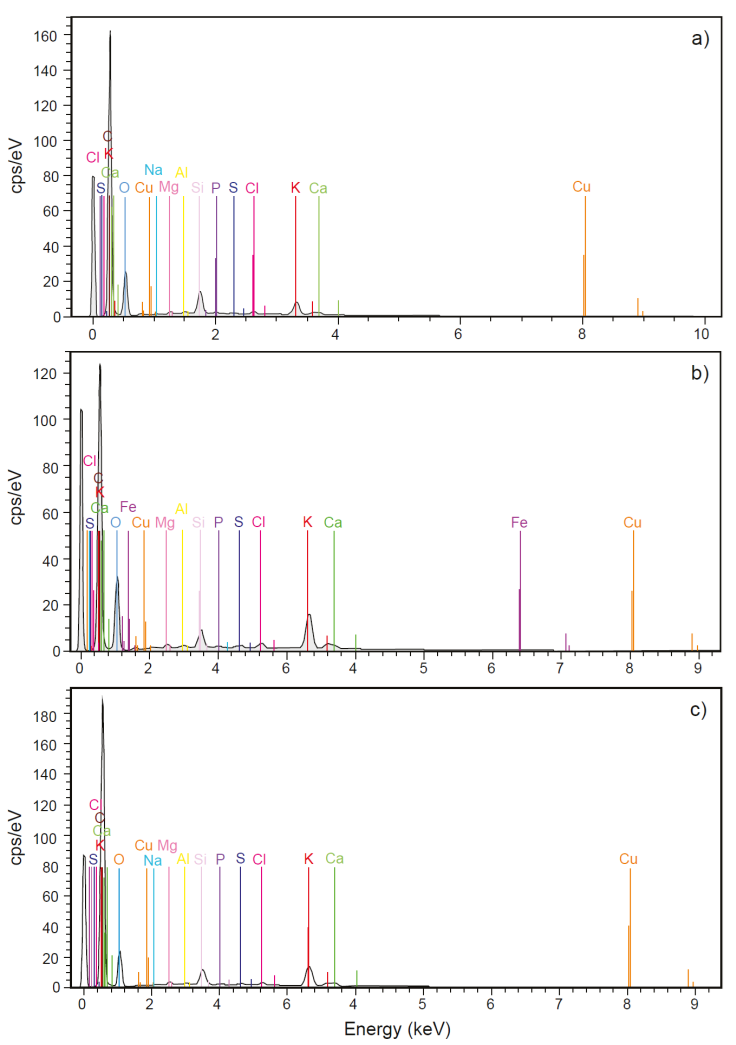
Mombaza grass chemical analysis harvested on pattern soil
The same macronutrients detected in the PS (P, K, Ca, Mg, and S) were identified in each MG harvest on the corresponding substrate (Figure 14). Furthermore, some micronutrients detected in all the harvests were Cu, Cl, and Al, whereas Fe was only found in the second harvest. Other elements detected in the MG harvested on the PS were Na detected during the first and third months, whereas Si was detected in the three crops forming aggregates within the MG structure. Finally, Ti element appears in the PS, however this element was not detected in MG crops, it indicates that MG does not incorporate it into its structure.
Mombaza grass chemical analysis harvested on sewage sludge
In case of the MG harvested on SS, the presence of the macronutrients observed in the substrate P, K, Ca, Mg, and S was observed in each crop (Figure 15). On the other hand, the micronutrients detected in the MG structure were Al, Cu, Mn, Fe, Zn, and Cl. The only microelements found in the three harvests were Al, Cu, and Mn, while Zn was detected in the first, and second harvest, Fe in the first, and Cl in the first, and third harvest. Other identified elements were Na and Si found in all crops. In the case of Si, it was again observed as part of aggregates, a form similar to that observed in the MG harvested in PS. Finally, in the case of Ti detected in the SS, this element was not detected in MG crops. Some micronutrients such as Cu, Zn, Mn, Fe, Al, and Mo are also heavy metals, and at high concentrations are toxic to plants. Other elements such as Cd, Pb, Cr, Ni, Hg, and As are heavy metals and all of them are toxic for living organisms and are often considered as pollutants (He et al., 2005; Sánchez-Montoya et al., 2019; Vélez-Pérez et al., 2020).
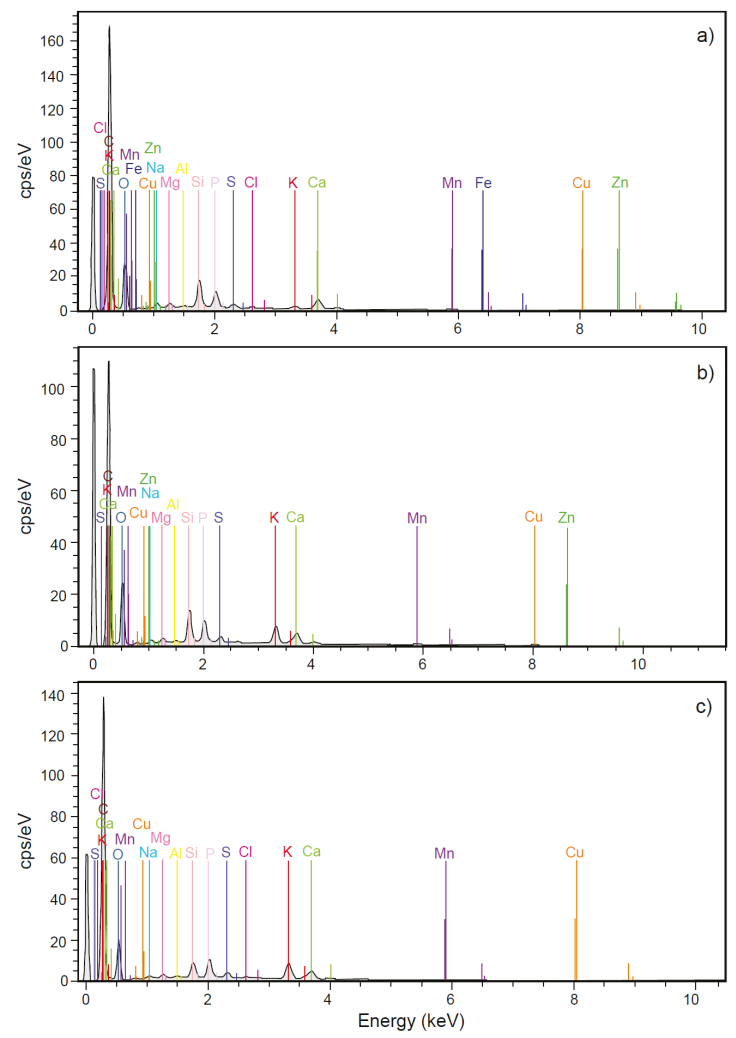
Figure 15 Chemical composition of Mombaza grass plants determined by scanning electron microscopy and X-ray energy dispersion spectroscopy, which were harvested on sewage sludge during the a) first month; b) second month; and c) third month of cultivation.
The macronutrients detected in the MG of all the crops analyzed from PS and SS were the same, i.e., there was no difference in terms of macronutrients in the MG harvested. However, in terms of micronutrients, Mn and Zn were detected in MG harvested from SS, whereas in MG harvested from PS, none of these elements were identified even though they are part of the nutrients that plants need for their proper development (He et al., 2005). These results indicate that the concentration of these elements in PS and MG harvested from this substrate could be below detection limit to be detected by this technique. In the case of Cl, this element was not found in SS, however, it was detected in MG harvested from this substrate. This means that the concentration of this element in the SS was not enough to be detected by the technique directly in them or Cl was added through irrigation water from dissolved salts (Kathpalia and Bhatla, 2018). Therefore, the presence of Mn and Zn in SS was one of the main causes for which better results were observed from the MG harvested on this substrate.
The SEM-EDS is a semi-quantitative technique, it is used as a tool to detect the presence or absence of a component. It is difficult through this technique to know the real concentration, nevertheless, it is useful to identify chemical elements in a sample as in the case of the analyzed substrates (Carles-Melgarejo, 2010).
Conclusion
The commercial soil used as substrate (PS) contains 3.7 times more moisture than SS. In terms of germination rate, the MG germination on PS was faster than MG germination on SS. In PS it was within the first 5 days, whereas in SS it was observed until day 7. However, the PS was better than the SS only in this parameter. In terms of H MG , the maximum height reached of the MG grown on SS was 2.80 times higher than the observed on PS. On the other hand, after the first harvest (first month), the highest Gr MG (regardless of the substrate) was recorded during the first cultivation week. The Gr MG in SS was ca. 2.5 times higher than Gr MG in PS. Furthermore, it was observed that after the first growth week of the second month, as the H MG increases, the Gr MG decreases.
In terms of Y MG arvested in SS was 562 % higher than the mass harvested in the PS, i.e., the use of SS as a sowing substrate translates into a Y MG of ca. 5.62 times better compared to PS as substrate. Another aspect to highlight is the OM content, which was 2.4 times higher in SS than the OM content in PS. The OM analysis throughout the three months MG cultivation on SS showed a decrease in OM, ca. 12 %, i.e., during this time a considerable decrease in OM content was not observed. On the other hand, each substrate evaluated presented the same macronutrients (P, K, Ca, Mg, and S); however, the SS showed Mn and Zn, two micronutrients of importance that were not detected in PS.
Based on the analysis of Gr MG , η OM , Y MG , and chemical composition in SS, there is potential to continue cultivating MG for a lapse greater than three months in areas where do not exist physical limitation for the root’s expansion.
The SS showed better nutritional characteristics than the PS. This was reflected in a major performance as a substrate for MG. The nutritional characteristics of the SS generated by Taxco de Alarcón WWTP and its performance as a substrate provide added value to this type of waste and allow it to be proposed as a substrate for this forage grass. Additionally, SS can be proposed as a physicochemical and nutritional characteristics improver for eroded soils in the region when fully chemically characterized.

