


 nueva página del texto (beta)
 Inglés (pdf)
 Artículo en XML
 Referencias del artículo
 Enviar artículo por email
 Citado por SciELO
  Similares en
SciELO
Similares en
SciELO 
 Permalink
Introduction
Dairy products are foods with nutritional characteristics that exist in the market, their care in the industry is transcendental since they offer a proportion of high-quality proteins while also providing calcium and vitamins such as A, D, E, and the B set [1]. The preservation of foods such as milk, meat, and vegetables to obtain products such as yogurt, cheese, pickles, sausages, silage, etc., allows them to have a longer shelf life than natural or unprocessed products. The shelf life of dairy products is longer than that of milk, but is still limited; hence, various techniques have been adopted to improve it [2]. The shelf life and quality of yogurt are determined by physical, chemical, and microbiological changes that modify its sensorial properties and decrease the general attributes of the product and therefore, overall consumer approval [3] [4]. Now, concerning shelf life prediction, Mataragas et al. [5] developed a methodology to formulate a predictive model of yogurt spoilage concluding that shelf life cannot be established with microbiological data alone, as one requires information of other parameters determined by sensory and physicochemical analyses. Shao et al. evaluated the Fourier-transform infrared spectroscopy as a rapid and non-invasive analytical technique to assess the quality and shelf life of yogurt during storage [6]. Papadopoulou et al. used partial least squares and, support vector machine regression and classification models to determine quantitative estimations of overall yogurt characteristics [7]. Furthermore, a survival analysis methodology was applied to estimate the shelf life of the probiotic yogurt by considering either a 25 % or a 50 % probability of consumer rejection; from the latter, shelf life was estimated at 38 and 53 days, respectively [8]. Artificial Neural Networks (ANN) models can also be applied to predict quality and deterioration during storage, these parameters are important in risk assessment, food safety and quality [9]; single- and double-layer Neural Networks were used to predict food quality in other milk products such as spreadable processed cheese [10], soft cheese [11], Ultra-High Temperature (UHT) soybean milk [12], and regular soy milk [13]. It is worth mentioning that viscoelastic, organoleptic, and microbial characteristics as well as the shelf life of yogurt changed with the addition of fruits and vegetables, however, they are mainly used to improve the nutritional and functional properties of the product [14]. Now, one can see that the most common shelf life estimation methods are by means of probability techniques and mathematical modelling. Probability techniques include the following distributions: normal, logs-normal, Weibull, exponential, and extreme value, among others. Meanwhile, concerning mathematical modelling one can find linear and nonlinear (sigmoidal-type) primary models; the reaction order model; the Arrhenius equation; the Q10 factor; and the survival method [5] [14] [15] [16] [17] [18] [19]. In the latter, shelf life prediction may be performed at either a constant or variable temperature [20].
This work aims to evaluate a proposed nonlinear and time-varying mathematical model of first-order ordinary differential equations (ODEs) that consider the influence of physicochemical and microbiological parameters on biomass kinetics evolution, specifically acidity, and viscosity as functions of temperature. Further, we compare the fitness capabilities of our model with those well-established in the literature for shelf life estimation.
Materials and methods
This section describes the origin of the experimental data, the procedure to fit our proposed model, the biostatistics around the estimation of all parameters, and the description of each equation.
Experimental data
Experimental data was extracted from Zhi et al. [1] where they discuss the evaluation of yogurt shelf life using physicochemical, microbiological, and sensory parameters. Values for the time-evolution were extracted with the opensource software Graph Grabber v2 plot digitizing from Quintessa Ltd. This application allows us to manually extract data points from the original figures as a comma separated value (cvs) file. The data corresponds to two yogurt samples identified as S0 1 and S2 0 for two temperatures, 5 °C and 15 °C. In each sample, the following three variables were extracted: biomass [B(t)], acidity [A(t)], and viscosity [V(t)], as it is illustrated in Figure 1.
Figure 1 Experimental data extracted from Zhi et al. [1] with the Graph Grabber software. Each point corresponds to the shelf life of two samples of yogurt (So1 and S2o) observed at 5°C for over 20 days and at 15°C for over 10 days. Panels from top to bottom are for acidity [A(t)], viscosity [V(t)], and biomass kinetics [B(t)]; where logx=log10x.
Mathematical modelling and data fitting
The dynamics of physicochemical and microbiological parameters of yogurt at two different shelf temperatures were modelled through a set of three first-order ODEs describing acidity in Titratable acidity units (°T), viscosity in pascal-second (Pa·s), and biomass in colony-forming units (CFU) per gram. Further, each equation considers the temperature (T) as follows:
It is evident that Equations (1), (2), (3) are non-linear and nonautonomous. Further, based on the positivity of dynamical systems theory, positive half-trajectories with nonnegative initial conditions [A(0),V(0),B(0)≥ 0], will be located within the following domain:
The latter implies that all solutions will always have nonnegative values, which corresponds with the biological meaning of each variable. Now, let us describe the biological assumptions on which our mechanistic model (1)-(3) was formulated. Equation (1) describes the increase in Acidity [A(t)] by the logistic law, where α1 is the growth rate and α2 the limited rate capacity. Equation (2) describes the decrease in Viscosity [V(t)] where the parameter β1 denotes the decrease rate and the lower value is given by 1/β2. Equation (3) describes Biomass [B(t)] dynamics with an initial growth phase formulated by the Michaelis-Menten term with rate γ1; then, the latter is followed by a death phase after the maximum concentration measured in the samples by the logistic law where γ2 is the decrease rate with lower bound given by 1/γ3. Further, it should be noted that we found that both time (t) and temperature (T) needed to be considered in the modelling process; in Equation (1), these parameters are included as a radical term [t1⁄T], in Equation (2) as a product of both parameters [tT], and in Equation (3) as a rational term [t/T].
Now, in order to fit Equations (1) (2) (3) to the experimental data of Figure 1, we developed an algorithm in Matlab 2023a based on the fitnlm function from the Statistics and Machine Learning Toolbox. Further, equations were numerically solved by using the improved Euler’s method (Heun’s method) with an integration step (Δt) of 1×10⁻³. Initial values for the fitnlm function were set as follows for both 5 °C and 15°C data of acidity and viscosity:
whilst for biomass, the following were set for 5 °C:
and the next for 15 °C:
Fitting results from the fitnlm function include the estimated value for each parameter as well as common biostatistics such as the t-value, degrees of freedom (dof), standard error (SE); 95 % confidence intervals (95CI), and p-value. A measure of the goodness of fit is provided by means of the R-squared (R2). Results are shown in Tables 1-4 and illustrated in Figures 2-3 and will be discussed in the next section. Now, let us briefly explain the most common models used for shelf life prediction as results from our model will be compared with those determined with the Weibull Model, the Reaction Order, the Arrhenius Equation, and the Q10 Factor. Furthermore, the threshold for yogurt feasibility is already established by the NOM-181-SCFI/SAGARPA-2018, which specifies that the product must contain at least 107CFU/g of viable biomass concentration.
Table 1 Acidity [A(t)]: Estimation of parameters and biostatistics for 5°C 15°C for both samples So1 and So2. The values describe the estimate value (Estimate), the standard error (SE), the confidence interval (95CI) and the p-value.
| Temperature | Sample | Parameters | Estimate | SE | 95CI | p-value | |
|---|---|---|---|---|---|---|---|
| 5 °C | So1 (t) | α1 | 1.052×10⁻¹ | 1.722×10⁻² | 6.445×10⁻² | 1.4589×10⁻¹ | 4.874×10⁻⁴ |
| α2 | 1.184×10⁻² | 3.853×10⁻⁵ | 1.175×10⁻² | 1.1934×10⁻² | 1.019×10⁻¹⁵ | ||
| So2 (t) | α1 | 1.017×10⁻¹ | 2.015×10⁻² | 5.406×10⁻² | 1.494×10⁻¹ | 1.484×10⁻³ | |
| α2 | 1.108×10⁻² | 5.478×10⁻⁵ | 1.095×10⁻² | 1.121×10⁻² | 1.904×10⁻¹⁴ | ||
| 15 °C | So1 (t) | α1 | 1.519×10⁻¹ | 2.158×10⁻² | 1.039×10⁻¹ | 2.000×10⁻¹ | 3.534×10⁻⁵ |
| α2 | 8.672×10⁻³ | 2.280×10⁻⁴ | 8.1645×10⁻³ | 9.180×10⁻³ | 3.753×10⁻¹² | ||
| So2 (t) | α1 | 2.715×10⁻¹ | 2.655×10⁻² | 2.123×10⁻¹ | 3.306×10⁻¹ | 1.295×10⁻⁶ | |
| α2 | 9.369×10⁻³ | 7.693×10⁻⁵ | 9.198×10⁻³ | 9.540×10⁻³ | 3.418×10⁻¹⁷ | ||
Table 2 Viscosity [V(t)]: Estimation of parameters and biostatistics for 5°C 15°C for both samples So1 and So2. The values describe the estimate value (Estimate), the standard error (SE), the confidence interval (95CI) and the p-value.
| Temperature | Sample | Parameters | Estimate | SE | 95CI | p-value | |
|---|---|---|---|---|---|---|---|
| 5 °C | So1 (t) | β1 | 2.070×10⁻³ | 3.876×10⁻⁴ | 1.176×10⁻³ | 2.9637×10⁻³ | 6.938×10⁻⁴ |
| β2 | 6.815×10⁻⁴ | 1.583×10⁻⁵ | 6.450×10⁻⁴ | 7.1801×10⁻⁴ | 9.341×10⁻¹¹ | ||
| So2 (t) | β1 | 3.569×10⁻³ | 3.884×10⁻⁴ | 2.673×10⁻³ | 4.4648×10⁻³ | 1.592×10⁻⁵ | |
| β2 | 6.577×10⁻⁴ | 6.903×10⁻⁶ | 6.418×10⁻⁴ | 6.7363×10⁻⁴ | 1.643×10⁻¹³ | ||
| 15 °C | So1 (t) | β1 | 1.163×10⁻² | 1.470×10⁻³ | 8.351×10⁻³ | 1.4901×10⁻² | 1.301×10⁻⁵ |
| β2 | 6.885×10⁻⁴ | 4.350×10⁻⁶ | 6.788×10⁻⁴ | 6.9819×10⁻⁴ | 2.488×10⁻¹⁸ | ||
| So2 (t) | β1 | 2.717×10⁻³ | 5.607×10⁻⁴ | 1.467×10⁻³ | 3.9662×10⁻³ | 6.764×10⁻⁴ | |
| β2 | 6.590×10⁻⁴ | 1.692×10⁻⁵ | 6.214×10⁻⁴ | 6.9672×10⁻⁴ | 2.962×10⁻¹² | ||
Table 3 Biomass [B(t)]: Estimation of parameters and biostatistics for 5°C and 15°C for both samples So1 and So2. The values describe the estimate value (Estimate), the standard error (SE), the confidence interval (95CI) and the p-value.
| Temperature | Sample | Parameters | Estimate | SE | 95CI | p value | |
|---|---|---|---|---|---|---|---|
| 5 °C | So1 (t) | γ1 | 5.640×10⁻² | 3.565×10⁻³ | 4.797×10⁻² | 6.483×10⁻² | 9.767×10⁻⁷ |
| γ2 | 1.510×10⁻¹ | 8.117×10⁻³ | 1.318×10⁻¹ | 1.702×10⁻¹ | 3.215×10⁻⁷ | ||
| γ1 | 1.473×10⁻¹ | 9.815×10⁻⁵ | 1.470×10⁻¹ | 1.475×10⁻¹ | 1.543×10⁻²⁰ | ||
| So2 (t) | γ 2 | 4.059×10⁻² | 1.135×10⁻² | 1.376×10⁻² | 6.743×10⁻² | 9.0134×10⁻³ | |
| γ1 | 1.461×10⁻¹ | 2.028×10⁻² | 9.811×10⁻² | 1.940×10⁻¹ | 1.770×10⁻⁴ | ||
| γ2 | 1.459×10⁻¹ | 2.470×10⁻⁴ | 1.453×10⁻¹ | 1.465×10⁻¹ | 1.051×10⁻¹⁷ | ||
| 15 °C | So1 (t) | γ1 | 9.465×10⁻² | 2.632×10⁻² | 3.511×10⁻² | 1.542×10⁻¹ | 5.7819×10⁻³ |
| γ2 | 2.467×10⁻¹ | 1.363×10⁻¹ | -6.159×10⁻² | 5.550×10⁻¹ | 1.037×10⁻¹ | ||
| γ1 | 1.575×10⁻¹ | 6.666×10⁻³ | 1.425×10⁻¹ | 1.726×10⁻¹ | 2.076×10⁻⁹ | ||
| So2 (t) | γ2 | 2.054×10⁻¹ | 2.525×10⁻² | 1.483×10⁻¹ | 2.626×10⁻¹ | 1.935×10⁻⁵ | |
| γ1 | 5.109×10⁻¹ | 9.235×10⁻² | 3.020×10⁻¹ | 7.198×10⁻¹ | 3.644×10⁻⁴ | ||
| γ2 | 1.519×10⁻¹ | 1.545×10⁻³ | 1.484×10⁻¹ | 1.554×10⁻¹ | 5.898×10⁻¹⁵ | ||
Table 4 The R2 provides a measure of the goodness of fit of our proposed mathematical model (1)-(3) to the observed data of each variable.
| T | Sample | Acidity [A(t)] | Viscosity [V(t)] | Biomass [B(t)] |
|---|---|---|---|---|
| 5°C | So1 (t) | 0.973 | 0.978 | 0.999 |
| So2 (t) | 0.957 | 0.987 | 0.995 | |
| 15°C | So1 (t) | 0.982 | 0.972 | 0.980 |
| So2 (t) | 0.980 | 0.966 | 0.992 |
Weibull Model
The Weibull Model has been used to estimate the shelf life of several foods, including yogurt [16] by the next Equation 4:
where a and β are known parameters as they define the shape and scale of the study to be carried out, meanwhile, γ represents the gamma function. Results were computed by means of statistical software using the data illustrated in Figure 1.
Reaction Order
The Reaction Order is mainly based on the principles of chemical kinetics with the following structure in Equation 5:
where A is the final half-life value, A0 is the initial quality and K is the reaction rate. Values were determined from a linear equation, where A0 is the intercept and K its slope.
Arrhenius Equation
The Arrhenius equation, also known as activation energy, focuses on the rate of chemical reactions as their temperature increases as indicated below Equation 6:
Where the zero-crossing points can be used to estimate shelf life by considering the effect of temperature on the kinetics of the product [21] [22]. Therefore, the equation to determine the shelf life according to [23] is given by next Equation 7:
where Q0 is the value of the quality characteristic at the start of the experiment and Qe is the value reached at the time ts, i.e., the estimated shelf life, and k is the speed of the reaction, i.e., the slope of the straight line.
Q10 Factor
The Q10 factor states that the rate of degradation is affected by a constant rate when temperature changes with time [18]. This makes it possible to determine the shelf life of foods by the following Equation 8:
where t is the service lifetime, Q10 is the acceleration factor, and T1 and T2 represent the changes in temperature in degree Celsius (°C).
Results and discussion
Nonlinear regression was performed for all variables [A(t), V(t) and B(t)] at two temperatures [5 °C and 15 °C] for the two samples of yogurt [So1 (t) and So2 (t)]. The fitting results of our model are illustrated by means of in silico experimentation in Figure 2. Estimated values of parameters and biostatistics for Equations (1)(2)(3) are shown, respectively in Tables 1-3, where we present the corresponding standard error (SE), 95 % confidence intervals (95CI), and the p-value for each estimate. The latter implies that the significance value (α) was predefined as 0.05. These statistics allow us to conclude on the statistical significance of our results.
Figure 2 Fitting results of Equations (1) (2) (3) to the observed data corresponding to the two samples of acidity [A(t)], viscosity [V(t)], and biomass at 5 °C and 15 °C. The × marker represents the observed data where green is for sample 1 [So1 (t)] and red for sample 2 [So2(t)]; the solid lines are for the approximated data from our mathematical model.
One can see that all lower bounds of the 95CI in Table 1 and Table 2 are positive, and that p-values are lower than α. Hence, Equations (1) and (2) are able to describe with a high level of confidence the dynamics of both Acidity [A(t)] and Viscosity [V(t)]. Further, as it is shown in Table 4, the coefficient of determination for the two samples at both temperatures is higher than 0.95. Now, regarding results for Equation (3) shown in Table 3, we found that our proposed model can accurately describe the dynamics of biomass [B(t)] as all estimated values but one was statistically significant. Further, the coefficient of determination for the two samples at both temperatures is higher than 0.98 (see Table 4). Following the latter, the estimated value of parameter γ2 in1Equation (3) had a negative lower bound in the 95CI due to the non-steep slope of the growth phase in sample 1 [So(t)] of biomass at 15 °C, as it is illustrated in the right lower panel of Figure 1. Therefore, results from the nonlinear regression algorithm indicated that only parameter γ1 had a significant influence on the observed growth phase as there was nearly zero growth of biomass in the first three days. Additionally, it is important to disclose the following information regarding the fitting process of our mathematical model. Nonlinear regression of Equations (1) (2) (3) at 5 °C is performed, respectively, at 7, 8, and 7 dof, with t-values of 2.3646, 2.3060, and 2.3646. Meanwhile, at 15 °C we have the following: 10, 10, and 9 dof, with t-values of 2.2281, 2.2281, and 2.2622. It is evident that as more data is available the value of the dof is higher and the t-value is lower. The latter is used to compute the margin of error (MoE) for the estimated values of parameters (MoE = t-value·SE), and the estimate ± MoE gives us the bounds of the 95CI.
Now, let us apply Equations (1)(2)(3) to observe overall changes in the dynamics of each variable at 5 °C and 15 °C for 60 days (2 months). Results are illustrated in Figure 3, where the base 10 logarithm of the threshold 107 CFU/g is indicated in both panels of biomass evolution in the two lower panels of the in silico experimentation.
Figure 3 Prediction results of 30 days for the two samples of acidity, viscosity, and biomass, at 5 °C and 15 °C. It should be highlighted that all solutions [A(t), V(t), B(t)] are bounded and dissipative. Boundedness ensures that concentrations of substances stay within physiologically acceptable ranges. Dissipativity is linked to the energy balance of the system and is often associated with the metabolic and thermodynamic aspects of biological processes. The × marker represents the observed data where green is for sample 1 [So1(t)] and red for sample 2 [So2 (t)]; the solid lines are for the approximated data from our mathematical model.
Concerning acidity, this variable converges to a lower level at 5 °C compared to 15 °C samples. The latter implies that a higher temperature increases acidity values in yogurt, this relationship is further elucidated in Table 1, where values for α1 are higher at 15 °C than at 5 °C. However, viscosity values remain consistent at both temperatures, converging to ~1460 Pa·s for sample 1 and ~1520 Pa·s for sample 2, but it should be noted that values for β1 are different across samples and temperatures, as documented in Table 2. Returning to biomass dynamics, is evident that the final predicted concentration is inversely proportional to temperature as it is higher at 5 °C and lower at 15 °C. Samples 1 and 2 reach a value of 6.809 and 6.867 logCFU/g, respectively, at 5 °C. Meanwhile, at 15 °C the model estimates a concentration of 6.377 and 6.614 logCFU/g in samples 1 and 2, respectively. Therefore, at lower temperatures, the biomass concentration remains above the established threshold for more days. These differences are also reflected in the estimated values of γ1 and γ2 documented in Table 3.
Yogurt in optimal conditions adheres to the defined standards of the NOM-181-SCFI/SAGARPA-2018. The experimental data and the in silico experimentation indicate that the observed variables are affected by the storage temperature as well as the initial biomass concentration [B(0)]. Higher temperatures lead to changes in the microbiological characteristics that ultimately reduce the shelf life of the product; for samples 1 and 2 at 5 °C we have results of 9.6 and 11.6 days, whilst at 15 °C results for samples 1 and 2 are estimated at 7.3 and 8.9 days. The latter implies a reduction in shelf life of 2.3 and 2.7 days, respectively. Furthermore, initial concentrations of biomasses were measured at 7.119 and 7.318 logCFU/g for samples at 5 °C, and 7.150 and 7.341 logCFU/g for samples at 15 °C, respectively, by Zhi et al. [1].
Now, let us discuss the results of the estimated shelf life of yogurt with the Weibull Model, the Reaction Order, the Arrhenius Equation, and the Q10 factor. First, it should be noted that these models should be applied to each data set of each variable. Hence, in Figures 4, Figure 5 and Figure 6 we present the different results estimated for the shelf life of the sample 1 of yogurt at the two observed temperatures. Furthermore, the exact shelf life estimation in days is presented in Table 5 for sample 1. When analyzing acidity, the longest shelf life was estimated at 5 °C with a result of 569 days by the Reaction Order. Meanwhile, the shortest time was obtained with the Weibull model at 15 °C with 78.5 days as shown in Figure 4. Concerning viscosity, both the Weibull Model and the Reaction Order estimated a longer shelf life at a higher temperature, 294.4 and 81 days, respectively. However, both the Arrhenius Equation and the Q10 factor estimated a longer shelf life for the lower temperature data as illustrated in Figure 5. Now, when applying all models to the biomass data sets of sample 1, the longer shelf life was estimated for the temperature at 5 °C, which is to be expected in real-life scenarios of yogurt storage. Nonetheless, it is evident that all these models overestimate the shelf life of a product such as yogurt. Additionally, these models do not consider the threshold that has been stablished for yogurt feasibility by the NOM-181-SCFI/SAGARPA-2018 for the biomass concentration of at least 107CFU/g in the product.
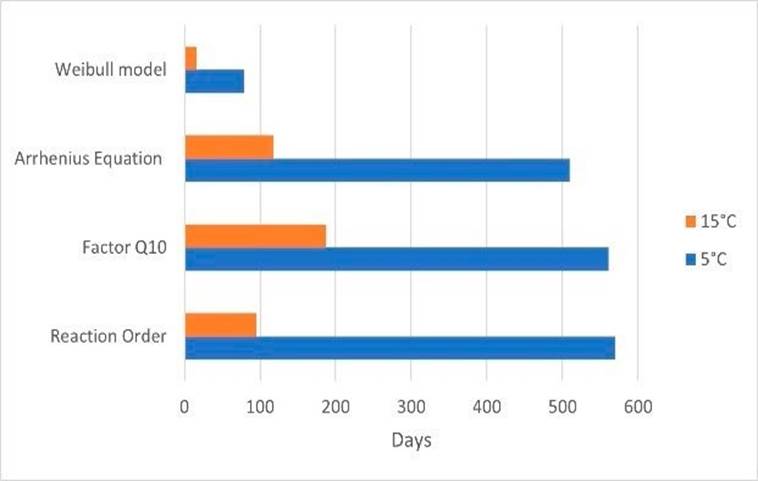
Figure 4 Shelf life estimation for sample 1 of yogurt when analyzing the data sets of the observed acidity [A(t)] at 5°C and 15°C.
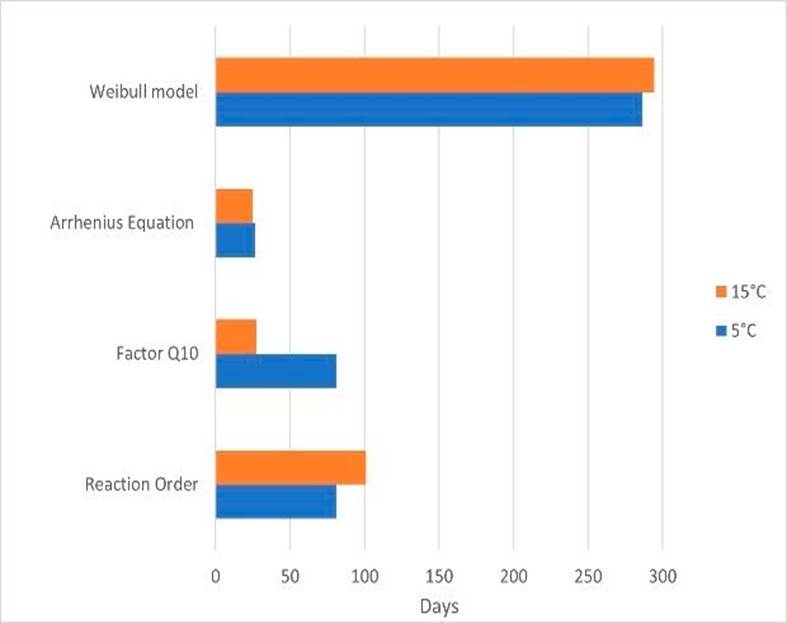
Figure 5 Shelf life estimation for sample 1 of yogurt when analyzing the data sets of the observed viscosity [V(t)] at 5°C and 15°C.
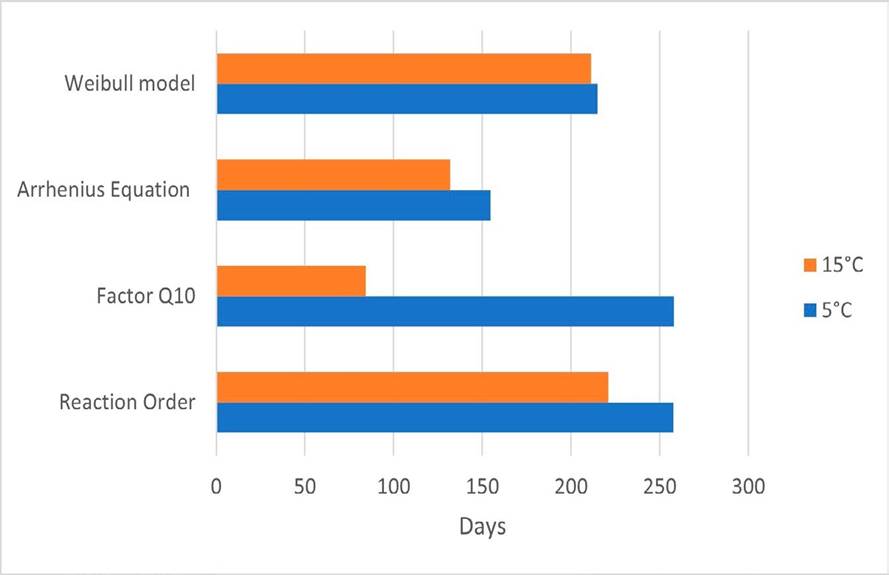
Figure 6 Shelf life estimation for sample 1 of yogurt when analyzing the data sets of the observed biomass dynamics [B(t)] at 5°C and 15°C.
Table 4 Summarized results for the shelf life estimation of sample 1 [So (t) ] with the Weibull Model, the Reaction Order, the Arrhenius Equation, and the Q10 factor. Results for the shelf life are given in days.
| T | Sample | Acidity [A(t) ] | Viscosity [V(t) ] | Biomass [B(t) ] |
|---|---|---|---|---|
| 5°C | So1 (t) | 0.973 | 0.978 | 0.999 |
| So2 (t) | 0.957 | 0.987 | 0.995 | |
| 5°C | So1 (t) | 0.982 | 0.972 | 0.980 |
| So2 (t) | 0.980 | 0.966 | 0.992 |
Conclusions
As large quantities are wasted in expired dairy products, the industry requires processes to reduce yogurt waste by improving quality and extending shelf life. Although there are several methods based on the chemical reaction rate to determine the shelf life of yogurt, these give different values for the same experimental data of the product. Hence, a mathematical model using first-order ODEs is better suited to determine the overall shelf life based on the physicochemical and microbiological properties of the product.
As mentioned before, yogurt reaches the end of its shelf life due to the values established by food standards. Therefore, it can be concluded that by modelling the shelf life of each of the samples analyzed, it would be possible to better estimate the shelf life based on changes of the different variables analyzed by each food productor.
Therefore, our proposed mathematical model (1)-(3) is able to accurately approximate the changes of each of the physicochemical and microbiological variables such as biomass, acidity and viscosity at different storage temperatures. Then, by following the already established thresholds one can estimate the total number of days that the product will be suitable for human consumption. Further, when comparing results is easy to determine that a lower temperature will increase shelf life and reduce waste in the short-term
One limitation of our model is that it does not consider biomass death rate as it was formulated by means of a combination of growth laws, a Michaelis-Menten kinetics, and the logistic law. Therefore, the in silico experimentation of Figure 3 illustrates that once this variable reaches the plateau, then the predicted values do not tend to zero as time increases. It is left as future work to validate the model with yogurt samples at different temperatures and determine the relationship between the variables, which may allow us to better estimate the shelf life of yogurt by considering the dynamics among these different variables.
Author Contributions
Y. S. M. conceptualization, methodology, validation, formal analysis, investigation, resources, writing original draft, writing review and editing, and project administration. P. A. V. conceptualization, methodology, software, validation, resources, writing original draft, writing review and editing, and visualization. E. R. T. Software and formal analysis. M. F. A. O. Data curation and investigation. All authors have read and agreed to the published version of the manuscript.

