


 nueva página del texto (beta)
 Inglés (pdf)
 Artículo en XML
 Referencias del artículo
 Enviar artículo por email
 Citado por SciELO
  Similares en
SciELO
Similares en
SciELO 
 Permalink
Introduction
The importance of diagnosing lung function lies in determining whether patients exhibit a restrictive, obstructive, or restrictive-obstructive respiratory pattern through the interpretation of measurements depicting dynamic or static lung performance [1]. There are four clinical trials to diagnose respiratory patterns in patients: a) spirometry, b) static lung volumes, c) lung's ability to diffuse carbon monoxide, and d) 4 examination of blood gas [1]. All of these are used to diagnose and monitor the severity level of pulmonary diseases such as chronic obstructive pulmonary disease (COPD). COPD is a prevalent, avoidable, and manageable condition marked by persistent respiratory symptoms and restricted airflow resulting from abnormalities in the airways and/or alveoli, typically stemming from substantial exposure to harmful particles or gases [2] [3] [4]. Since the appearance of SARS-CoV-2 (COVID-19), the performance of the four clinical trials has become a complicated routine not only for COPD diagnosis but also for COPD patients with SARS-CoV-2. Nowadays, the main risk of conducting these tests is COVID-19 transmission due to contamination of materials used during each procedure [4] [5] [6], increasing the probability of developing severe lung disease or death.
Electrical Impedance Tomography (EIT) is a radiation-free and non-invasive method employed for visualizing the distribution of impedance in specific regions across the cross-sectional human body [7] [8]. EIT frames are reconstructed from a set of impedance measurements obtained by an arrangement of 16 electrodes placed around the thorax at the level of the sixth intercostal space [9] [10] [11], registering impedance changes that allow the characterization of internal movements produced by the human body. Some EIT applications in pneumology include: 1) estimation of regional lung perfusion [12] [13], 2) regional lung ventilation characterization in patients with pulmonary fibrosis [14] and pulmonary hypertension [15], 3) detection of bronchopulmonary dysplasia in neonates at early stages [16], 4) ventilatory pattern monitoring in patients diagnosed with sudden onset of respiratory distress syndrome (ARDS) [17], 5) evaluation of an effect of pleural effusion drainage in patients submitted to mechanical ventilation [18], among others.
EIT applications in COPD patients aim to monitor parameters that describe temporal changes in pulmonary airflow limitation. For example, Milne et al. (2019) proposed using EIT to characterize ventilatory heterogeneity (VH) using lung tidal volume changes. In this case, EIT determinations were compared with the forced oscillation technique (FOT) in COPD patients compared with a control group. Three parameters from bioimpedance changes corresponding to each voxel of the EIT image were calculated. The first one was the mean expiratory time. The second measure involved calculating the average time gap between the impedance alterations in individual voxels and the overall impedance variation in the entire EIT image or phase shift. The third one was the mean amplitude of impedance signals determined by each EIT voxel. The coefficient of variation (VC) and index of heterogeneity (HI) for each parameter were calculated to quantify lung impedance distribution: the coefficient of variation (CV) and the heterogeneity index (HI). A HI is the CV of the region defined by the 28 near neighboring voxels of the point considered. The HI is defined as the mean value of all local HI for the whole EIT image. From the obtained results, both CV and HI evidenced a significant increase in COPD patients compared with the control. All assessments were linked to spirometry parameters and measurements of resistance and reactance in the Forced Oscillation Technique (FOT), revealing statistically significant distinctions between the groups [19].
Karagiannidis et al. (2018) suggested employing EIT to ascertain regional expiratory time constants in intubated patients with COPD and ARDS. These time constants were calculated based on the overall impedance signal obtained from EIT. These parameters were compared with lung volume signals obtained by a pneumotachograph. Authors evidenced a significant correlation, roughly 80 %, between EIT-derived time constants and those obtained by a pneumotachometer [20].
Vogt et al. (2016) suggested utilizing EIT to observe the spatial and temporal distribution of ventilation (VD) in COPD patients while under the influence of an inhaled bronchodilator. In this study, spirometry served as the gold standard. The EIT image values corresponding to various spirometry parameters were identified, including FEV1, FVC, FEV1/FVC, tidal volume, peak flow, and mean forced expiratory flow between 25 and 75 % of FVC (FEF25-75 %). The FEV1/FVC ratio was used to assess the bronchodilator's impact on spatial ventilation distribution. A significant bronchodilator response was evidenced in most of the patients assessed by these EIT parameters [21].
In the above-mentioned studies, authors used EIT as an alternative method to monitor parameters that describe lung function. These parameters were compared with those obtained by different clinical trials. EIT utilizes frequency analysis to interpret signals, but correlating FFT frequencies with respiratory parameters remains challenging. EIT captures impedance variations within a body, offering insights into lung function. However, the exact correspondence between FFT peaks and specific respiratory metrics remains elusive. Despite advancements, establishing a direct correlation remains complex due to the multifactorial nature of physiological processes and signal intricacies. New research is needed to fully unveil these connections, enabling precise respiratory parameter estimations. Bridging this gap promises enhanced diagnostic capabilities and refined monitoring techniques, driving EIT towards more accurate and insightful clinical applications in respiratory care.
This study proposes to analyze the frequency of electrical bioimpedance changes in the ventilation pattern with those parameters corresponding to clinical procedures, mainly diffusing lung capacity trials and arterial blood gas tests in a group of COPD patients. We hypothesize that EIT supplies information about lung airflow limitation through the frequency analysis of tidal-volume respiration signals. The main objective of this research is to identify frequency components of the tidal volume lung signal obtained by EIT and correlate them with parameters of the pulmonary trials in a group of COPD patients to detect lung parenchyma involvement.
Materials and methods
Instrumentation
The TIE4-sys represents the fourth iteration of an EIT prototype developed at the Department of Electronic Engineering, Universitat Politècnica de Catalunya, Barcelona, Spain. This system features 16 electrodes positioned around the thoracic box at the sixth intercostal space, aligning with the established protocol of our research group [22]. The process involves injecting a 1 mA electrical current at 48 kHz through a pair of adjacent electrodes, with the resulting differential voltage recorded at the rest of the adjacent electrode pairs. Following the completion of potentials for a specific injection pair, the injection point is shifted to the next adjacent electrode pair, initiating a new cycle of measurements [23]. The entire procedure concludes when all adjacent electrode pairs have been employed as injectors. EIT determinations are redundant, enabling the estimation of the reciprocity error [24]. This parameter characterizes systematic errors and malfunctions that may arise during the procedure, such as inadequate contact between electrodes and the skin [25] [26].
The TIE4-sys reconstruction algorithm utilized for image generation is a weighted back-projection algorithm. The software incorporates a weight matrix that considers the spatial sensitivity of each pixel in the EIT image [27] [28]. The TIE4-sys scan rate is 17 images/s [25]. Dynamic images are relative impedance changes calculated using a baseline (BL) as a reference. The BL of TIE4-sys is composed of averaging 204 images corresponding to 12 seconds of acquisition [25].
Following the recording of the breathing pattern and the generation of dynamic images, an impedance signal (ΔZ) is obtained by determining the variance between the average impedance of an Electrical Impedance Tomography (EIT) image and the baseline (BL). The parameter ΔZ is computed for each of the 510 EIT images, corresponding to a 30-second monitoring period with TIE4sys.
For monitoring lung tidal volume, the pneumatometer employed was a Med Graphics preVentTM Pneumotach provided by Medical Graphics Corporation (St. Paul, MN, USA). The device is controlled by software supplied by the manufacturer, recording measurements displayed graphically on the screen and numerically downloadable as a text file. Calibration of the pneumotachometer was performed using a 3-L syringe following standard laboratory protocols, establishing it as the gold standard for measurements [29].
Participants
A group of 20 male patients (Caucasic, age 67±9), all diagnosed with COPD at the Pneumology Department of Hospital de la Santa Creu I Sant Pau, Barcelona, Spain, was analyzed. In general, all patients showed an intense obstructive ventilatory alteration (FEV1/FVC roughly 45 % ± 11 %) and a moderate level of air trapping (RV/TLC roughly 1.4) [30]. The prevalence of COPD in the countries of the European Union is higher in men than in women by approximately 30 % [31]. Due to this fact, this study was conducted on male subjects. All clinical procedures were performed between 9 am and noon in a quiet room at sea level with an ambient temperature of 25 °C and a relative humidity of 60 %. All patients voluntarily consented to participate in the study, which had been previously approved by the institutional ethics committee. A written informed consent was read and signed by all participants. This research was conducted according to the guidelines outlined in the Declaration of Helsinki [32].
Clinical Tests
The medical history of the COPD patients included at least one of the four clinical procedures of interest for our study: 1) spirometry, 2) static lung volumes, 3) carbon monoxide diffusing capacity in the lungs, 4) analysis of blood gases. Spirometry is used to screen for abnormalities of airflow or lung volume [33] [34]. The variables obtained from this test are forced vital capacity (FVC), forced expiratory volume in the first second (FEV1), and the FEV1/FVC ratio. All patients had spirometry test parameters. Static lung volume test assesses air trapping in the lungs. The parameters from this test are residual volume (RV) and total lung capacity (TLC) [35]. Out of the 20 COPD patients, only 15 participants had this test available. Pulmonary diffusing capacity for carbon monoxide test measures gas transferred from the alveoli to the capillary blood per unit time [36]. The variables obtained from this test are pulmonary diffusing capacity for carbon monoxide (DLCO), pulmonary diffusing capacity adjusted to hemoglobin (DLCOAdj), and the ratio DLCO/Av (Av: alveolar volume). In this case, out of the 20 patients, only 16 had results from this procedure available. Finally, the arterial blood gas analysis gives information about the partial pressures of gas in blood and acid-base content [37]. The parameters measured in this test include the partial pressure of oxygen in arterial blood (PO2) and the partial pressure of carbon dioxide in arterial blood (PCO2). From the group of patients, only 14 had results from this analysis.
Procedure
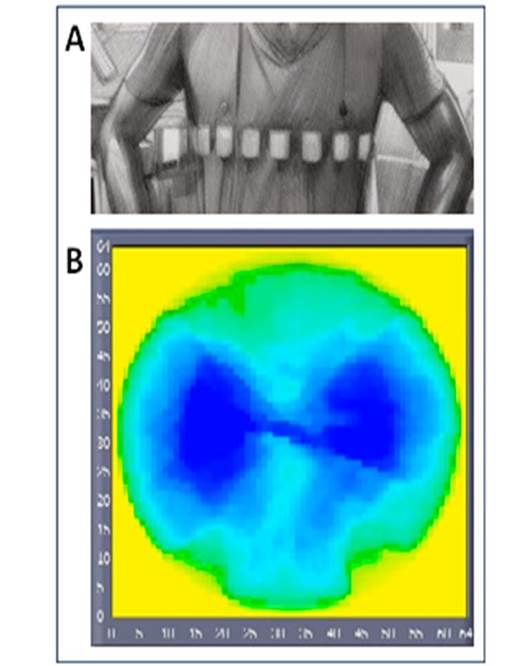
All determinations analyzed in this study were previously used to obtain and assess a set of calibration equations to convert EIT signals into measurable volume signals [38] [39]. In this study, two devices were used: the pneumotachometer and TIE4-sys. Both devices were simultaneously connected to each patient; the pneumotachometer through a mouthpiece and clip nose and TIE4-sys through 16 electrodes (Red Dot 2560-3M, London, Ontario, Canada) placed at the level of the sixth intercostal space, making a 224 pixel mesh. At this level of the thorax, the bioimpedance changes corresponding to lung tidal volume are not affected [40] [41]. The pneumotachometer is used to quantify pulmonary airflow, meanwhile, TIE4-sys monitors bioimpedance changes corresponding to lung volume variations. Three respiratory exercises under tidal volume conditions were recorded for each patient. Each respiratory maneuver was performed by each volunteer adopting a sitting position and lasted 30 seconds with three minutes of rest between measurements. The sitting position contributes to reducing strain on the body during respiration and reduces the wear and tear on the joints, muscles, and ligaments [42]. Figure 1 shows the electrodes´ placement and a typical image obtained by EIT.
Signal Processing
The three bioimpedance signals include 30 seconds with a scan rate of 17 samples/s, which is 510 points for each one. Each pneumotachometer signal data encompasses 30 seconds with a scan rate of 50 samples/s, that is 1500 points. The tidal volume determinations and bioimpedance changes corresponding to each respiratory maneuver were estimated using the differences between each maximum and the following minimum values of each signal. MatLab software was used to perform the signal processing and statistical analysis. From the analysis of FFT graphs, six regions from the signal spectrum (R1 - R6) are considered for analysis: R1 is defined from 0 to 200 mHz, R2 from 200 mHz to 400 mHz, R3 from 400 mHz to 600 mHz, R4 from 600 mHz to 800 mHz, R5 is between 800 mHz and 1 Hz, and R6 covers the frequencies higher than 1 Hz. Four parameters were estimated from each frequency region and for each patient: the mean area under the curve (Ri-A from the three maneuvers), and the quartile at 25 %, 50 %, and 75 % of FFT-Spectrum data (Ri-Q1, Ri-Q2, and Ri-Q3 respectively by merging the three data sets).
Statistical Analysis
The utilization of quartile analysis was implemented due to the non-normal distribution observed in the majority of frequency segment data, as indicated by the Shapiro-Wilk test (p-value < 0.05). Following this, these parameters were correlated with the results from clinical tests, primarily focusing on pulmonary diffusing capacity for carbon monoxide and arterial blood gas analysis, but also including spirometry and static lung volumes [43] [44].
The tidal volumes obtained by the pneumotachometer technique, and those volumes estimated by EIT data show normal distribution; therefore, the correlation between tidal volumes and bioimpedance changes was performed by parametric Pearson correlation. However, the correlations between the parameters (areas under the curve and quartiles) estimated in each segment of FFT spectrums and those obtained by clinical tests were performed by a Spearman correlation because most of the FFT parameters do not have a normal distribution.
Results and discussion
It is known that bioimpedance changes due to respiration vary greatly between persons. Even one person may present different results due to, for example, hydration status. For that reason, in the present study, we have not chosen a study-control group approach, but the frequency variations were directly correlated with the parameters obtained in clinical tests. The correlation between tidal volume measurements obtained by the pneumotachometer and electrical bioimpedance change determinations for all the participants was over 95 % (Pearson r, p-value < 0.05).
Most of the data parameters corresponding to segmented FFT-Spectrum (Parameters from regions 1, 3, 5, 6, and R4-Q1 and R4-Q2) did not follow a normal distribution in the electrical bioimpedance spectrum (S-W, p-value < 0.05). The correlations between these parameters and clinical evaluations are performed by the Spearman rank correlation test (ρ, p-values < 0.05). The parameter PCO2 shows significant correlations with the following electrical bioimpedance FFT parameters: R3-A with a correlation ρ = - 0.564 (p=0.036), R4-A with a correlation ρ = - 0.666 (p=0.009), R5-A with a correlation ρ = - 0.635 (p=0.015), and R6-A with a correlation ρ = - 0.586 (p=0.028). Also, this parameter shows a significant correlation with quantile values of FFT data at the same regions: R3-Q3, ρ = - 0.686 (p=0.007), R4-Q1, R4-Q2, R4-Q3 with ρ = - 0.533 (p=0.05), ρ = - 0.560 (p=0.037), ρ = - 0.648 (p=0.012) respectively; R5-Q1, R5-Q2, R5-Q3 with ρ = - 0.626 (p=0.017), ρ = - 0.611 (p=0.02), ρ = - 0.569 (p=0.034) respectively; and R6-Q3, ρ = - 0.584 (p=0.028). Residual volume (RV) correlates with impedance R2-Q1 ρ = - 0.595 (p=0.019). Also, DLCOadj correlates with R4-Q1 and R4-Q2, ρ = 0.506 (p=0.045) and ρ = 0.512 (p=0.043) respectively (Table 1, Table 2, Table 3).
Table 1 Spearman correlations of partial areas under FFT spectrum in different frequency ranges of electrical bioimpedance signal and PCO2.
| Electrical bioimpedance region area | Correlation with PCO2: r (p) |
|---|---|
| R3 | -0.564 (0.036) |
| R4 | -0.666 (0.009) |
| R5 | -0.635 (0.015) |
| R6 | -0.586 (0.028) |
Table 2 Spearman correlation of PCO2, RV and DLCOadj with quantiles of power values of FFT spectrum in different frequency ranges of bioimpedance signal.
| Electrical bioimpedance regionquartile |
Correlation with PCO2: r(p) |
Correlation with RV: r(p) |
Correlation with DLCOadj: r (p) |
|---|---|---|---|
| R2-Q1 | -0.595 (0.019) | ||
| R3-Q3 | -0.686 (0.007) | ||
| R4-Q1 | -0.533 (0.05) | 0.506 (0.045) | |
| R4-Q2 | -0.560 (0.037) | 0.512 (0.043) | |
| R4-Q3 | -0.648 (0.012) | ||
| R5-Q1 | -0.626 (0.017) | ||
| R5-Q2 | -0.611 (0.02) | ||
| R5-Q3 | -0.569 (0.034) | ||
| R6-Q3 | -0.584 (0.028) |
Table 3 Spearman correlation of PCO2 and PO2 with quantiles of power values of FFT spectrum in different frequency ranges of Pneumotachometer signal.
| Pneumotac region-quartile |
Correlation with PCO2: r (p) |
Correlation with PO2: r (p) |
|---|---|---|
| R2-Q1 | 0.682 (0.007) | |
| R2-Q3 | -0.540 (0.046) | |
| R4-Q1 | -0.560 (0.037) |
Based on these results, multiple linear regression was calculated with PCO2 as a dependent variable and the significantly correlated areas and quartiles as predictors, obtaining an expression with the most significant coefficients (9 predictors: R3-A, R4-A, R5-A, R6-A, R3-Q3, R4-Q1, R4-Q2, R6-Q3, R5-Q2). This multiple regression has an R2=0.947 with an R2adj=0.827 (Figure 2).
Figure 2 Dispersion graph of predicted PCO2 obtained by multiple regression (R2=0.947 with an R2adj=0.827) and the value measured by arterial gas exchange analysis.
Pneumotachometer FFT parameters correlate mainly with spirometry results, as was discussed in other investigations. PCO2 correlates with R2-Q3 and R4-Q1 with ρ = - 0.540 (p=0.046) and ρ = - 0.560 (p=0.037) respectively, and R2-Q1 correlates with PO2 with ρ = 0.682 (p=0.007).
This research aimed to detect lung parenchyma involvement by electrical impedance tomography in a group of COPD patients. To achieve this goal, it was proposed to analyze the frequency spectrum (FFT-module) of the bioimpedance signal obtained by EIT, under lung tidal volume conditions. Each FFT spectrum was segmented into six frequency ranges, in which four parameters of interest (area under each range of FFT spectrum, and quartile at 25 %, 50 %, and 75 % of FFT data in each range) were estimated. These parameters were correlated with those resulting from four clinical tests involved with the gas exchange condition, mainly with arterial blood gas parameters.
The normal respiration frequency lies in the first and sometimes second defined range frequencies (< 400 mHz). It is proposed that high-frequency ranges defined involve the noise coming from parenchyma involvement and that this is detected better with the electrical bioimpedance technique. Low frequency (< 4Hz) Forced Oscillation Lung Function Test has been related to viscoelastic properties of parenchyma [45], so our claim can be understood as a way to relate parenchyma involvement with low-frequency features of tidal volume (> 0.4 Hz corresponding to what we call high-frequency range) While the exact relationship between the involvement of lung parenchymal and bioimpedance is complex and not fully elucidated, it's clear that alterations in lung parenchymal properties can potentially affect bioimpedance measurements. This highlights the importance of considering various physiological factors when interpreting bioimpedance data in the context of lung function assessment or disease diagnosis. In this study, the highest correlations of bioimpedance areas and quartiles of the FFT spectrum at high frequencies (higher than 400 mHz) were those corresponding to the parameters of arterial blood gas technique, mainly PCO2. This correlation is negative, implying that the higher FFT values of the high-frequency region, the lower PCO2 determinations or better performance of the gas exchange. This parameter is important to determine the level of obstruction, restriction, or obstruction-restriction of the ventilatory pattern of a patient [1] [2] [3] [4]. This could be possible because EIT detects the alteration of lung parenchyma through electrical current application and biopotential detection around the thorax. An explanation could be that during inhalation, alveoli expand to perform the gas exchange. These alveoli expansions produce high-frequency noise when this is electrically monitored. However, one COPD condition is the destruction of alveoli ramification (emphysema), including bronchioles [1] [2] [3] [4]. We hypothesize that EIT detects the involvement of lung parenchyma (alveoli and bronchioles). The involvement of the parenchyma can be detected by the analysis of low frequencies features of the tidal volume obtained by the whole EIT image or by regions of interest.
It's crucial to emphasize that the results we've acquired are constrained to a group of 20 individuals with COPD. To enhance the robustness of future studies, it is essential to augment the size of the patient sample. As well as, to use regions of interest on EIT images and monitor the bioimpedance changes, analyzing its frequency components and correlating them with parameters of clinical tests.
Conclusions
From the frequency analysis of an electrical bioimpedance signal obtained by EIT, under lung tidal volume conditions, it is possible to detect parameters of gas exchange conditions such as PCO2 by analyzing frequency features at high frequencies from the FFT spectrum. Therefore, based on the sample of patients, it is possible to detect the level of affectation of the ventilatory pattern. Likewise, using EIT, we can predict the performance level of gas exchange in a group of COPD patients with an intense obstructive ventilatory alteration and a moderate level of air trapping.
Ethical Statement
The clinical study in which the lung volumes and bioimpedance determinations were acquired in a group of COPD patients was approved by the Committee of Ethics of the Hospital de la Santa Creu i Sant Pau, Barcelona, Spain.
Declaration of interests
The authors declare that they have no known competing financial interests or personal relationships that could have appeared to influence the work reported in this paper.
Author contributions
F. M. V. L. Data acquisition, data analysis and interpretation, and writing original draft. M. I. D. C. Data analysis and interpretation, review of the manuscript. P. J. R. C. Study design, data analysis and interpretation, and review of the manuscript. S. K. Study design, data acquisition, data analysis and interpretation, review of the manuscript, and funding acquisition. J. M. B. O. Study design, data acquisition, data analysis and interpretation, review of the manuscript, and funding acquisition. All authors approved the version to be published and agree to be accountable for all aspects of the work in ensuring that questions related to the accuracy or integrity of any part of the work are appropriately investigated and resolved.

