


 nueva página del texto (beta)
 Inglés (pdf)
 Artículo en XML
 Referencias del artículo
 Enviar artículo por email
 Citado por SciELO
  Similares en
SciELO
Similares en
SciELO 
 Permalink
INTRODUCTION
The surface of marine macroalgae provides a fitting habitat for animal and plant species development and provides food and shelter (Ryland, 1974; Chemello & Milazzo, 2002). The relationship between the epibionts and their host has been studied by several authors (Taylor & Cole, 1994; Parsons & Preskitt, 2007; Bates, 2009). Macroalgal morphology-based studies have explained the probable interactions (Taylor & Cole, 1994; Chemello & Milazzo, 2002; Bates, 2009; Torres et al., 2015)
To explain the association between the epifauna and their host, Bates (2009)) used the functional classification by Steneck & Dethier (1994). In contrast, Parsons & Preskitt (2007) classified macroalgae according to the structure of their thalli; they found that epibenthic dinoflagellates prefer microfilamentous macroalgal species, perhaps because of the surface area provided by the latter. Taylor & Cole (1994) found correlations between macroalgal morphology and epifauna and suggested that the more complex macroalgal forms resulted in higher epifaunal diversity.
Macroalgae classification based on their thallus morphology allows the assessment of the association between them and the epibionts. However, although the results are usually expressed as the number of epibiont individuals per gram of the host biomass, the estimation is inaccurate because the relation between weight and specific surface area in aquatic plants differs between species (Sher-Kaul et al., 1995; Armstrong et al., 2003). Therefore, Lobel et al. (1988) and Bomber et al. (1989) suggested that in comparative studies it is necessary to know the specific surface area of macroalgae to allow standardization of the abundance of epibionts in cells/individuals per area.
Different methodologies have been proposed to estimate the macroalgal specific surface area (Sm). Lobel et al. (1988) and Armitage & Sjøtun (2016) made these estimations for Galaxaura sp., Dictyota sp., Codium fragile (Suringar) Hariot and Fucus serratus Linnaeus based on geometrical forms; however, their technique assumes a flat surface. Lobel et al. (1988) and Bomber (1989) estimated the Sm by the weight difference between dry weight before and after immersion of the algae in a surfactant solution. For aquatic plants, Cattaneo & Carignan (1983) and Armstrong et al. (2003) estimated the specific surface area by using a mixture of detergent and different dyes. These techniques are promising; however, they need to be modified to obtain consistent and reliable data (Lobel et al., 1988). The chemical adsorption methods improved the specific surface area estimation because both texture and roughness were taken into account (Bergey & Getty, 2006).
It is important to mention that to compare the superficial area between different macroalgal species, it is necessary to standardize the methodology, and it must be suitable for all species, regardless of their morphological complexity and chemical composition. It has been reported that using geometric or mathematical techniques has low accuracy in algal species with complex structures (Harrod & Hall, 1962). In addition, the geometrical technique can neglect the algal surface microstructure (Lobel et al., 1988), which may be relevant for epibenthic assemblages. On the other hand, the specific surface area determination per weight depends on the morphological complexity, composition, and surface characteristics of the algal species (Rubín et al., 2010). The quantities of water and salts affect the gravimetric determination of dry weight (Zhu & Lee, 1997). Therefore, it is necessary to homogenize the samples and eliminate water, organic and inorganic substances. Arredondo-Vega & Voltolina-Lobina (2007) suggest elimination of water by drying the microalgal biomass at temperatures between 60 and 70°C until a constant weight at a constant temperature is obtained.
Nevertheless, when using the adsorption methods, it is important to guarantee that the monolayer is formed on the surface of the adsorbent material for the accurate estimation of surface area. In the case of weight differences, as mentioned by Lobel et al. (1988) and Bomber et al. (1989) in their investigations, the monolayer formation by adsorption of the surfactant is not guaranteed. One way to ensure the monolayer formation is by applying the Langmuir model to the adsorption model (Sandoval-Ibarra et al., 2015).
Methylthionine chloride (C16H18CIN3S: Methylene Blue (MB) is one of the adsorbates used to evaluate the monolayer formation. This organic dye has been used to estimate the specific surface area of different materials such as bentonite (Pinzón-Bello, 1997), cotton fiber (Kaewprasit et al., 1998) as well as terrestrial and aquatic plants (Vilar et al., 2007; Bestani et al., 2008; Rubín et al., 2010). Rubín et al. (2005) and Pratiwi et al. (2019) evaluated the adsorption capacity of MB in Sargassum muticum (Yendo) Fensholt and Ulva lactuca Linnaeus. They showed that there is affinity between the MB and the algal biomass and that this adsorption fits that of the Langmuir type. Rubín et al. (2010) estimated the Sm of S. muticum according to the postulates of this model; the authors calculated an average specific surface area (Sm) of 242-747 m2 g-1, suggesting that these variations may be related to the pretreatment of the studied thalli. Therefore, the aim of this study was to estimate the Sm of different macroalgal species that belong to different morpho-functional groups (corticated, articulated calcareous, corticated foliose and coriaceous) by means of the MB adsorption technique, according to the Langmuir adsorption model.
MATERIAL AND METHODS
Sampling. From August 2016 to July 2017, 12 monthly collections of macroalgae were made, which comprised corticated, articulated calcareous, corticated foliose and coriaceous algae, also referred to as functional-form groups, functional groups (Littler & Arnold, 1982; Littler et al., 1983; Hanisak et al., 1988; Steneck & Dethier, 1994; Phillips et al., 1997; Padilla & Allen, 2000; Airoldi, 2001; Biber et al., 2004; Collado-Vides et al., 2005), morphological functional or morpho-functional groups (Balata et al., 2011; the latter is used herein) at two coastal sites in Veracruz, Mexico, Chachalacas and Villa Rica, in the southwestern Gulf of Mexico (Fig. 1). The climate in this region is sub-humid warm (Aw2) with three seasons: rainy (July to September), dry (April to May) and “nortes” (the northern winds beginning in October with the incursion of strong northern winds that persist until the end of winter). Their temporality and occurrence vary according to weather conditions (Tunnell Jr, 1992; Salas-Pérez & Granados-Barba, 2008). The sampling sites are characterized by mixed coasts with beaches, dunes, marshlands and coastal lagoons (Sánchez-Rodriguez, 1980; Geissert-Kientz, 1999).

Figure 1 Map of the southwestern Gulf of Mexico indicating the two sampling sites (marked by stars) on the coast of Veracruz, Mexico.
At Chachalacas, samples were taken at the reef plain of Primera Laja (19°27.791’N, 96°18.370’W) 700 m from the coastline. Sandy-rocky substrate and coral fragments characterize this area, with depths from 0.5 to 2.5 m (Estrada-Vargas et al., 2019). At Villa Rica (19°27.850’N, 96°18.521’W), characterized by coastal dunes and a rocky massif (García-López et al., 2017), macroalgae were sampled in the intertidal zone with site depths that varied with the tide (<1.5 m) from a sandy-rocky substrate with sparse coral fragments.
Random samplings were performed at each site, where three specimens from each species were collected by free diving. Underwater, these samples were placed in 500 ml polypropylene bottles with the surrounding water and sealed. The collected material was kept at 4°C during transportation. All the samples were processed the same day they were collected. The species identification was based on morphological features, reproductive structures and cell arrangement (Littler & Littler, 2000; Guiry & Guiry 2024). The species classification by morpho-functional groups was made according to Steneck & Dethier (1994).
Preparation of the macroalgal biomass to estimate surface area. Benthic macroalgae (171 specimens) were used for specific surface area estimation. To standardize the specific surface area estimation methodology and to minimize the error due to the amount of water, organic and inorganic substances, the material was prepared according to Rubín et al. (2010). To remove organic and inorganic particles from the macroalgal surface, the thalli were brushed and washed individually with filtered seawater (pore size 11 µm). The cleaned material was first dried at ambient temperature (72 h) and then at 60° C for 24 h and passed through a plastic sieve; the size of dry biomass was homogenized at 1.0 mm. The dried and homogenized material was stored in polypropylene airtight bags in desiccators.
Methylene Blue safety use considerations. MB has several medical uses in both human health and veterinary care, for therapeutic and diagnostic procedures. It is also used as a stain in bacteriology and as a redox coloring agent. Some common applications are for treating overexposure to certain drugs, industrial chemicals, or environmental poisons, such as excessive nitrate or cyanide compounds. In humans, a high dose of it (>500 mg) when injected has been reported to cause nausea, abdominal and chest pain, cyanosis, methemoglobinemia, sweating, dizziness, headache and confusion (Harvey, 1980). However, neither the Occupational Safety and Health Administration, the National Institute for Occupational Safety and Health, nor the American Conference of Governmental Industrial Hygienists have established permissible exposure limits for MB (NTP, 2008; NOAA, 2024). Nevertheless, it is recommended to follow the safety standards in the use of chemical reagents.
Methylene Blue adsorption by macroalgae biomass experiment. The test was based on Rubín et al. (2010), with a few modifications. MB (C.I. 52015, Merck, dye content 82 %) was the dye used to form the monolayer (Kaewprasit et al., 1998; Rubín et al., 2010). MB was dried for 2 h at 60° C; a 1000 mg l-1 standard solution was then prepared.
In determining the Langmuir type adsorption isotherms, 0.05 g of dry biomass samples were put into Erlenmeyer flasks with 50, 100, 200 and 500 mg l-1 MB dilutions. The mixtures were shaken (150 rpm) at a controlled temperature (x̅=24° C) for 2 h. Subsequently, absorbance was read in a Hach DR 5000 spectrophotometer at a wavelength of 665 nm. The samples were diluted to obtain a concentration within the Lambert-Beer law range for the dye used. All experiments were performed in duplicate, and the analytical determinations were in triplicate.
Chemical modifications for macroalgal biomass that did not show monolayer formation during the Methylene Blue adsorption experiments. Chemical modifications of the biomass were performed on those species that did not show the Langmuir isotherm during the first set of MB adsorption experiments. The carboxyl group was modified with acidic methanol solution only; however, satisfactory determination coefficients were not obtained (R2>0.6) same scenario was observed with lipid extraction with methanol alone for some species of marine macroalgae. Therefore, lipid extraction was attempted after decarboxylation, achieving R²>0.9. Consequently, the thalli underwent carboxylic acid esterification followed by extraction of the lipid fraction. Esterification was performed by suspending 1.5 g of dry biomass in 100 ml of methanol and 0.9 ml of HCl concentrate. The mixture was shaken for 24 h at 150 rpm, then washed with distilled water, decanted, and dried at 60° C for 24 h. The lipid extraction was performed by suspending 0.5 g of dry biomass in 50 ml of methanol 50% (v/v) and shaking (150 rpm) for 24 h. Finally, the biomass was washed with distilled water, decanted, and dried at 60° C for 24 h. Both processes were carried out according to Rubín et al. (2010).
The determination of isotherms was performed by placing 0.05 g of the treated biomass in Erlenmeyer flasks and adding 100, 200, 300 and 500 mg l-1 of MB dilutions. Each subsample was shaken for 12 h at 150 rpm at a controlled temperature (24° C) and pH (7.1±0.21). At a wavelength of 665 nm, absorbance readings were performed by using a UV spectrophotometer to assess the equilibrium time.
Determining maximum adsorption capacity of the monolayer for macroalgal biomass. The value of the maximum adsorption capacity of the monolayer for macroalgal biomass (Xm) was estimated by using the Langmuir adsorption model (Eq. 1), which satisfactorily describes the adsorption equilibria of both aquatic and terrestrial vegetable biomass (Vilar et al., 2007; Rubín et al., 2010).
This equation can be expressed linearly as:
Where Cf represents the solute final concentration or equilibrium (mgMB l-1), X is the amount of adsorbed solute per milligram of adsorbent (mgMB mgalga-1), and K is a constant depending on adsorption and desorption.
Estimating the macroalgal biomass surface area. The macroalgal biomass surface area (Sm) was calculated by using the equation: Sm=X mNo a, which in the specific case of the MB can be expressed as (Sharma & Forster 1994) (Eq. 3):
where Sm is the surface area (m2 galga-1), Xm is the maximum adsorption capacity of the monolayer (mgMB galga-1), N represents the Avogadro constant (6.02 x 10²³) and Am and MW represent the cross section in Armstrong (Å2) and the molecular mass (mg mmol-1) of the MB, respectively. The transversal area used by an MB molecule varies from 66 to 125 Å2 according to the observations on which its adsorption is supported (Hähner et al., 1996). However, aiming to standardize and perform an appropriate comparison of the results, this study employed the value Rubín et al. (2010) proposed for determining the Sm of macroalgae (108 Å2).
RESULTS
Macroalgal species composition. During the study period at Chachalacas and Villa Rica the best represented taxonomic group was Rhodophyta (11 species), followed by Chlorophyta (6) and Phaeophyceae (4). Digenea simplex (Wulfen) C. Agardh, Laurencia sp., Alsidium triquetrum (S. G. Gmelin) Trevisan, Caulerpa sertularioides (S. G. Gmelin) M. Howe, C. racemosa (Forsskål) J. Agardh, C. mexicana Sonder ex Kützing, Cymopolia barbata (Linnaeus) J. V. Lamouroux, Padina sp. and Dictyota sp. were present and collected from both sites. The only species collected at Chachalacas throughout 12 samplings was Halimeda scabra M. Howe, whereas at Villa Rica the recurrent species were Alsidium triquetrum, Haliptilon subulatum H. W. Johansen, Caulerpa sertularioides, Cymopolia barbata, Padina sp., Dictyota sp. and Sargassum vulgare C. Agardh. The species were classified into four morpho-functional groups: nine species were placed in the corticated group, eight in the articulated calcareous, three in the corticated foliose and one in the coriaceous group (Table 1).
Table 1 List of species, their affiliation with a morpho-functional group, sampling sites in the SW Gulf of Mexico and months of sampling in 2016-2017. CH - Chachalacas, VR - Villa Rica.
| Taxa | Morpho-functional group | Sampling site and month |
|---|---|---|
| RHODOPHYTA | ||
| Digenea simplex (Wulfen) C. Agardh 1822 | Corticated | CH: Aug |
| VR: Nov | ||
| Hypnea spinella (C. Agardh) Kützing 1847 | Corticated | VR: Apr, May |
| Laurencia sp. | Corticated | CH: Sep, Oct |
| VR: Dec-Mar | ||
| Alsidium triquetrum (S. G. Gmelin) Trevisan 1845 | Corticated | CH: Aug, Sep, Nov, Mar |
| VR: Aug-Jul | ||
| Liagora sp. 1 | Corticated | CH: Mar, Apr, Jun |
| Liagora sp. 2 | Corticated | CH: Apr-Jun |
| Haliptilon subulatum H. W. Johansen 1970 | Articulated calcareous | VR: Aug-Jul |
| Jania cf. adhaerens J. V. Lamouroux 1816 | Articulated calcareous | VR: Aug-Sep, Jun, Jul |
| Amphiroa sp. | Articulated calcareous | CH: Oct |
| Tricleocarpa cylindrica Huisman et Borowitzka 1990 | Articulated calcareous | CH: Sep, Dec, Jul |
| Galaxaura sp. | Articulated calcareous | CH: Sep, Jan |
| CHLOROPHYTA | ||
| Caulerpa sertularioides (S. G. Gmelin) M. Howe 1905 | Corticated | CH: Aug-Mar |
| VR: Aug-Jul | ||
| C. racemosa (Forsskål) J. Agardh 1873 | Corticated | CH: Sep-Nov, Jan, Feb, Apr, May |
| VR: Aug, Nov, Jan, May, Jun | ||
| C. mexicana Sonder ex Kützing 1849 | Corticated | CH: Dec-Mar |
| VR: Dec-Apr | ||
| Halimeda scabra M. Howe 1905 | Articulated calcareous | CH: Aug-Jul |
| Cymopolia barbata (Linnaeus) J. V. Lamouroux 1816 | Articulated calcareous | CH: Aug, Sep, Mar, May-Jul |
| VR: Aug-Jul | ||
| Rhipocephalus phoenix (J. Ellis et Solander) Kützing, 1843 | Articulated calcareous | CH: Jul |
| PHAEOPHYCEAE | ||
| Padina sp. | Corticated foliose | CH: Aug-Oct, Dec, Jan, Mar-Jul |
| VR: Aug-Jul | ||
| Dictyota sp. | Corticated foliose | CH: Aug, Sep, Mar-Jul |
| VR: Aug-Jul | ||
| Dictyopteris delicatula J. V. Lamouroux 1809 | Corticated foliose | CH: Sep, Nov-Feb, Apr, Jun, Jul |
| Sargassum vulgare C. Agardh 1820 | Coriaceous | VR: Aug-Jul |
Chemical modification effects applied to the macroalgal biomass that did not show monolayer formation in the first set of adsorption experiments. In brown algal species, the non-chemically treated adsorption experiments did not show a linear correlation between the final MB concentration and the algal biomass. In contrast, the treated biomass adsorption results showed that the sterilization and lipid extraction processes caused the dye to form a monolayer on the surface of Padina sp., Dictyota sp., Dictyopteris delicatula J. V. Lamouroux and Sargassum vulgare (Fig. 2).
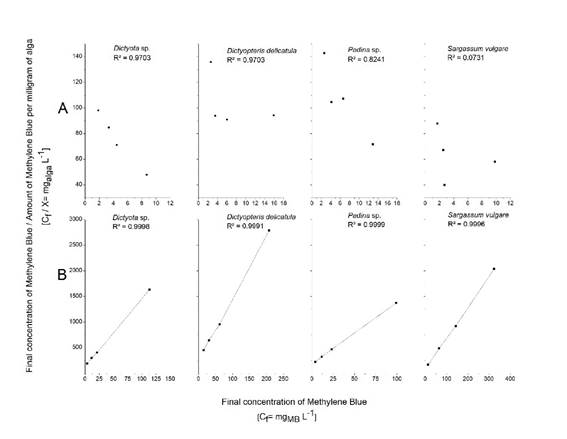
Figure 2 Methylene Blue adsorption dynamics for the brown algae Dictyota sp., Dictyopteris delicatula, Padina sp. and Sargassum vulgare with chemical treatment (A) and without it (B).
Tests for the Methylene Blue monolayer formation in macroalgae. The MB adsorption dynamics in the three studied major taxonomic algal groups showed that the dye amount adsorbed by algae increased with increasing dye concentration in the solution. However, once the saturation point was reached, the change of the MB concentration had no effect on the solute amount adsorbed per gram of algal biomass (Fig. 3). In all studied species, the adsorption equilibrium point was reached; it was associated with the MB monolayer formation on the algal surface. Correlation between the experimental data and values calculated by the Langmuir isotherm model showed a high correspondence for all the tests (R2>0.96).
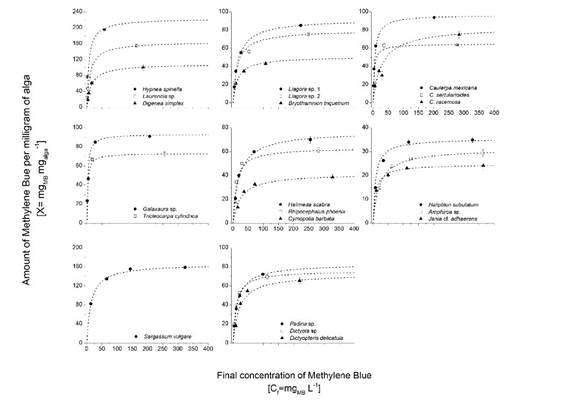
Figure 3 Methylene Blue adsorption isotherms for the studied macroalgal species. Points correspond to the experimental data, and dotted lines correspond to the adjusted Langmuir isotherms.
Estimating the surface area of macroalgae. Once all examined algal species showed a Langmuir type adsorption isotherm, it was assumed that the MB amount corresponded to that required for the monolayer formation; therefore, it was possible to estimate the surface area of each macroalga using equation 3.
Within the four morpho-functional groups studied, the coriaceous group was represented only by the Sargassum vulgare collected in Villa Rica, with 190-333 m2 g-1, whereas the corticated, corticated foliose and calcareous groups were represented by the species found at both sampling sites. The statistical analysis showed that 50% of the specimens in the corticated group in both Chachalacas and Villa Rica presented the largest surface area: 119-198 m2 g-1 and 150-233 m2 g-1, respectively, followed by the corticated foliose group: 112-157 m2 g-1 for Chachalacas and 132-182 m2 g-1 for Villa Rica. The articulated calcareous group showed the smallest surface area, 69-128 m2 g-1 for Chachalacas and 59-94 m2 g-1 for Villa Rica (Fig. 4). The statistical analysis did not show any correlation between morpho-functional group and surface area (P<0.05).
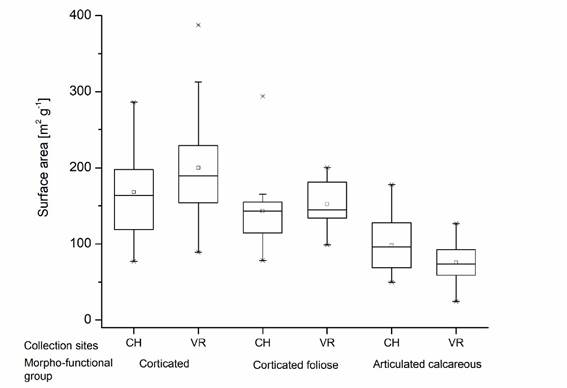
Figure 4 Surface area per morpho-functional group of macroalgae at Chachalacas (CH) and Villa Rica (VR). The coriaceous type is not included due to the occurrence of only one species (Sargassum vulgare) at one sampling site (see Table 2).
Table 2 Surface area of the examined macroalgal species in the SW Gulf of Mexico in 2016-2017. C - Chlorophyta, P - Phaeophyceae, R - Rhodophyta; nf - not found.
| Taxa | Major taxonomic group | Surface area, m2 g-1 | |
| Villa Rica (VR) | Chachalacas (CH) | ||
| Corticated | |||
| Digenea simplex | R | 103-109 | 179-199 |
| Hypnea spinella | R | 348-387 | nf |
| Laurencia sp. | R | 203-313 | 223-229 |
| Alsidium triquetrum | R | 112-256 | 106-268 |
| Liagora sp. 1 | R | nf | 87-191 |
| Liagora sp. 2 | R | nf | 105-143 |
| Caulerpa sertularioides | C | 129-220 | 77-172 |
| C. racemosa | C | 158-263 | 150-226 |
| C. mexicana | C | 221-350 | 168-281 |
| Articulated calcareous | |||
| Haliptilon subulatum | R | 44-94 | nf |
| Jania cf. adhaerens | R | 24-58 | nf |
| Amphiroa sp. | R | nf | 51-57 |
| Tricleocarpa cylindrica | R | nf | 69-133 |
| Galaxaura sp. | R | nf | 89-162 |
| Halimeda scabra | C | nf | 50-134 |
| Cymopolia barbata | C | 61-127 | 84-178 |
| Rhipocephalus phoenix | C | nf | 106-113 |
| Corticated foliose | |||
| Padina sp. | P | 99-200 | 109-294 |
| Dictyota sp. | P | nf | 104-148 |
| Dictyopteris delicatula | P | nf | 78-165 |
| Coriaceous | |||
| Sargassum vulgare | P | 190-333 | nf |
Macroalgal surface area varied significantly (tenfold) among species, from 24 m2 g-1 to 387 m2 g-1. At Chachalacas, the species with the higher surface area were Alsidium triquetrum and Caulerpa mexicana, and those with the smallest surface area were Amphiroa sp. and Halimeda scabra. At Villa Rica, Hypnea spinella (C. Agardh) Kützing and Caulerpa mexicana showed the higher surface area, whereas the smallest surface area corresponded to Jania cf. adhaerens J. V. Lamouroux and Haliptilon subulatum (Table 2).
In contrast, significant differences were observed in most cases when comparing the surface area of different thalli of the same species, except for Tricleocarpa cylindrica Huisman et Borowitzka (112±23 m2 g-1, P=0.05), Laurencia sp. 1 (226±4 m2 g-1, P=0.1) and Liagora sp. 2 (126±18 m2 g-1, P=0.07) from Chachalacas. These differences were also observed when comparing thalli from the same species between the two sites for the same sampling period. Significant differences were not observed in C. sertulariodes collected in September at both sites (159±41 m2 g-1, P=0.08); Cymopolia barbata collected in June (125±45 m2 g-1, P=0.05); Alsidium triquetrum collected in November (173±44 m2g-1, P=0.67) and Padina sp. collected in August and May (149±29 m2 g-1, P=0.07; 162±41 m2 g-1, P=0.18, respectively).
DISCUSSION
During our tests, the MB adsorption by macroalgal thalli was satisfactorily described by the Langmuir isotherms (Kaewprasit et al., 1998). Hence, it was assumed that the change in the MB concentration was due to the monolayer formation on the macroalgal surface. A high degree of accuracy in the estimation of the macroalgal surface area is thus indicated.
For brown algal species, it was necessary to apply a chemical treatment to achieve the monolayer formation, which resulted in monomolecular MB adsorption due to the modification of available sites. However, it is important to stress that the modification is specific for each type of chemical treatment; consequently, different chemicals may modify the results of the area estimation (Lodeiro et al., 2004; Rubín et al., 2005, 2010; Vilar et al., 2007). Despite this, the technique applied in this study can be used to compare macroalgae (specimens or species) analyzed under the same conditions (Rubín et al., 2005, 2010; Vilar et al., 2007). Accordingly, it can be argued that the differences found on the macroalgal surface area may be due to species-specific morphological features (Chemello & Milazzo, 2002; Bates, 2009).
Some morphology-based studies noted that the surface area is in direct proportion to the macroalgae structural complexity, with which they tended to show a higher diversity of epibionts (Chemello & Milazzo, 2002; Bates, 2009). The results of the present study agree with the above-mentioned ones. Less morphologically complex species such as articulated calcareous algae presented a smaller surface area; more complex species presented a larger surface area. However, in general, no correlation between the surface area and the morpho-functional groups was found (P<0.05). In contrast, other studies reported that less complex species, such as filamentous algae, showed larger surface areas (Parsons & Preskitt, 2007). Bates (2009) suggested that a greater morphological complexity is not necessarily related to a larger surface area, but the surface may be a function of ramifications and specific structures located along the thallus. For example, Taylor & Cole (1994) mentioned that the brown alga Carpophyllum plumosum (A. Richard) J. Agardh, characterized by fine structures on the frond, has a larger surface area than thick-frond species. In our study, the species with more developed ramification and fine thalli showed a greater surface area (Hypnea spinella and Laurencia sp.).
Another factor that could explain the differences is the surface area variation of the thallus components. The frond section for most of the species in this study was analyzed, except for Sargassum vulgare (for which samples containing both frond and stipe were analyzed) and Caulerpa species thalli (both frond and stolon were included). Christie et al. (2003) reported that the frond, the stipe and the holdfast of Laminaria hyperborea (Gunnerus) Foslie present different surface areas. Sher-Kaul et al. (1995) concluded that for stoloniferous plants the stolon and leaves modify the surface area. Armstrong et al. (2003) suggest that in determining the surface area of a species with a stolon it is important to consider the leaf to stolon ratio because the leaves provide a greater surface area than that of the stolon.
In articulated calcareous species, the differences observed in the stems of the same species could be related to both the cellular arrangement and the amount of CaCO3 (Wefer, 1980; Lee & Carpenter, 2001; Hatt & Collado-Vides, 2019). Anderson et al. (2006) noticed that for coenocytic species calcification between segments and filament adhesion to the surface influenced the surface area. Lee & Carpenter (2001) stated that the produced inorganic carbonate amount depended on the morphology of each species and on the calcification mechanisms during ontogenesis.
In this study, the specimens were collected over a year; consequently, the specimens may have presented different development stages. For example, conceptacles (specialized cavities that contain the reproductive organs) with rough ramuli (spherical branchlets) were observed in some Jania cf. adhaerens thalli; only smooth ramuli were observed in other species (absence of conceptacles). In our study, development of either conceptacles or tetrasporangia (sporangia containing four asexual spores), or both, were also observed in Haliptilon cf. subulatum and Amphiroa sp. According to Rosas-Alquicira et al. (2013) and Rover et al. (2015), tetrasporangia and conceptacle formation modify macroalgal surfaces. Vesk & Borowitzka (1984) reported that the formation of conceptacles is evident on the surface of Haliptilon cuvieri (J. V. Lamouroux) H. W. Johansen et P. C. Silva during the reproductive stage. Rosas-Alquicira et al. (2013) found that the formation of conceptacles in Amphiroa J. V. Lamouroux species allows observation of different cell growth stages on surfaces such as the elongation of the terminal layer cells and the formation of cell layers on the surface. This suggests that the increase in cell layers during the formation of reproductive structures may affect the surface area.
Regarding the differences found between the sampling sites, at each site environmental conditions could have modified the species morphology (Shaughnessy et al. 1996; Anderson et al., 2006; Parsons & Preskitt, 2007) and, therefore, the surface area estimation. Anderson et al. (2006) mentioned that the surface area varies when water movements increase in speed. Shaughnessy et al. (1996) suggested that the surface area and the thallus morphology are modified according to hydrodynamics. In the present study, Chachalacas was considered a high energy site, whereas Villa Rica was one of medium energy (Tindall & Morton, 1998).
Finally, the present study showed that the MB adsorption technique is suitable for estimating the macroalgal surface area. The differences in this morphological (relief) characteristic may be explained by: 1) species-specific morphological features, 2) the structural components that constitute the thallus, 3) the morphological changes that occur during ontogenesis, and 4) the ecosystem hydrodynamics.
There is indeed a difference in size between MB and epibionts (macro vs. micro); however, the accuracy of the proposed methodology to approximate the surface area could be a good option for studies of epibenthic assemblages because it minimizes the effect of structural differences, chemical composition and surface/relief characteristics of the host, thus allowing a comparison among different algal species. Further investigations should focus on the availability of the surface area of host macroalgae for unicellular epiphytic species that may be much less than that estimated in the present study.

