


 nueva página del texto (beta)
 Inglés (pdf)
 Artículo en XML
 Referencias del artículo
 Enviar artículo por email
 Citado por SciELO
  Similares en
SciELO
Similares en
SciELO 
 Permalink
Introduction
Historically, the lysimeters have been considered as an adequate and reliable tool for determining both evapotranspiration soil and evaporation from shallow groundwater (Aboukhaled, Alfaro & Smith, 1982; Boast & Robertson, 1982; Geoaguas Consultores, 2007; Johnson, 2009; Johnson, Yáñez, Ortiz & Muñoz, 2010; Kelleners, Soppe, Ayars, Simunek & Skaggs, 2005; King, Tanner & Suomi, 1957; Mardones, 1998; Nichols, 1993; Rana & Katerji, 2000; Ritchie & Burnett, 1968; Schwaerzel & Bohl, 2003). Lysimeter is a device that isolates a volume of soil or earth between the surface and a certain depth (Johnson, 2009; Muller, 1996; Wright, 1990), allowing estimating the discharges of the system product of evaporation.
One should keep in mind that direct evaporation from groundwater is one of the most important components of the hydrologic cycle in the aquifer systems presence of shallow aquifers (Shah, Nachabe & Ross, 2007). According to some authors (Xu & Chen, 2005; Zhang et al., 1999), lysimeters represent the best experimental technique to investigate the capillary upward flow of shallow groundwater and the processes associated with water balance in the soil, accumulation of salt, water use of plants and their response to growth.
According to Johnson (2009), one of the great advantages of the lysimeter, compared to other methods (chamber, Bowen relationships, Eddy correlations, remote perceptions, etc.), is the direct measurement that is made of evaporation, which offers reliable and accurate results. Likewise, the numerical simulation works by Hernández (2012) confirmed that the evaporation developed within the soil profile in a lysimeter depends on the height of the water table imposed (the higher the water table, the evaporation occurs closer to the surface) and the hydrodynamic properties of the soil. In addition, lysimeters are easy to install with a minimum of technical and economic effort (Schwaerzel & Bohl, 2003), allowing in situ determination of evaporation, water retention in the soil, groundwater density, hydraulic conductivity and other hydrogeological variables. According to Xu & Chen (2005), the information obtained with the lysimeters could significantly improve the reliability of evapotranspiration and water balance models.
Further, the data obtained from the lysimeters could allow the calibration and validation of numerical models that solve the flow and transport equations, as well as the prediction of atmospheric variables (Boulet, Braud & Vauclin, 1997; Braud, Dantas-Antonino, Vauclin, Thony & Ruelle, 1995; Gowing, Konukcu & Rose, 2006; Gran, Carrera, Olivella & Saaltink, 2011; Novak, 2010; Saravanapavan & Salvucci, 2000).
In Chile, this has been analyzed in some studies (Dirección General de Aguas [DGA] & Departamento de Ingeniería Hidráulica y Ambiental Pontificia Universidad Católica de Chile [DICTUC], 2009; DGA & Ingeniería y Consultoría en Aguas [ICASS], 2014; Goeaguas Consultores, 2007; GP Consultores & Collahuasi, 2008; Johson, 2009; Johson et al., 2010; Kampf et al., 2005; Mardones, 1986; 1998; Sociedad Minera Salar de Atacama [MINSAL], 1988; Ugarte, 2007) carried out near the salt flats (depths of the water table of 1 m to 2 m) of the endorheic basins of the Chilean Altiplano, where it was identified that evaporation constitutes the main discharge of the water system, and may even consume all the resources that come in the form of precipitation.
Therefore, the aim of this work is to characterize evaporation rates from shallow groundwater using the lysimeter approach in a closed basin in the Altiplano of northern Chile. A reliable estimate of the rate of evaporation from a lap needs to have a complete knowledge of the mechanisms involved, such as the movement of liquid water, water vapor, heat and solutes, as well as a good understanding of the processes that participate in the evaporation of water into the atmosphere, given the spatial variability of the soils and the different depths of the groundwater (DGA & ICASS, 2014; Hernández, 2012).
Materiales y Métodos
Study area
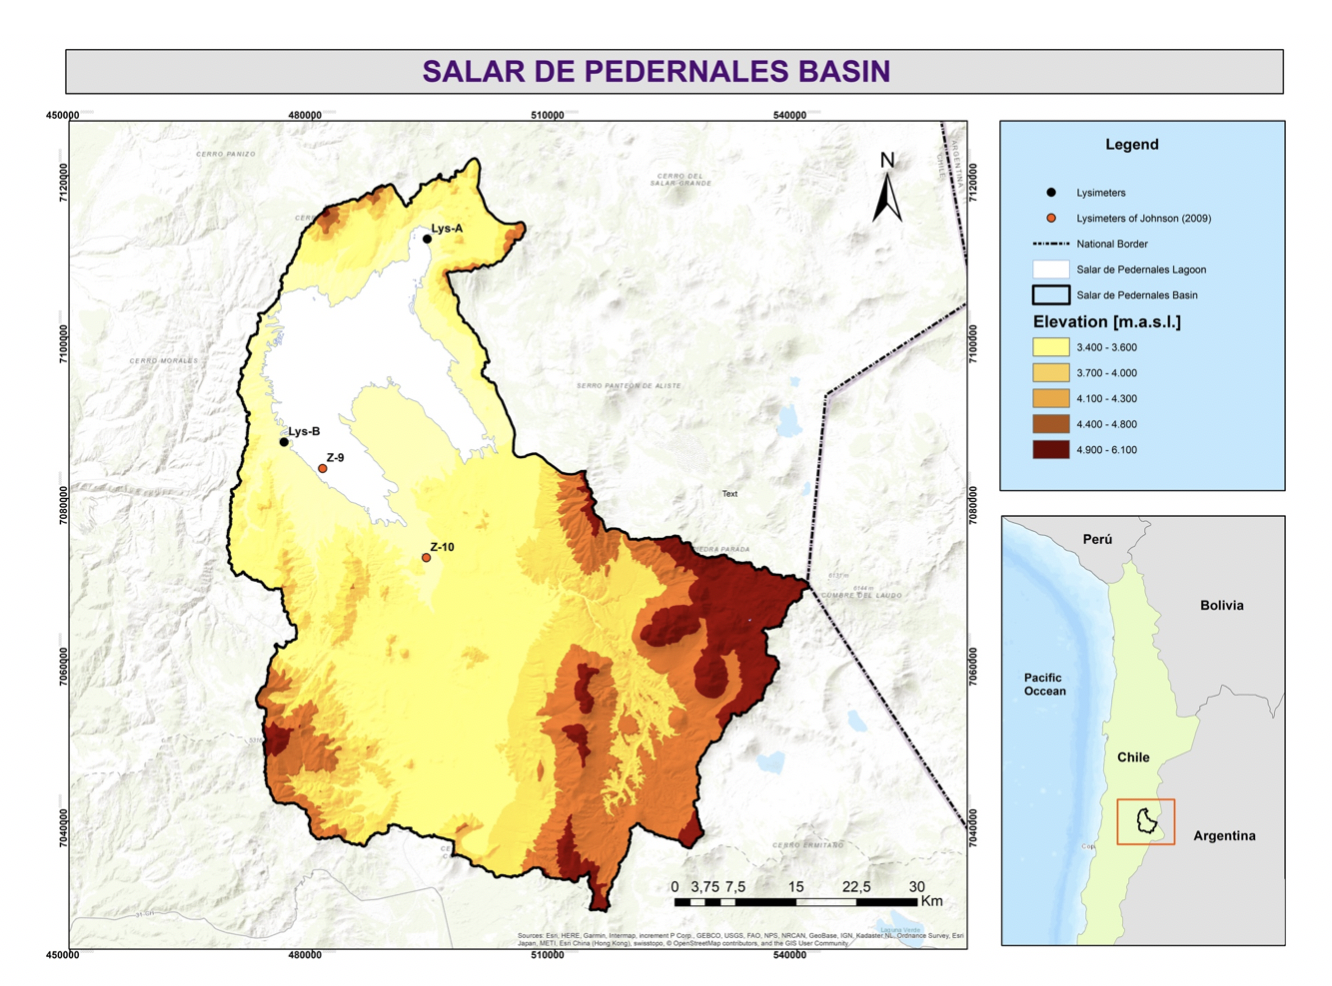
The lysimeters installed belong to the Dirección General de Aguas (DGA, the Chilean General Water Directorate) and are located in the Salar de Pedernales basin (Figure 1), an endorheic basin with an area of 3596.2 km2, which constitutes the basin with the largest area and the largest salt flat (Álvarez, 1984) in Chile’s Region III, denominated the Region of Atacama (28° S coordinate). It is located in the Chilean Altiplano to the east of the exorheic basin of the Salado river and is separated from it by the mountain of Domeyko, which in this zone is about 200 m thick (DGA & Aquaterra, 2013).
Source: Author's own elaboration.
Figure 1 Geographic location of lysimeters in the Salar de Pedernales basin, Chile.
According to Johnson (2009), the average altitude of the Salar de Pedernales basin is 3995 m, with its highest peaks above 6000 masl in the sector of Sierra Nevada (border with the Republic of Argentina). DGA & Aquaterra (2013) indicate that the basin is characterized by important morphological, climatological, and geological variations. Its geology is a mixture of sedimentary, volcanic, and plutonic rocks formations. In addition, the basin has a large salt flat with the same name (Salar de Pedernales) that covers an area of about 326 km2 and corresponds to a gypsum and halite crust, with few and small lagoons generally attached to the banks. The Salar de Pedernales’ flints have a cartography of soils characterized by three types (DGA & AMPHOS 21, 2016): Type 1 (Recent saline soils, 22.04%), which identifies recharge zones, zones of transition of fresh and salt water, shallow water table, soils in constant formation by chemical precipitation of salts and high reflectivity; Type 2 (saline core soils, 41.37%), which has low reflectivity, low permeability, presence of a salt crust and deeper water level; Type 3 (transition soils, 36.59%), which presents intermediate characteristics between soils Type 1 and Type 3. Álvarez (1984), by using seismic refraction profiles, determined that the crust in the ice water sector has a thickness of 7 m and deep is formed by compact halite, finding some levels of clay silt and/or colluvial materials. The lagoons located to the northeast are deep waterholes in the crust of salt, the others are superficial. The Salar is located on the western boundary of the basin, at its northern end.
The general slope of this hydrographic basin leads to this depression, with La Ola river as its most important superficial tributary running from south to north and, from the plain La Ola, with an inclination of about 45° towards the east. Upstream of this change of direction located to the east of Punta Negra hill, the river receives some tributaries, mainly from the east, where the Leoncito river and the Juncalito river stand out, both of permanent runoff.
Technical characteristics of the lysimeters
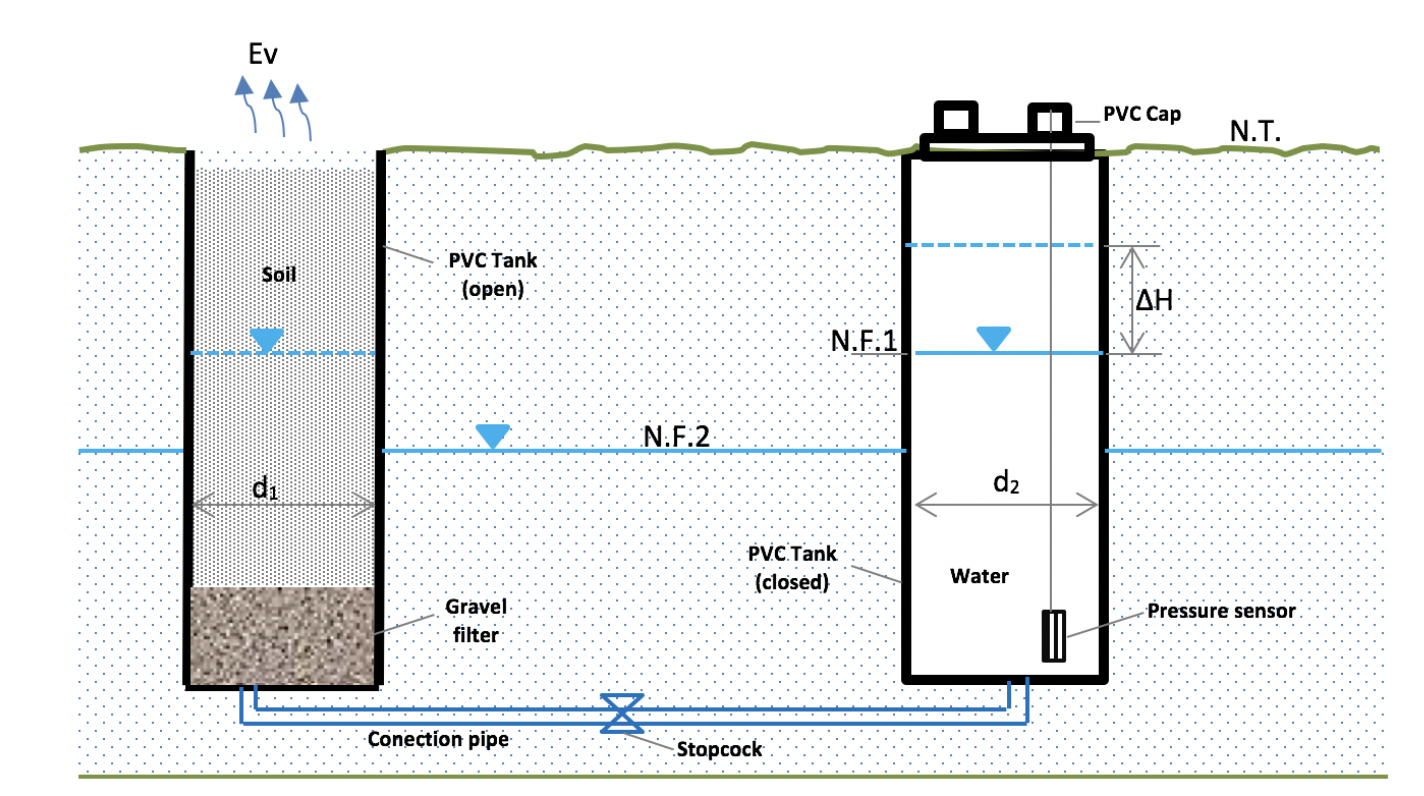
The lysimeters designed and implemented are variable-charge and consist of two PVC tanks of the same diameter (40 cm)1 and different length (1 m and 1.2 m), connected at the bottom by a pipe that allows the circulation of water from the closed storage tank towards the open tank containing the soil column (Figure 2). The tank with the soil sample corresponds to a cylinder of 1 m in length with a lid or cap attached at its lower end and a perforated disk, which serves to install the communication pipe and ensure uniform entry of water to the column of soil. The second tank for water storage is a cylinder 1.2 m long, which is sealed at its ends (top and bottom) and has an access with screw cap or plug of 3 inches for handling the sensor in its interior. This device allows recharging the tank with water and access to the pressure sensor to download its level and temperature information.
Source: Author's own elaboration.
Figure 2 Conceptual scheme of installed lysimeters to measure evaporation from groundwater. *Symbology: d1= diameter of the PVC Tank (open); d2= diameter of the PVC Tank (closed); N.T.= Ground level; N.F.1= Watertable of the PVC tank (closed) when being filled with water; N.F.1= Aquifer groundwater level; ∆H= eight difference recorded from t1 to t2.
Table 1 shows the location information of the two lysimeters shown in Figure 1, their coordinates, soil type, geological unit described in the bibliography, and geological age.
Table 1 Location and geological information of the lysimeters.
| Lysimeters | Coordinates | Altitude | Dimensions | Geological information of the place where the lysimeters are located | ||||
| UTM X |
UTM Y |
masl | Diameter [m] |
Length [m] |
Description | Unit | Geologic time |
|
| Lys-A | 494.226 | 7.112.124 | 3.381 | 0.40 | 1.0 | Ql. Limes, fine sands, clays and levels rich in organic matter. |
Lacustrine deposits | Quaternary |
| Lys-B | 476.514 | 7.086.962 | 3.371 | 0.40 | 1.2 | Qs(a). Scale of wet saline silts: halite and gypsum texture microrugosa. |
Recent saline deposits | Quaternary |
* masl: meters above sea level.
Source: Elaboration based on the data provided by DGA & AMPHOS 21 (2016).
Methodology
In the area of interest, the scarcity of vegetation cover in the soil causes that the evaporation from the water table is important to quantify and not only the evaporation from the sheet of surface water. Due to this, data have been collected from different lysimeters installed in the study area, which allow to estimate the evaporation rate from the depth of the water table. In addition, there are tests of the chamber used by other authors (DGA & ARCADIS, 2015; Johnson, 2009; Johnson et al., 2010). The methodology used for processing the information is described below.
The data of the lysimeters correspond to the period between February and November 2015, recording the hydrostatic pressure within the water column every 10 minutes. With this pressure data, and the known depth of the sensor in the column, it is possible to obtain the depth of the groundwater level inside the soil column so that its temporal variation in the specified time window is known. When performing a mass balance inside the lysimeter, considering only evaporation outputs, the following has to be applied:
Where h is the height of water above the pressure sensor, A S and A D correspond to the cross-sectional area of the floor and the reservoir, respectively, and Ev represents the outputs of the system by evaporation. Since both areas are the same, the formula is:
It should also be noted that the temporal variable h is geometrically related to the depth of the water table within the soil column z, by means of the following relationship:
where p td is the depth of the sensor in the tank, Z dpm is the dimension from which the depth of the sensor is measured and Z t corresponds to the ground level. In this way, combining the previous equations and noticing that the geometric characteristics of the lysimeter are constant parameters, the formula is:
Based on the above, considering that the variations in the depth of the water table within the lysimeter floor column are due solely to evaporation losses, it is possible to know the evaporation rate that would be obtained for different depths in the soil column, since there are discrete records of depth as a function of time. According to what has been stated, it is necessary to analyze the signals from the sensors for each of the lysimeters in order to estimate evaporation rates.
Results and Discussion
Measurements with the lysimeters
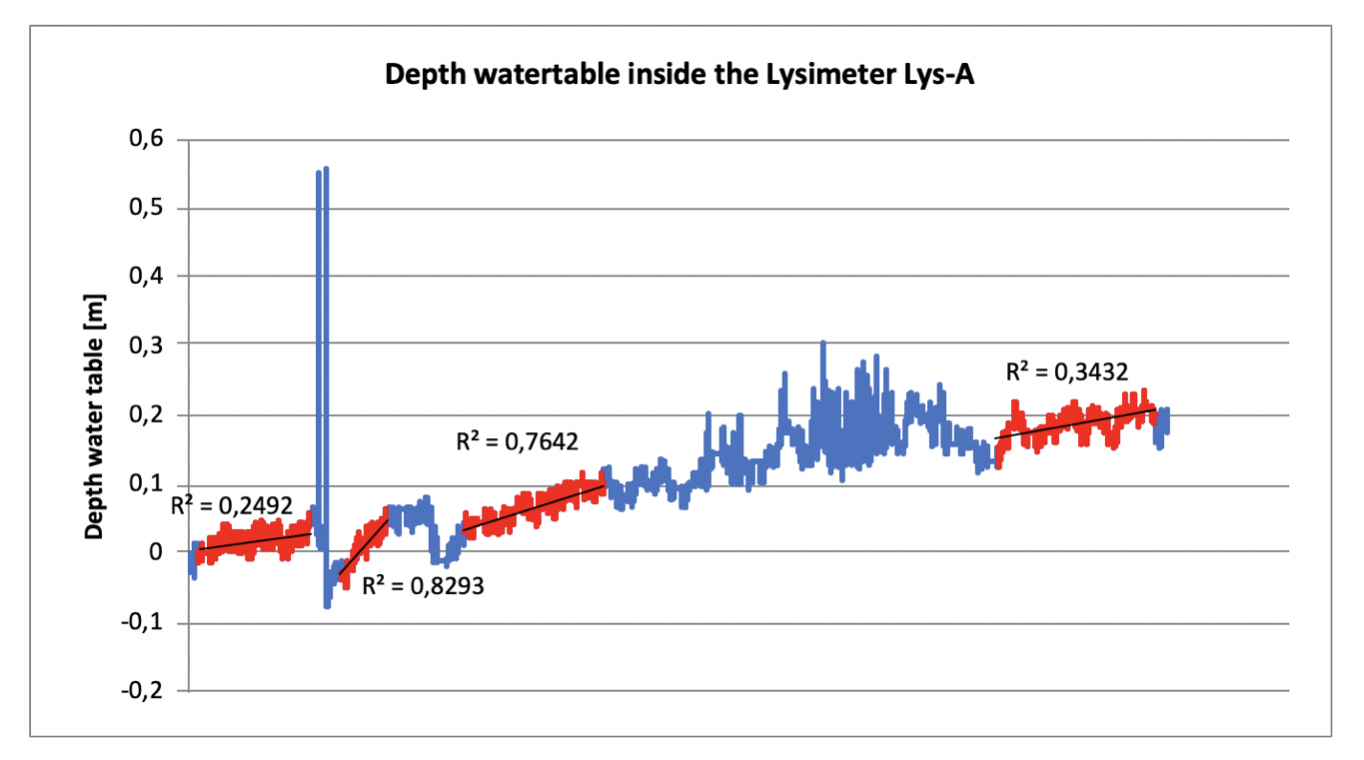
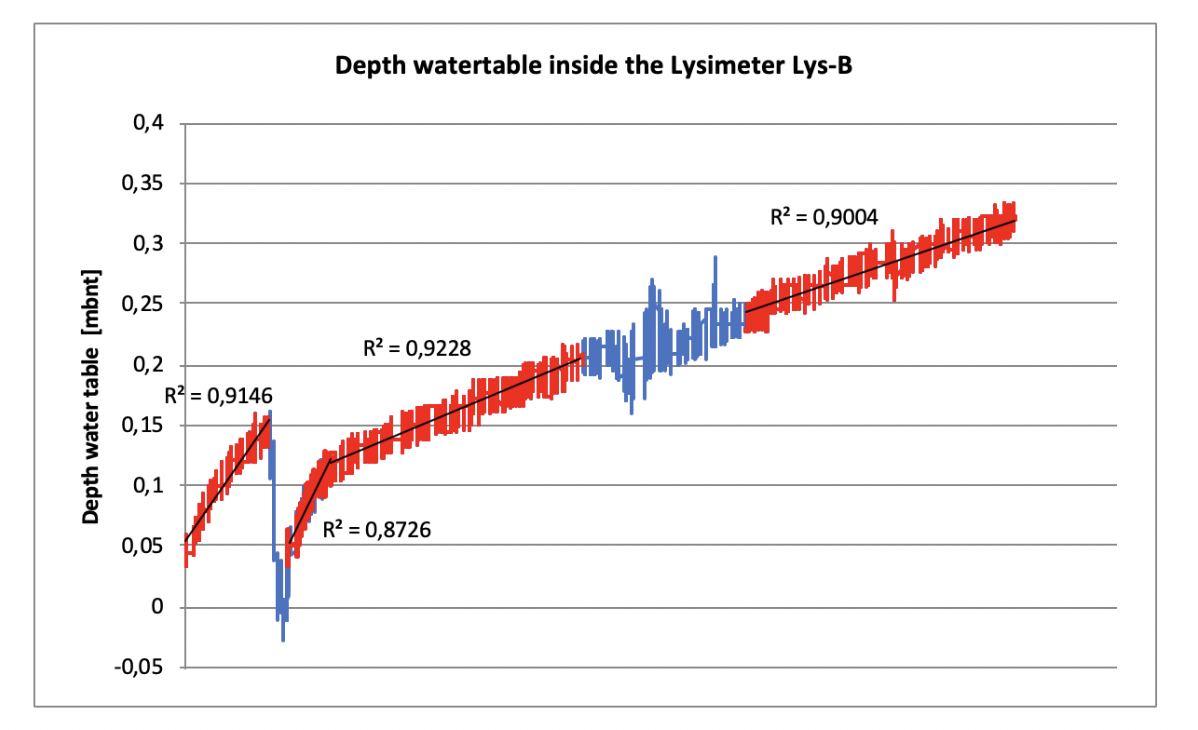
In the Salar de Pedernales basin, information is available on two lysimeters installed in Phase 2 of the project Diagnóstico de Disponibilidad Hídrica en Cuencas Alto-Andinas de la Región de Atacama made by DGA & ARCADIS (2015). From the temporary depth signals of the phreatic level in the lysimeter floor column, it is possible to identify sections that allow estimating evaporation rates and associating them to the corresponding depth. In Figure 3 and Figure 4 the identified sections are shown, together with the respective linear regressions whose slope corresponds to the estimated rate. In addition, the quadratic errors of each of the regressions are shown.
Source: Author's own elaboration.
Figure 3 Temporal variation of the water table and identified sections in Lys-A.
Source: Author's own elaboration.
Figure 4 Temporal variation of the water table and identified sections in Lys-B.
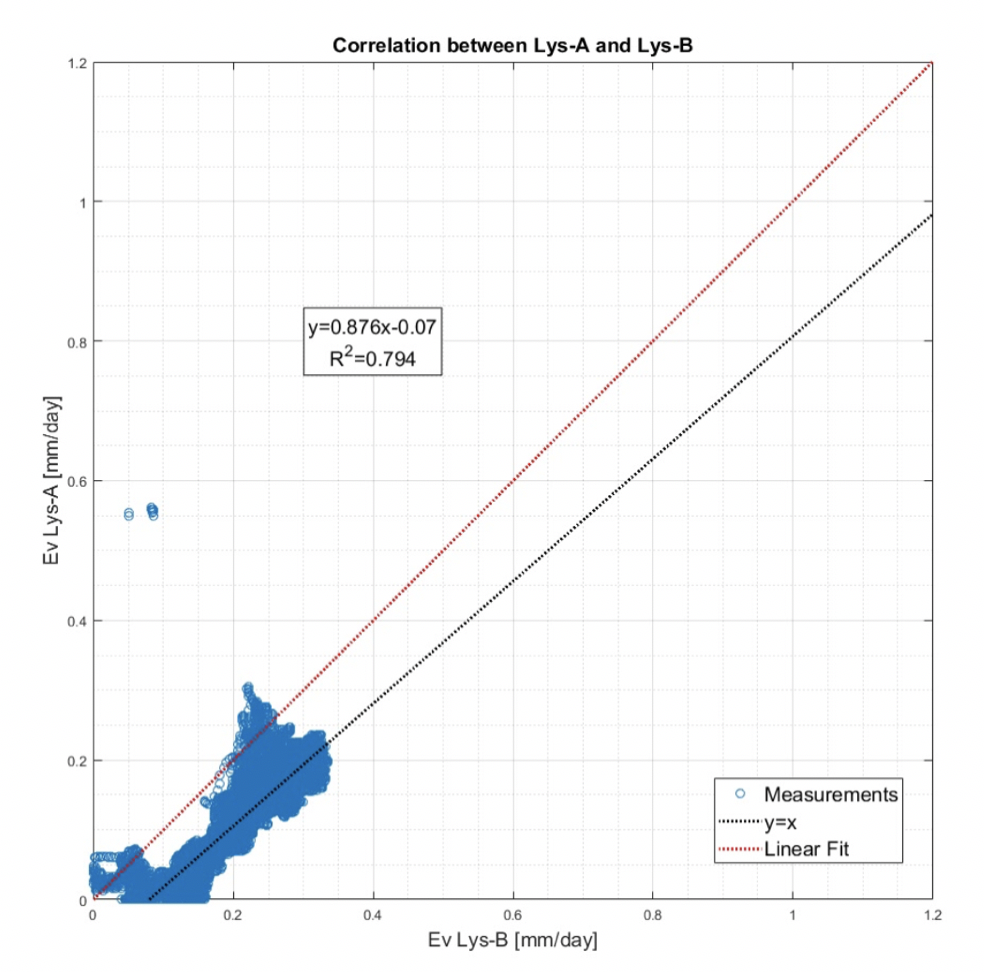
Figure 5 shows a comparison of the measurements made in Lys-A and Lys-B lysimeters, whose relationship between both series of data has been very significant with a correlation coefficient (R2) value of approximately 0.80.
Source: Author's own elaboration.
Figure 5 Comparison between the evaporation values measured in lysimeters Lys-A and Lys-B.
From the regressions the evaporation rate associated to the corresponding depth of the phreatic level was obtained, with which it was possible to construct curves of evaporation rate versus groundwater depths (Figure 6).
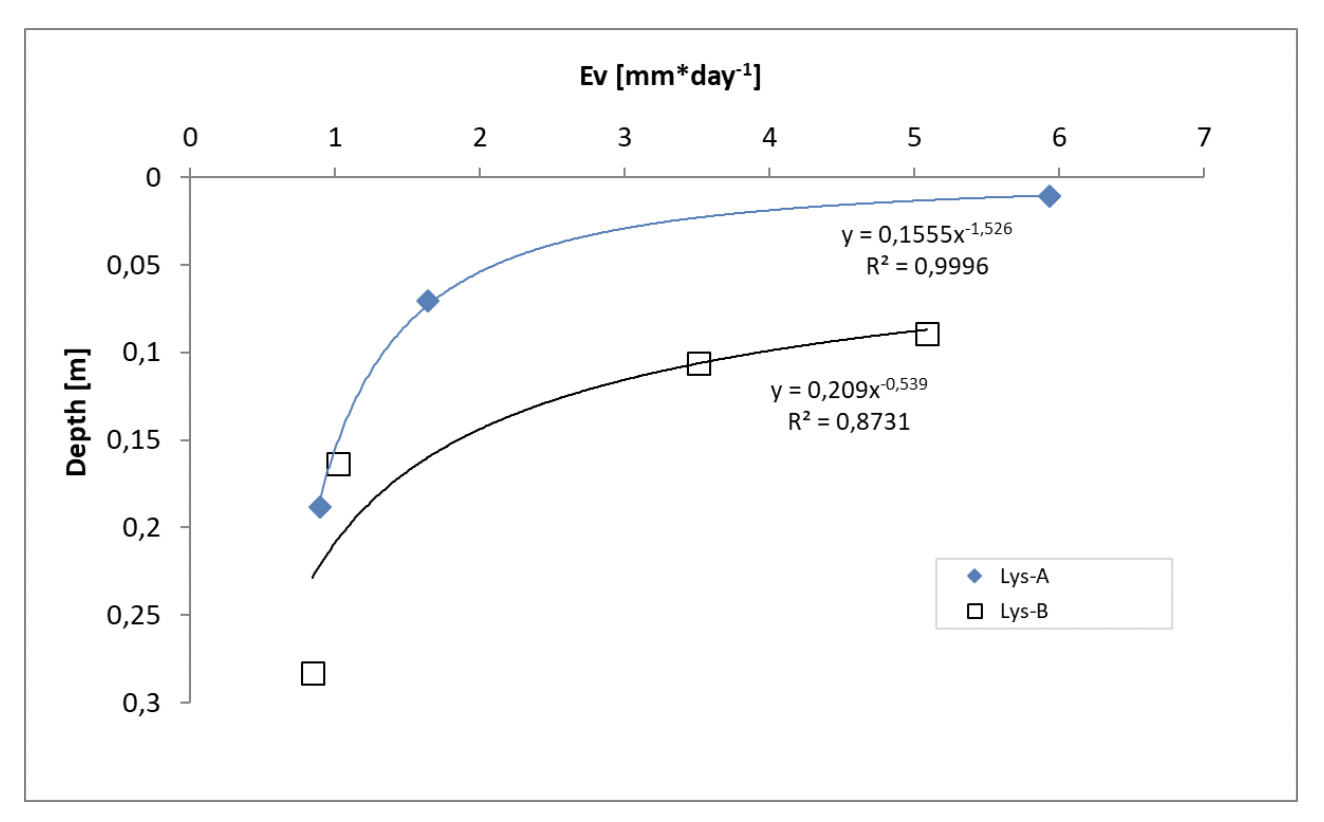
It is worth mentioning that during the period of data collection, there are recharges to the system (liquid precipitation and snow on the floor column), which constitute inputs to the control volume that have not been considered in the deduction of the equations. This is why the original signals have anomalies that hinder the processing of information and generate inconsistent results. However, a good fit is highlighted based on the coefficient of determination R2, so the values correspond well with what was expected by the literature (Grilli & Vidal, 1986; Johnson, 2009).
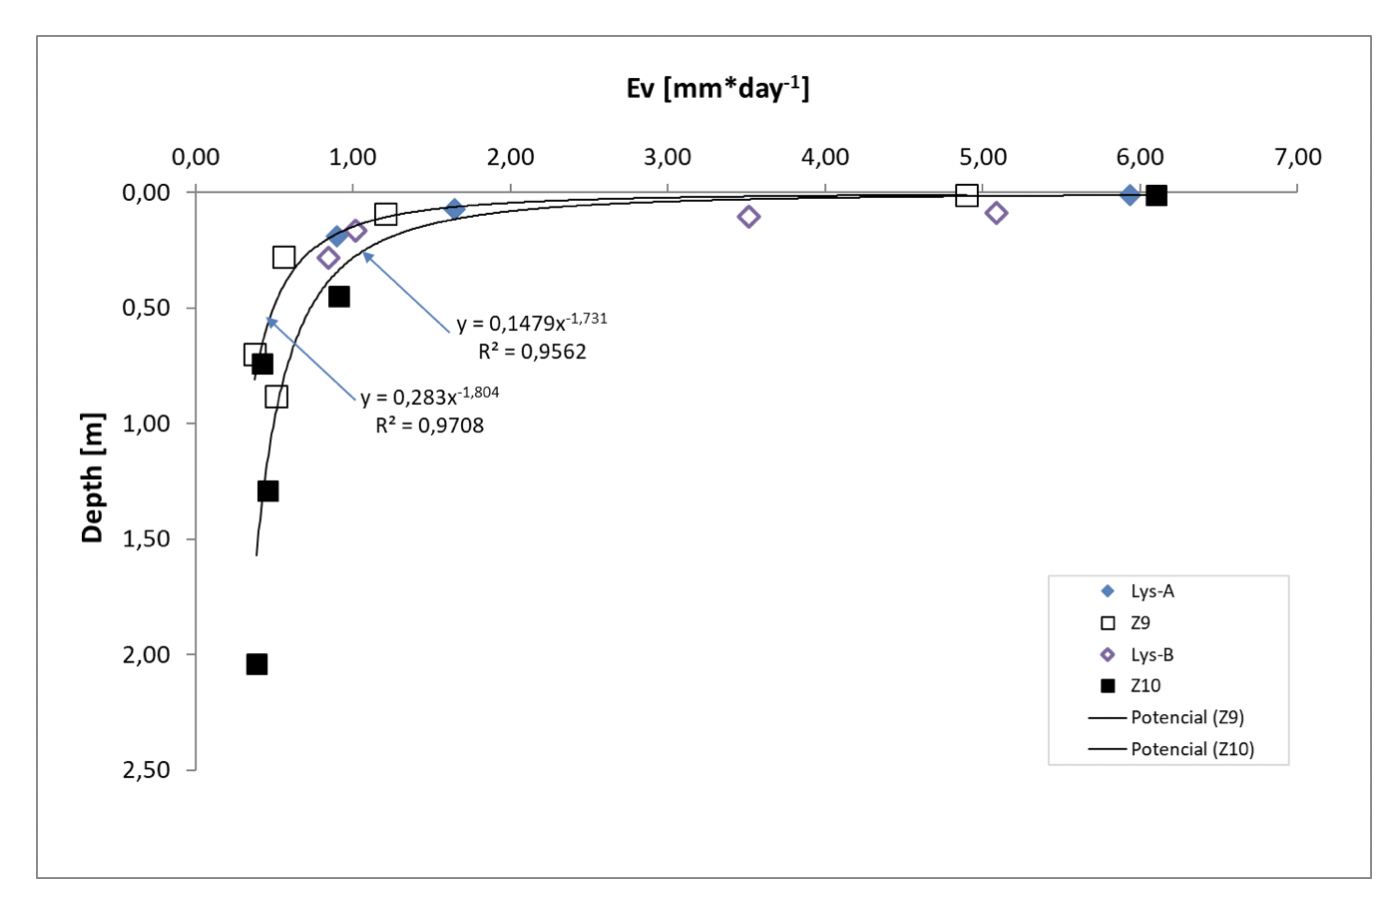
In addition, in Figure 7 it can be seen that the data agree with that obtained by Johnson (2009) in his measurements close to the study area (Z9 and Z10), in particular in the value of the tank evaporation (superficial level) close to 6 mm·day-1. In other salt flats (for example, Salar de Atacama, 2000 masl), evaporation rates have been estimated with lysimeters ranging from 2.0 mm/year (core) to 5.8 mm/day in marginal zones (DGA & ICASS, 2014; Mardones, 1986).
Source: Author's own elaboration.
Figure 7 Comparison of the results obtained in the lysimeter Lys-A and Lys-B with Johnson (2009).
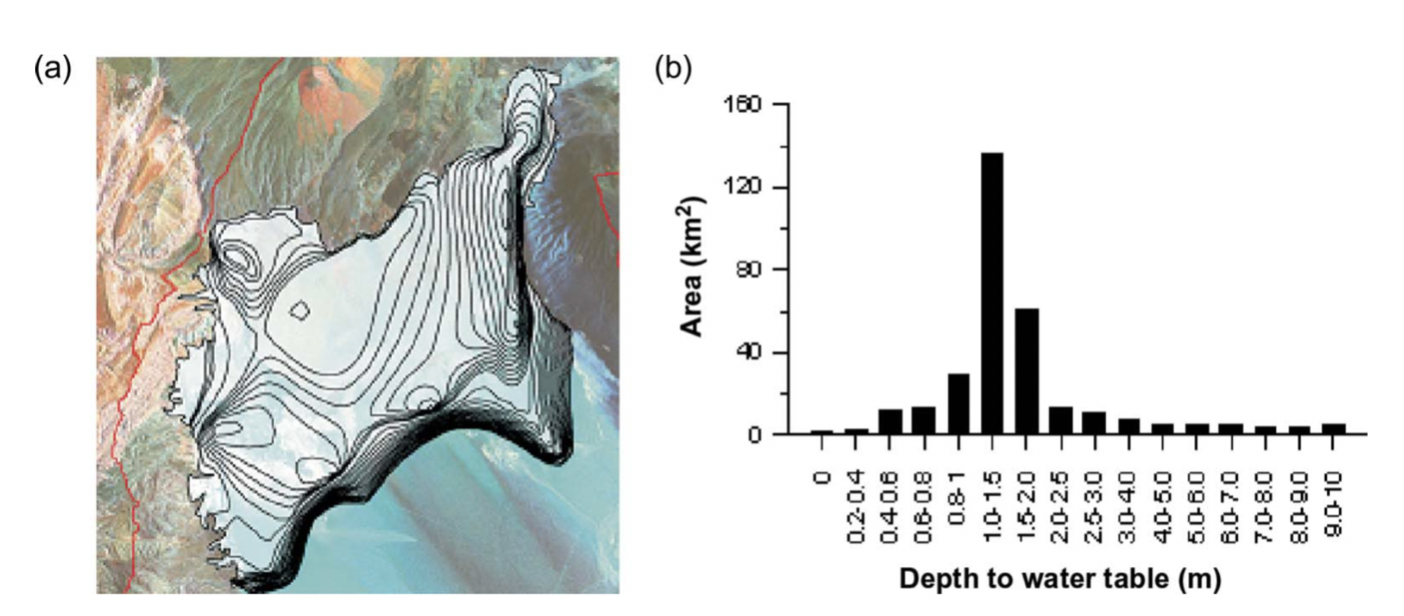
Additionally, within the analysis it has been necessary to identify the evaporating surfaces in the basin, which correspond to those discharge areas where the water table is shallow (between 0.0 m or lámina libre and 2.5 m or depth of extinction of evaporation from groundwater). These areas correspond, in particular, to salt flats, lakes, lagoons, bofedales, and waterholes, since in them it is possible to see outcrops, which account for the shallowness of the water table and, therefore, should be considered when moment to estimate the direct evaporation in the basin. In this sense, representative evaporation rates can be estimated by type of soil in those areas where the water table reaches the extinction depth, through the use of satellite images and interpolations with nearby wells of known level. This process is known as generation of isoprofundities or productivity bands (Figure 8) that are useful for estimating the net evaporation of a basin.
Source: Johnson et al (2010).
Figure 8 Groundwater depth in the Salar de Pedernales: (a) iso-depth map and (b) iso-depth ranges.
Net Evaporation measurements
To calculate the net flow or net evaporation of the Salar de Pedernales basin, the following procedure has been followed:
Estimate the area associated with the i-th depth band, 𝐴𝑖 (𝑘𝑚2).
Calculate, with the curve of the chosen scenario, the evaporation rate associated with said depth,
-
Calculate the evaporation flow of each band:
-
Estimate the net flow of the total 𝑁 isoprofundity bands, between 0 m and 2.5 m:
Moreover, the recharge water in Pedernales Salar basin is very diluted, having a low electrical conductivity of 0 μS to 1000 μS and, as it flows and comes into contact with the rock and sediments, it is loaded with ions through processes of hydrolysis of silicates and dissolution of sulphate-chloride salts. Thus, the water is enriched in sodium, calcium, sulfate, arsenic, boron, and other elements and the most representative hidrochemical facie is sulfate-calcium-sodium-chlorinated magnesium (Figure 9) (DGA & AMPHOS 21, 2016). This ion enrichment process is also produced by the high-water evaporation rate and as the residence time of the groundwater in the saturated aquifer increases.
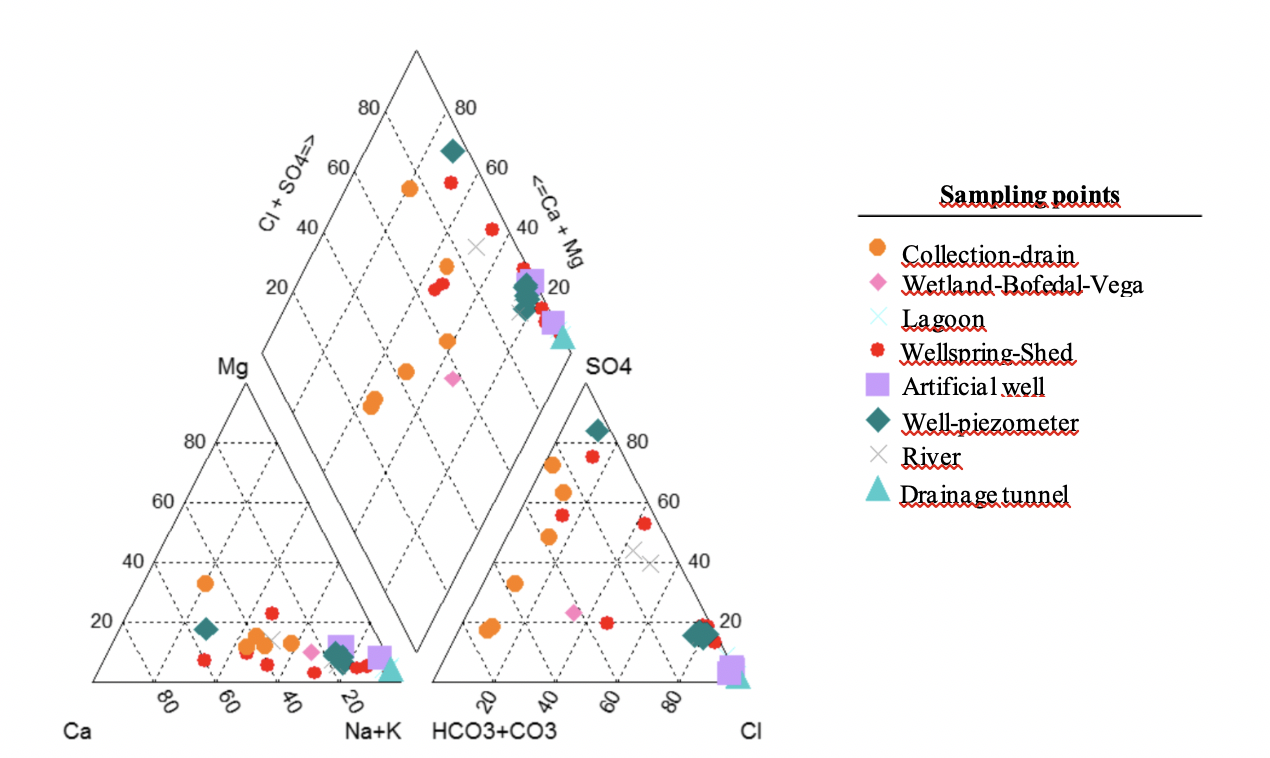
Source: DGA & AMPHOS 21 (2016).
Figure 9 Piper diagrams characteristic of the waters in the Salar de Pedernales basin.
Based on the above, net evaporation values of the basin have been estimated between 1400 L·s-1 and 1900 L·s-1 with an average value of 1650 L·s-1 with an error uncertainty of 5%, 11%, and 47% with respect to the average, minimum, and maximum values estimated in the literature. This range is within the values estimated by other studies that have used other types of tools to calculate evaporation (microlysimeters, dome, numerical model, water balance, and evaporation curves vs. altitude), among which those that range from 150 L·s-1-900 L·s-1 (DGA & MOP, 1987), 380 L·s-1 (CPH, 2004), 580 L·s-1 (Johnson et al., 2010) up to 3200 L·s-1 (EDRA, 1999) can be mentioned, with an average value of 1575 L·s-1. However, a possible range of evaporation has been considered in order to address the uncertainty that exists in the estimation of the iso-depth (and, consequently, in the areas), since in some cases there are no drill holes or nearby wells to be able to define in detail the depth bands associated with the corresponding evaporation rate.
In addition, the Dome method (widely used in the literature consulted) tends to underestimate the evaporation rates determined by lysimeters, sometimes with differences of an order of magnitude of 100% (Johnson et al., 2010). This may be due to the fact that the evaporation rates determined by the dome depend strongly on atmospheric or climatic conditions (solar radiation, air temperature, relative humidity, and wind speed) and, to a lesser extent, on the lithology of the saturated area, while the evaporation of groundwater obtained by the lysimeter is less influenced by atmospheric conditions and with greater dependence on the type of soil, the moisture content, and the depth of the water table.
Conclusions
The evaporation rates from the groundwater were calculated in two lysimeters installed in the Salar de Pedernales of the Chilean Altiplano. An exponential-potential type adjustment was made to construct the evaporation curves as a function of the saturation depth representative for the study area. The results show a good correlation of the Lys-A and Lys-B lysimeter data with the zones Z9 and Z10 by Johnson (2009), so these scenarios are associated with the characteristics of these lysimeters (incident radiation and soil type). The net evaporation rate of the Salar de Pedernales basin was estimated between 1400 L·s-1 and 1900 L·s-1 with an uncertainty of error with respect to the average of 5% and between 11% and 47% with respect to the minimum values and estimated maximums in literature. Therefore, the values obtained with lysimeters are comparable with the estimates made by other authors with other techniques, which confirm that lysimeters are an adequate tool for the determination of soil evapotranspiration and evaporation from shallow groundwater, whose components are key in the hydrology of arid and semi-arid zones and for the management of protected natural spaces such as salt flats, waterholes, fertile plains, and bofedales. In addition, the lysimeters are important for the study of hydrological processes in endorheic basins, because in the absence of runoff a significant percentage of the balance corresponds to evapotranspiratory flows. However, more data and information from drilling, stratigraphy, meteorological data, infiltration and permeability tests, geomorphological parameters, topographic detail, among others, are needed to reduce the gap or uncertainty in the calculation of the evaporation value from shallow groundwater in the study area. In addition, it would be advisable to perform other field tests with constant load lysimeters that allow estimating the evaporation rates at a given depth with less noisy signals and comparing the results with empirical methods such as the Penman-Monteith method, Eddy correlations and remote perceptions.

