


 nueva página del texto (beta)
 Inglés (pdf)
 Artículo en XML
 Referencias del artículo
 Enviar artículo por email
 Citado por SciELO
  Similares en
SciELO
Similares en
SciELO 
 Permalink
Introduction
Self-concept is one of the most important findings in the field of motivational research, that is why psychology has always given special attention to it, considering it as an important predictor of behavior and emotional and cognitive outcomes of people (Marsh & Martin, 2011).
Self-concept may be defined as the person’s own self-perceptions that are formed through experience and interpretations of the own environment (Shavelson, Hubner & Stanton, 1976). Likewise, the relationship between self-concept and academic performance is one of the most intriguing questions in the research of self-concept. This relationship has been studied extensively in the past decades (Esnaola, Goñi & Madariaga, 2008; Marsh & Martin, 2011; Marsh & Shavelson, 1985), considering self-concept as a relevant motivation source for behavior (in general) and learning behaviors (in particular).
Self-concept plays a crucial and central role in the development of personality. As noted in the main psychological theories, a positive self-concept is the basis of good personal, social, and professional functioning; personal satisfaction and feeling good about yourself depend largely on it. Therefore, achieving a positive self-concept is one of the most pursued objectives in numerous psychological intervention programs (educational, clinical, community, civic, etc.), for which strategies and resources are demanded for their improvement (Esnaola et al., 2008).
Self-concept includes references of how the persons self-perceive, not only in the physical (Goñi, 2009), academic (Marsh & Martin, 2011), and social areas (Madariaga & Goñi, 2009) but also in a more private or individual sphere, the personal self-concept (Goñi, 2000).
Goñi (2000) and Goñi et al. (2011) consider four dimensions for the personal self-concept: the affective-emotional self-concept (how a person sees him/herself as to emotional adjustment or regulation of emotions); ethical/moral self-concept (how much a person considers him/herself an honest person); the self-concept of autonomy (the perception of to which point the person decides on his/her life according to his/her own criteria); and self-realization self-concept (how a person looks him/herself regarding the achievement of his/her life goals). These dimensions are measured through the Personal Self-concept Questionnaire (APE, from its Spanish initials), consisting of 18 questions used in this study.
Therefore the present instrumental study (Montero & León, 2005) has been conducted to provide empirical support for the factorial division of the APE proposed by Goñi et al. (2011), which is justified by the importance of checking the factorial structure of the instrument and the psychometric equivalence of it in different groups. Since, in the context of intergroup comparison, it is essential to consider the need to conduct the adaptation of an instrument of psychological measurement that meets all criteria of equivalence, but -above all- to consider whether the same factorial structure is applicable to different groups of subjects or, more generically, to different populations (Abalo, Levy, Rial & Varela, 2006).
Methods
Participants
In this study, 1485 subjects participated (800 women and 685 men), they are all university students in Mexico. The subjects’ age ranged between 18 and 26 years, with an average of 20.55 and a standard deviation of 1.86 years.
The sample was randomly divided into two parts using the Statistical Package for Social Sciences (SPSS) version 18.0, in order to perform parallel studies to corroborate and verify the obtained results (cross validation).
The first half (subsample 1) was composed of 769 subjects (421 women and 348 men). The ages range between 18 and 26 years, with an average of 20.50 and a standard deviation of 1.86 years.
The second half (subsample 2) was composed of 716 subjects (379 women and 337 men). The ages range between 18 and 26 years, with an average of 20.61 and a standard deviation of 1.87 years.
Instrument
The APE by Goñi et al. (2011) is a Likert scale with five response options ranging from false to true, consisting of 18 items measuring: personal perceptions of self-realization (6 items), honesty (3 items), autonomy (4 items), and emotional adjustment (5 items).
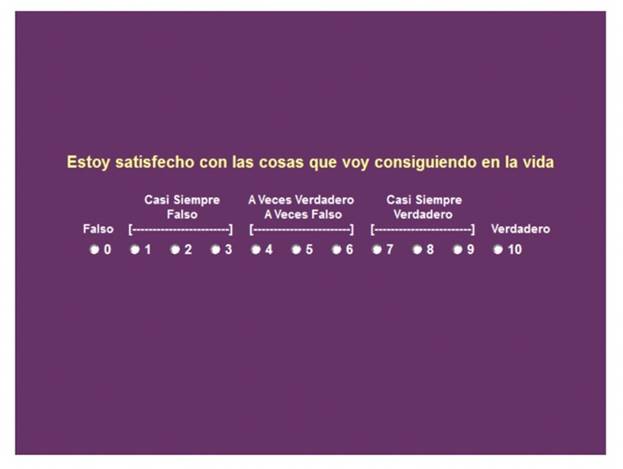
For this study, three adaptations to the original version by Goñi et al. (2011) were made. First adaptation, in the original version, five response options are scored: (0) false; (1) almost always false; (2) sometimes true, sometimes false; (3) almost always true; and (4) true. In the version used in this research the subject chooses between 11 possible answers. The original scale was combined with this study’s version to make it as follows: false (0); almost always false (1, 2, and 3); sometimes true, sometimes false (4, 5, and 6); almost always true (7, 8, and 9); and true (10). This first adaptation is justified because the subjects, as students, are used to the scale from 0 to 10, since they have been evaluated by the educational system in Mexico.
The second adaptation was to change some terms used in the items of the original version in order to use a language appropriate to the context of the Mexican culture.
The third adaptation was to apply the instrument through a computer (Figure 1), in order to allow the storage of data without prior encoding stages, with greater precision and speed.
Procedure
Students from the different degree programs offered at the Faculty of Physical Culture (FCCF) of the Autonomous University of Chihuahua were invited to participate. Those who agreed to participate signed a consent letter. Then, the instrument described above was applied using a personal computer (administrator module of the instrument of the scales editor of typical execution) in a session of about 20 min in the computer labs of the FCCF. At the beginning of each session students were given a brief introduction on the importance of the study and how to access the instrument; they were asked the utmost sincerity and they were guaranteed the confidentiality of the data obtained. Instructions on how to respond were displayed on the first screens, before the first instrument item. At the end of the session they were thanked for their participation.
Once the instrument was applied, data was collected by the results generator module of scales editor, version 2.0 (Blanco et al., 2013).
Finally, the results obtained were analyzed using the SPSS 18.0 and AMOS 21.0.
Data analysis
The psychometric analysis was conducted in two steps: (1) Exploratory factor analysis and (2) confirmatory factor analysis and factorial invariance, in order to obtain proof that presents the best properties for the conformation of body image scores in college students.
Classic Analysis of the Psychometric properties of the scale.
The first step in analyzing the psychometric properties of the questionnaire was to calculate the mean, standard deviation, skewness, kurtosis, and discrimination indexes of each item. Then, those that obtained a kurtosis or an extreme asymmetry, or a discrimination index below 0.3 were removed from the scale.
Then, to determine the minimum number of common factors capable of reproducing, in a satisfactory manner, the observed correlations between the instrument items (with good discrimination), two separate exploratory factor analysis with subsamples 1 and 2 were made, from the method of maximum verisimilitude, based on the criterion of Kaiser-Guttman (Costello & Osborne, 2005). Moreover, to ensure an adequate representation of variables (items), only those whose initial communality was higher than 0.30 were kept, after a varimax rotation (Costello & Osborne, 2005).
Subsequently, the reliability of each of the factors of the models obtained in both subsamples was calculated through the coefficient Alpha Cronbach (Elosua & Zumbo, 2008; Nunnally & Bernstein, 1995) and the coefficient Omega (Revelle & Zinbarg, 2009; Sijtsma, 2009).
Confirmatory factor analysis and factorial invariance.
Two measurement models were submitted to comparison: Model 1 (M4), a four-factor model according to the original distribution of the items in the questionnaire and Model 2 (M3), a three-factor model according to the results of exploratory factor analyzes.
To conduct the confirmatory factorial analysis, the AMOS 21 software was used (Arbuckle, 2012). Variances in terms of error were specified as free parameters. In each latent variable (factor), a structural coefficient was set associated to one, so that the scale was equal to one of the observable variables (items). The estimated method used was the maximum credibility, following the recommendation by Thompson (2004), so, when the confirmatory factorial analysis is used, it is necessary to verify not only the fit of the theoretical model, but it is also recommended to compare the fit indexes of some alternative models to select the best one.
To evaluate the adjustment model, the statistical chi-squared, the Goodness-of-fit Index (GFI), the standardized root mean square residual (SRMR), and the root mean square error of approximation (RMSEA) were used as absolute adjustment measures. Adjusted Goodness of Fit Index (AGFI), the Tucker-Lewis Index (TLI), the Comparative Fit Index (CFI) were used as measures of increasing adjustment. The chi-squared fit index divided by degrees of freedom (CMIN/GL) and the Akaike Information Criterion (AIC) were used as adjusting measures of Parsimony (Byrne, 2010; Gelabert et al., 2011).
Subsequently, following the recommendations by Abalo et al. (2006), an analysis of the factorial invariance of the questionnaire for the subsamples was made, taking the best measurement model obtained in the previous stage as a base.
Finally, the reliability of each of the dimensions of the measurement models obtained in each subsample was calculated through Cronbach’s alpha (Elosua & Zumbo, 2008; Nunnally & Bernstein, 1995) and Omega coefficient (Revelle & Zinbarg, 2009; Sijtsma, 2009).
Results
Exploratory factor analysis (first and second factorial solutions)
In Table 1, the results of the descriptive analysis and the discrimination indexes (total-item correlation corrected) of each of the 18 items on the questionnaire in the subsample 1 and subsample 2 in the total sample are summarized. The answers to all items reflect mean scores ranging between 7.42 and 8.35, and the standard deviation offers, in all cases, higher values than 1.40 (within a response range between 0 and 10). With the exception of items 3 and 11, all values of skewness and kurtosis are within ± 2.5, so it is inferred that the variables are reasonably fit to a normal distribution. Regarding discrimination indexes of all items, they discriminate satisfactorily, obtaining discrimination indexes above 0.35 (Brzoska & Razum, 2010).
Table 1 Descriptive Analysis and discrimination indexes of the questionnaire items A. subsample 1 and subsample 2.
| Subsample 1 | Subsample 2 | ||||||||||
|---|---|---|---|---|---|---|---|---|---|---|---|
| Ítem | M | DE | AS | CU | ri-total | M | DE | AS | CU | ri-total | |
| Item 1 | 8.60 | 1.72 | -1.50 | 2.71 | 0.58 | 8.52 | 1.84 | -1.67 | 3.49 | 0.58 | |
| Item 2 | 5.50 | 3.17 | -0.14 | -1.10 | 0.52 | 5.52 | 3.12 | -0.05 | -1.08 | 0.49 | |
| Item 3 | 7.81 | 2.06 | -1.02 | 1.18 | 0.52 | 7.79 | 2.03 | -0.87 | 0.39 | 0.55 | |
| Item 4 | 9.29 | 1.41 | -3.16 | 12.97 | 0.27 | 9.31 | 1.62 | -3.73 | 16.01 | 0.24 | |
| Item 5 | 7.49 | 2.78 | -0.98 | 0.00 | 0.53 | 7.48 | 2.72 | -0.87 | -0.24 | 0.54 | |
| Item 6 | 5.05 | 3.23 | 0.03 | -1.09 | 0.45 | 5.20 | 3.20 | -0.06 | -1.06 | 0.44 | |
| Item 7 | 7.25 | 3.11 | -0.84 | -0.55 | 0.48 | 7.33 | 3.14 | -0.90 | -0.45 | 0.40 | |
| Item 8 | 8.22 | 1.91 | -1.18 | 1.30 | 0.41 | 8.24 | 1.86 | -1.20 | 1.43 | 0.41 | |
| Item 9 | 6.75 | 3.02 | -0.52 | -0.84 | 0.57 | 6.93 | 2.97 | -0.63 | -0.69 | 0.54 | |
| Item 10 | 5.22 | 3.33 | 0.00 | -1.18 | 0.41 | 4.98 | 3.24 | 0.14 | -1.08 | 0.40 | |
| Item 11 | 7.81 | 2.07 | -1.11 | 1.50 | 0.54 | 7.87 | 2.03 | -1.08 | 1.41 | 0.53 | |
| Item 12 | 6.69 | 2.98 | -0.48 | -0.85 | 0.60 | 6.61 | 2.99 | -0.47 | -0.89 | 0.54 | |
| Item 13 | 6.81 | 3.18 | -0.85 | -0.39 | 0.27 | 6.79 | 3.25 | -0.84 | -0.47 | 0.15 | |
| Item 14 | 7.20 | 3.00 | -0.78 | -0.61 | 0.59 | 7.01 | 3.02 | -0.71 | -0.66 | 0.62 | |
| Item 15 | 7.36 | 2.50 | -0.89 | 0.29 | 0.49 | 7.35 | 2.49 | -0.97 | 0.42 | 0.44 | |
| Item 16 | 8.25 | 1.94 | -1.40 | 2.33 | 0.61 | 8.30 | 1.90 | -1.41 | 2.36 | 0.63 | |
| Item 17 | 5.49 | 3.12 | -0.09 | -1.05 | 0.52 | 5.42 | 3.14 | -0.07 | -1.05 | 0.45 | |
| Item 18 | 7.38 | 2.46 | -0.99 | 0.67 | 0.28 | 7.26 | 2.52 | -0.99 | 0.63 | 0.22 | |
Note: M = mean; SD = standard deviation; AS = asymmetry; CU = kurtosis; ri-Total = total-item correlation corrected.
Source: Author’s own elaboration.
In the subsample 1, responses to all items reflect mean scores that oscillate between 5.05 and 9.29, and the standard deviation provides, in all cases, higher values than 1.40 (within a response range between 0 and 10). With the exception of items 1, 4, and 16, all values of skewness and kurtosis are within the range ± 1.50, so it is inferred that the variables are reasonably fit a normal distribution. As for the discrimination indexes of the 18 items in the questionnaire, 15 of them discriminate satisfactorily and the remaining three (4, 13, and 18) get a discrimination index below 0.40 (Brzoska & Razum, 2010).
In the subsample 2, responses to all items reflect mean scores that oscillate between 4.98 and 9.31, and the standard deviation provides, in all cases, higher values than 1.60 (within a response range between 0 and 10). With the exception of the items 4 and 16, all values of skewness and kurtosis are within the range ± 1.50, so it is inferred that the variables are reasonably fit a normal distribution. As for the indices of discrimination, as in the subsample 1, of the 18 items of the questionnaire, 15 discriminate satisfactorily and the remaining three (4, 13, and 18) get a discrimination index below 0.40 (Brzoska & Razum, 2010).
After a varimax rotation (Costello & Osborne, 2005), the exploratory factor analysis of the 15 items with a satisfactory rate of discrimination, in both subsamples, revealed a three-factor structure; leading to eliminate three of the 15 items analyzed. The set of the selected factors explained 48.70% of the variance in the first sub-sample and 48.99% of the variance in the second subsample (Tables 2 and 3).
Table 2 Eigenvalues and percentage of variance explained by each of the retained factors. Exploratory Factorial Analysis of Subsamples 1 and 2. Rotated Solution
| Subsample 1 | Subsample 2 | ||||||
|---|---|---|---|---|---|---|---|
| Factors | Eigenvalues | % of variance | % accumulated | Eigenvalues | % of variance | % accumulated | |
| Self-realization | 2.33 | 19.45 | 19.45 | 2.42 | 20.18 | 20.18 | |
| Autonomy | 1.88 | 15.66 | 35.11 | 1.79 | 14.90 | 35.08 | |
| Emotional adjustment | 1.75 | 14.59 | 48.70 | 1.67 | 13.91 | 48.99 | |
Source: Author’s own elaboration.
Table 3 Items grouped by factor. Rotated solution. Exploratory Factorial Analysis of Subsamples 1 and 2.
| Subsample 1 | Subsample 2 | ||||||
|---|---|---|---|---|---|---|---|
| Item | F1 | F2 | F3 | F1 | F2 | F3 | |
| 1. I am satisfied with the things I am getting in life | 0.75 | 0.75 | |||||
| 3. So far the important things that I have set in life I have accomplished them | 0.73 | 0.78 | |||||
| 11. I overcome the difficulties as they arise | 0.54 | 0.64 | |||||
| 16. I'm proud of how I'm leading my life | 0.83 | 0.78 | |||||
| 5. To do anything I need the approval of others | 0.73 | 0.69 | |||||
| 9. I find it hard to start something without the support of others | 0.53 | 0.46 | |||||
| 12. When making a decision, I rely too much on the opinion of others | 0.64 | 0.64 | |||||
| 14. I find it hard to make decisions by myself | 0.58 | 0.52 | |||||
| 2. I find it hard to overcome a moment of discouragement | 0.58 | 0.64 | |||||
| 6. I consider myself a very nervous person | 0.52 | 0.46 | |||||
| 10. I am more sensitive than most people | 0.56 | 0.55 | |||||
| 17. I suffer too much when something goes wrong | 0.61 | 0.56 | |||||
Note: F1 = Self-realization F2 = Autonomy F3 = Emotional adjustment
Source: Author’s own elaboration.
Congruency between the factors of the two factorial solutions (cross-validation)
The values of the Congruency coefficients and Pearson correlation coefficients between the factor weights of the factors obtained in the exploratory factor analyses conducted with subsample 1 and subsample 2 indicate, suggested by Cureton & D'Agostino (1983), Mulaik (1972), and Cliff (1966), a high congruence between pairs of factors (Table 4).
Table 4 Coefficients of congruence and Pearson correlation between saturations of the factors obtained in the exploratory factor analysis of subsample 1 and subsample 2.
| Factors | Coefficient of Congruence | Correlation coefficient |
|---|---|---|
| Self-realization | 0.997 | 0.943 |
| Autonomy | 0.999 | 0.969 |
| Emotional adjustment | 0.996 | 0.700 |
Source: Author’s own elaboration.
Reliability of the subscales (internal consistency)
The subscales (factors) resulting in the exploratory factor analysis, of both subsamples, possess mostly internal consistency values above 0.70 in both samples, demonstrating adequate internal consistency for this type of subscales, particularly when considering the reduced number of items (Table 5).
Table 5 Coefficient alpha and omega for the factors obtained in the exploratory factor analysis of subsample 1 and subsample 2.
| Subsample 1 | Subsample 2 | |||
|---|---|---|---|---|
| Factor | Ω | α | Ω | α |
| Self-realization | 0.808 | 0.828 | 0.827 | 0.849 |
| Autonomy | 0.719 | 0.806 | 0.670 | 0.784 |
| Emotional adjustment | 0.656 | 0.717 | 0.639 | 0.700 |
Source: Author’s own elaboration.
Confirmatory factor analysis for subsample 1 and subsample 2
The overall results of confirmatory factor analysis in the subsample 1 (GFI = 0.933; RMSEA = 0.062, IFC = 0.913) and the subsample 2 (GFI = 0.916; RMSEA = 0.070, IFC = 0.887),for the M4 model, indicate that the measurement model in both subsamples is acceptable (Table 6).
Table 6 Absolute, incremental, and Parsimony fit indexes for the generated models. Subsamples 1 and 2.
| Absolute indexes | Incremental Indexes | Parsimony Indexes | |||||||||
| Model | X 2 |
GFI | RMS EA |
SR MR |
AG FI |
T LI |
CFI | CMIN/DF | AIC | ||
| First factor solution (subsample 1) | |||||||||||
| M4 | 508.945* | 0.933 | 0.062 | 0.064 | 0.911 | 0.897 | 0.913 | 3.945 | 592.945 | ||
| M3 | 139.514* | 0.972 | 0.048 | 0.038 | 0.957 | 0.965 | 0.973 | 2.736 | 193.514 | ||
| Second factor solution (subsample 2) | |||||||||||
| M4 | 577.299* | 0.916 | 0.070 | 0.069 | 0.889 | 0.866 | 0.887 | 4.475 | 661.299 | ||
| M3 | 163.204* | 0.963 | 0.055 | 0.034 | 0.944 | 0.952 | 0.963 | 3.200 | 217.204 | ||
Note: * p < 0.05; GFI = goodness of fit index; RMSEA = root mean square error of approximation; SRMR = Standardized Root Mean Square Residual; AGFI = adjusted goodness of fit index; TLI = Tucker-Lewis index; CFI = comparative fit index; CMIN/DF = chi-squared fit index divided by degrees of freedom; AIC = Akaike information criterion
Source: Author’s own elaboration.
Table 7 Standardized solutions confirmatory factor analysis for the M4 Model. Subsample 1 and subsample 2.
| Subsample 1 | Subsample 2 | ||||||||
|---|---|---|---|---|---|---|---|---|---|
| Item | F1 | F2 | F3 | F4 | F1 | F2 | F3 | F4 | |
| Factor weights | |||||||||
| 1. I am satisfied with the things I am getting in life | 0.78 | 0.78 | |||||||
| 3. So far the important things that I have set in life I have accomplished them | 0.74 | 0.78 | |||||||
| 7. I have not yet achieved anything that I consider important in my life | 0.46 | 0.38 | |||||||
| 11. I overcome the difficulties as they arise | 0.62 | 0.68 | |||||||
| 13. If I could start my life again I would not change it too much | 0.35 | 0.24 | |||||||
| 16. I'm proud of how I'm leading my life | 0.84 | 0.83 | |||||||
| 5. To do anything I need the approval of others | 0.71 | 0.70 | |||||||
| 9. I find it hard to start something without the support of others | 0.67 | 0.65 | |||||||
| 12. When making a decision, I rely too much on the opinion of others | 0.76 | 0.70 | |||||||
| 14. I find it hard to make decisions by myself | 0.72 | 0.74 | |||||||
| 4. I am a person you can trust | 0.40 | 0.38 | |||||||
| 8. I am a person of word (I comply what I promise) | 0.75 | 0.78 | |||||||
| 18. My promises are sacred | 0.55 | 0.54 | |||||||
| 2. I find it hard to overcome a moment of discouragement | 0.63 | 0.64 | |||||||
| 6. I consider myself a very nervous person | 0.58 | 0.57 | |||||||
| 10. I am more sensitive than most people | 0.56 | 0.58 | |||||||
| 15. I am a emotionally strong person | 0.46 | 0.40 | |||||||
| 17. I suffer too much when something goes wrong | 0.69 | 0.62 | |||||||
| Correlations between factors | |||||||||
| F1 | - | - | |||||||
| F2 | 0.54 | - | - | ||||||
| F3 | 0.66 | 0.44 | - | - | |||||
| F4 | 0.57 | 0.76 | 0.30 | - | - | ||||
Note: F1 = Self-realization; F2 = Autonomy; F3 = Honesty; F4 = Emotional adjustment.
Source: Author’s own elaboration.
The overall results of confirmatory factor analysis in the first (GFI = 0.972, RMSEA = 0.048, CFI = 0.973) and second (GFI = 0.963; RMSEA = 0.055, IFC = 0.963) subsample, the second model tested (M3) that corresponds to a three-dimensional structure according to the results of the exploratory factor analysis of the questionnaire items, indicate that this measurement model is better than the previous model and its setting is optimal (Table 6). The three factors of this model explain together approximately 62% of the variance in both subsamples.
Furthermore, according to the results in Table 8, seven out of the 12 items have saturations equal or greater than 0.70 in its intended dimension (items 1, 3, 5, 12, 14, 16, and 17) in the first subsample and six in the second subsample (items 1, 3, 5, 12, 14, and 16). Also observed in both subsamples are moderate intercorrelations between factors evidencing an adequate discriminant validity between them.
Table 8 Standardized solutions confirmatory factor analysis for the model M3. Subsample 1 and subsample 2.
| Subsample 1 | Subsample 2 | ||||||
|---|---|---|---|---|---|---|---|
| Item | F1 | F2 | F3 | F1 | F2 | F3 | |
| Factor weights | |||||||
| 1. I am satisfied with the things I am getting in life | 0.79 | 0.79 | |||||
| 3. So far the important things that I have set in life I have accomplished them | 0.74 | 0.77 | |||||
| 11. I overcome the difficulties as they arise | 0.60 | 0.66 | |||||
| 16. I'm proud of how I'm leading my life | 0.85 | 0.85 | |||||
| 5. To do anything I need the approval of others | 0.71 | 0.70 | |||||
| 9. I find it hard to start something without the support of | 0.67 | 0.65 | |||||
| 12. When making a decision, I rely too much on the opinion of others | 0.76 | 0.70 | |||||
| 14. I find it hard to make decisions by myself | 0.72 | 0.73 | |||||
| 2. I find it hard to overcome a moment of discouragement | 0.63 | 0.64 | |||||
| 6. I consider myself a very nervous person | 0.58 | 0.57 | |||||
| 10. I am more sensitive than most people | 0.57 | 0.58 | |||||
| 17. I suffer too much when something goes wrong | 0.71 | 0.64 | |||||
| Correlations between factors | |||||||
| F1 | - | - | |||||
| F2 | 0.52 | - | 0.56 | - | |||
| F3 | 0.48 | 0.75 | - | 0.45 | 0.77 | - | |
Note: F1 = Self-realization; F2 = Autonomy; F3 = Emotional adjustment.
Source: Author’s own elaboration.
Invariance of the factor structure between subsamples
The fit indexes obtained (Table 9) allow to accept the equivalence of the basic measuring models between the two subsamples. Although the value of chi-squared exceeds to that required to accept the hypothesis of invariance, the CFI = 0.968, RMSEA = 0.036, and AIC = 410718 indexes contradict this conclusion, allowing to accept the base model invariance (unrestricted model).
Table 9 Goodness of fit indexes of each of the models tested in the factorial invariance.
| Model | Fit Indexes | ||||||
|---|---|---|---|---|---|---|---|
| X2 | gl | GFI | NFI | CFI | RMSEA | AIC | |
| Model without restrictions | 302.718* | 102 | 0.968 | 0.953 | 0.968 | 0.036 | 410.718 |
| Metric Invariance | 308.389* | 111 | 0.967 | 0.952 | 0.968 | 0.035 | 398.389 |
| Strong factor invariance | 312.423* | 117 | 0.967 | 0.951 | 0.969 | 0.034 | 390.423 |
Note: * p < 0.05; GFI = goodness of fit index; NFI = normed fit index; CFI = comparative fit index;
RMSEA = root mean square error of approximation; AIC = Akaike information criterion
Source: Author’s own elaboration.
Adding restrictions to the base model on factorial loads, the metric invariance was characterized. The values shown in Table 9 allow to accept this level of invariance. The GFI = 0.967 and the RMSEA = 0.035 continue to provide convergent information in this direction. Also, the AIC = 398.389 and the CFI = 0.968 do not suffer large variations over the previous model. Using the criteria for the evaluation of the nested models proposed by Cheung & Rensvold (2002), who suggest that if the calculation of the difference of the CFI of both nested models diminish in 0.01 or less, the restricted model is taken for granted, therefore, the compliance of the factorial invariance. The difference of the CFI obtained allows to accept the metrical invariance model. It can be concluded to this point that factorial charges are equivalent in the two subsamples.
Having demonstrated the metric invariance between the subsamples, the equivalences between intercepts (strong factorial invariance) are evaluated. The indixes (Table 9) show a good adjustment of this model, evaluated independently as well as analyzed toward nesting with the metric invariance model. The difference between the two CFI is less than 0.001, and the general adjustment index is 0.967, and the RMSEA is 0.034. Accepting then the strong invariance, the two evaluated models are equivalent towards the factorial coefficients and the intercepts.
Most factors obtained in the confirmatory factor analysis reached values above 0.70 of internal consistency in both samples, demonstrating adequate internal consistency for this type of subscales, particularly when the small number of items is considered (Table 10).
Table 10 Coefficient omega and alpha for the factors obtained in confirmatory factor analysis of subsample 1 and subsample 2.
| Subsample 1 | Subsample 2 | |||
|---|---|---|---|---|
| Factor | Ω | α | Ω | α |
| Self-realization | 0.836 | 0.828 | 0.852 | 0.849 |
| Autonomy | 0.807 | 0.806 | 0.785 | 0.784 |
| Emotional adjustment | 0.719 | 0.717 | 0.700 | 0.700 |
Source: Author’s own elaboration.
Discussion and conclusions
The exploratory and confirmatory factor analyzes conducted revealed a three-factor structure: self-realization, autonomy, and emotions for the APE. The factors of both subsamples showed adequate reliability, and a high congruence between pairs of factors, particularly considering the small number of items in each. This means that the results of the model are fully confirmatory. However, the obtained model does not match the one proposed by Goñi et al. (2011), and to achieve a better adjustment, a factor had to be removed and six of the 18 items had to be analyzed.
The discrepancies observed between the model proposed by Goñi et al. (2011) and the one suggested here can be attributed to social or cultural differences of the participants such as being college students in the area of physical activity. In any case, the validation of a questionnaire is a slow and continuous process, so that future research should compare these findings in larger samples (Holgado, Soriano & Navas, 2009).
However, it should be noted that the scope of these results is limited and, therefore, it is necessary that future research will confirm the obtained structure, which will allow to have more robust evidence regarding the factorial structure of the scale. Specifically, it must be demonstrated whether the invariance of the structure of the scale is accomplished by gender, age, between students of different degrees, among others. Therefore, it is considered that further studies are necessary in order to corroborate or refute the data obtained in the investigations carried out to this point. In addition to retaking the questionnaire validation increasing the number of items in each of the factors in order to improve its reliability and validity. It is also essential to check whether the scale is useful to study the relationship between self-concept and variables such as academic performance and resilience in university students.

