


 nueva página del texto (beta)
 Inglés (pdf)
 Artículo en XML
 Referencias del artículo
 Enviar artículo por email
 Citado por SciELO
  Similares en
SciELO
Similares en
SciELO 
 Permalink
INTRODUCTION
Over the past few decades, the generation and consumption of electrical and electronic equipment (EEE) have significantly increased globally, leading to a corresponding increase in the discarding of these products as waste once they reach the end of their useful life. As a result of inadequate disposal, waste containing dangerous substances like lithium-ion batteries (LIB) has negatively impacted human health and the environment (Li et al. 2015, Abhilash et al. 2021). On the other hand, waste electrical and electronic equipment (WEEE) also contains valuable matter, making it worth rescuing (Zheng et al. 2017). Adding to the above, methods for recovering valuable metals, such as hydrometallurgy, are characterized by reducing energy consumption and are environmentally friendly throughout the recovery process (Li et al. 2015, Lv et al. 2018, Li T. et al. 2022).
One key factor in achieving a successful collection rate of WEEE is the interest and knowledge of the disadvantages of improper disposal (Wibowo et al. 2022). For example, in the context of cell phone recycling, economic viability studies indicate that pilot companies must dispose of at least 20 million cell phones annually (Liu et al. 2020), therefore, a cell phone collection strategy marks a significant milestone.
Urban mining is the process of extracting valuable materials from WEEE. It is more profitable than primary mining, as it recovers secondary materials and reduces the negative impact caused by electronic waste (Liu et al. 2020). In the lithium recovery process from spent batteries, the concentrations of lithium and other metals exceed the quantities found in nature (Jung et al. 2021).
Mobile phones are considered EEE indispensable tools (Fontana et al. 2019). According to the United Nations (UN), three-quarters of the world’s population own these devices and users often upgrade or buy new devices due to fashion trends or advanced functions (Li et al. 2022).
Bruno et al. (2022), estimated the useful life of smartphones by subtracting the production year from the collection year at a WEEE plant. Their study found that the effective useful life of mobile phones can range from 2 to 9 years. Many people discard their cell phones after one or two years, even though they could still be used for several more years.
A manual dismantling process was conducted to recycle phone components. It is important to consider that lithium-ion batteries make up about 24 % of the total weight of a cell phone (Fontana et al. 2019). Additionally, from 65 to 80 % of all cell phone components can be recovered, reused, and recycled (Moltó et al. 2011).
The importance of LIB lies in their high power and energy density, long storage life, minimal self-discharge, high voltage, and wide temperature range for handling (Li et al. 2015). In addition, this metal enhances its functions when combined with cobalt, as it helps maintain the structure’s integrity and prolongs the battery’s useful life. The recovery of cobalt is an important factor that needs to be optimized. In recent years, around 80% of the cobalt obtained from primary mining has been used to produce LIB, which has caused its price to triple (Jung et al. 2021).
According to Liu et al. (2020) after separating the LIB from the cell phone parts, the first phase of the treatment is mechanical unloading and crushing. The second phase is the classification process, in which the fractions obtained are immersed in an alkaline solution, cleaned, and passed through a filter. The residue consisting of lithium cobalt oxide is sold to battery producers as raw material.
Lv et al. (2018) show that the specific process for recycling LIB begins with pretreatment, where the batteries are discharged with a saturated salt solution. During the discharge, lithium ions are mobilized from the anode to the cathode through the electrolyte. As a result, lithium concentrated in the cathode can be extracted (Jung et al. 2021). In case the lithium battery is used improperly or overloaded during its lifetime, it may deposit on the anode (Cu sheet). This can cause a reaction between the Li in the anode, and water, and release of hydrogen gas (H2) and lithium hydroxide (LiOH), which can lead to explosions. One major disadvantage is the emission of acid gases, such as corrosive hydrofluoric acid, caused by the leakage of the electrolyte lithium hexafluorophosphate (LiPF6) into the water (Jung et al. 2021) .
The most crucial active material of the cathode is LiCoO2 (Li L. et al. 2015). To recover this material, most methodologies focus on treating the black mass obtained, which contains carbon, cobalt, manganese, nickel, lithium, aluminum, copper, iron, phosphorus, and fluorine, as reported by Zheng et al. (2017) and Atia et al. (2019).
Hydrometallurgy involves a process of leaching and extraction. According to Lv et al. (2018), this process has immense potential to be implemented on an industrial scale. It is also considered to be environmentally and economically viable due to the environmental impact at the industrial scale (Liu et al. 2020).
Currently, the most common method to recover valuable metals from discarded LIB through hydrometallurgy is optimizing the performance of variables in leaching. When dealing with discarded LIB, it is common for the cathode to be embedded in aluminum foil. To detach the cathode material and remove the organic binder, it is recommended to heat it at 550 ºC for 1 hour. Afterward, a powder sample can be obtained by dissolving the material in aqua regia. This sample is analyzed for its chemical composition using the inductively coupled plasma optical emission spectroscopy (ICP-OES) method (Zheng et al. 2017). A phase identification is carried out to determine that the powder sample contains Li (Ni, Co, Mn)1/3O2. The purpose of acid leaching is to reduce the oxidation states to make dissolution more accessible.
Leaching is one of the recovery processes in which organic and inorganic acids can be used. The laboratory-scale tests have been conducted using ammonia, sulfuric acid, hydrochloric acid, nitric acid, and a reducing agent to form complexes. These tests have shown that the efficiency of the leaching process for Co, Ni, and Li increases with the concentration of the acid. However, no significant changes were observed for Mn and Al (Zheng et al. 2017).
According to Guimarães et al. (2022), the role of the reducing agent in the leaching process is not crucial from a thermodynamic standpoint because its main purpose is to enhance the extraction process. Instead, focusing on factors such as the solid/liquid ratio, acid concentration, temperature, and time is important as they have a direct influence on the efficiency of metal recovery from LIB.
There are variables and factors in the leaching process that can be optimized and studied: time, stirring speed, solid and liquid ratio (pulp density), temperature, and leaching agent concentration (Lv et al. 2018). Additionally, solvent extraction, selective precipitation, and electrochemistry can be employed. The study of the most influential variables in the electrodeposition process is suggested, through analysis with an experimental design.
There are numerous studies of the recovery of valuable metals. However, few of them explain the effects of manipulating leaching variables through experimental design (Lv et al. 2018).
To obtain detailed information on the characteristics of the cathode material after leaching, it is important to use some equipment as for ICP-OES analysis (chemical composition), X-ray diffraction (structure and morphology), spectrometer (energy dispersion) and scanning electron microscope for identification of existing metals (Zheng et al. 2017).
The quantitative characterization of the sample after leaching is a critical step. The following step is the appropriate recovery and recycling with an affordable method (Gao et al. 2018, Fontana et al. 2019).
The quantities of valuable metals obtained in previous studies are summarized in table I. It is estimated that the cathodes constitute 31% of the weight of the battery, and lithium constitutes up to 7% of the weight of the cathode (Jung et al. 2021).
TABLE I METAL CONTENT IN A SAMPLE OF LIBS CATHODES IN PREVIOUS STUDIES.
| Metal | Content (weight %) | Method | Source |
| Li, Co, Ni, and Mn | 6.76, 57.94, 0.76, 0.91 respectively | Hydrometallurgical | (Li L. et al. 2015) |
| Li, Co, Fe, C, Cu | 3.20, 23.01, 1.36, 29.53, 12.08 respectively | Volatilization | (Qu et al. 2022) |
| Li, Co, Cu, Hg, Pb, Cd | 5, 43.3, 0.7, 1.3, <0.005, 0.010 respectively | Hydrometallurgical | (Alvarenga et al. 2009) |
The most effective strategy is to reuse resources for their original or different purpose, leading to cost reduction, increased benefits, and better recovery. At a global level, some companies have established procedures for recycling metals from spent batteries (Lv et al. 2018). The development of recycling prototypes with hydrometallurgy on an industrial scale is important.
MATERIALS AND METHODS
Materials
Laboratory materials were used, including beakers, pipettes, test tubes, fioles, baguettes and tweezers, as well as safety equipment for each of the processes.
In the development of the experimental stage, equipment such as a magnetic stirrer, vacuum pump, muffle furnace and analytical balance were used to obtain the final leach liquor.
For the recovery reactions, cathodes of lithium-ion batteries from cell phones, reagents such as sulphuric acid ( 95-97 %), sodium chloride (NaCl w/v 5 %) and distilled water were used.
Methods
Experimental methods
Sample preparation and pretreatment
Spent mobile phone batteries were collected for this research. Seven percent of the batteries were damaged or had reached the end of their useful life. Some of these batteries were bulky due to overload, while others had dents. These batteries had deteriorated appearances. Brand names were selected randomly. The batteries weighed a total of 6.86 kg.
To get the sample, the batteries were immersed and rested in a 5 % w/v solution of sodium chloride and water for 24 hours, this pretreatment process eliminated residual loads (Dang et al. 2022). Then, the batteries were manually dismantled using a guillotine, a vise, pliers, and a screwdriver.
The labels stuck to the battery casing were separated, and then two cuts of the deployable ends were carried out using the guillotine to extract the rubber and aluminum casing. Atia et al. (2019) refer that the composition of the battery includes plastic, rubber casing, aluminum casing, insulating material (plastic), copper sheet (anode) and aluminum sheet (cathode). Quantities obtained were weighed on an analytical balance (Table II).
TABLE II PERCENTAGE CHARACTERIZATION OF A RANDOM MOBILE BATTERY.
| Brand sticker | Case | Circuit boards | Protective rubber | Packaging stickers | Protection sheet | Isolating material | Anode | Cathode | ||||||||||
| 2.83 | 22.18 | 1.09 | 2.55 | 0.48 | 0.55 | 3.37 | 24.15 | 42.80 | Coating (Graphite) | Cu Foil | Coating (LiCoO2) | Al Foil | 52.81 | 47.19 | 63.34 | 36.66 | ||
The battery components were stored separately in a dry and ventilated place, delivered to an operator, and transferred to a WEEE recovery plant in accordance with national regulations.
Sample extraction
Lithium and cobalt are the metals of interest for sample extraction (Alvarenga et al. 2009). They are found in the thin layer of metal oxide LiCoO2 on the cathode covering the aluminum sheet.
To optimize the process, the aluminum sheets were placed in a muffle furnace at 390 ºC for 2 hours and 30 minutes and then cooled at air temperature. All cathodes were selected, and 17 cm long double-ended mixed spatulas were used to extract impurity-free samples from the aluminum sheet given its fragility. Finally, 1.11 kg of cathode sample was obtained and stored in a paper bag in a dry, ventilated, and hermetically closed place.
The content in percentage by weight of Co, Li, and Al in three samples of battery cathodes were analyzed in the accredited laboratory by the technique ICP-OES, and the results are shown in table III.
Battery cathode leaching experiments
The Statgraphics Centurion XVIII software was used for data analysis. The input factors considered were density, temperature, and time (Table IV). The output factor is the percentage recovery of lithium and cobalt obtained from the mass balance, with the percentage by weight of Li and Co quantified by the method ICP-OES of the leachate and the remaining solids with respect to the initial amount of the cathode powder. (Neumann et al. 2022).
TABLE IV VARIABLES AND PARAMETERS OF THE EXPERIMENTAL DESIGN.
| Variable code | Variables | Minimum value | Maximum value |
| A | Density (g/L) | 65.4a | 196b |
| B | Temperature (ºC) | 50 | 100 |
| C | Time (min) | 60 | 210 |
aTo obtain 65.4 g/L of density, 19.62 g of cathode, 16.93 mL of 1 M H2SO4, and 283.07 mL of distilled water have been used. To obtain 196 g/L of density, 58.8 g of cathode, 50.7 mL of 3 M H2SO4, and 249.3 mL of distilled water were used; bTo have a control test, a replica in the center was performed. To obtain 130.7 g/L of density, 39.21 g of cathode was used with 33.83 mL of 2 M H2SO4 and 266.17 mL of distilled water.
To determine the causality between the variables that affect the leaching process, a two-level factorial experimental design with repetition in the center was considered. This approach helps in the interpretation of the independent variables impact (Montgomery 2017). Additionally, the metal recovery equation of Li and Co was obtained.
The total number of experiments is nine, this includes eight trials according to the 2K experimental design plus one replicate in the center. The factorial design matrix is shown in table V.
TABLE V MATRIX OF THE FACTORIAL DESIGN EXECUTED AND TOTAL RECOVERY PERCENTAGES OF Li AND Co.
| Test code | Density (g/L) | Tº (ºC) | Time (min) | Li (%) | Co (%) |
| P1 | 64.50 | 50 | 60 | 68.65 | 29.33 |
| P2 | 196.00 | 50 | 60 | 43.81 | 26.45c |
| P3 | 64.50 | 100 | 60 | 76.16a | 31.17d |
| P4 | 196.00 | 100 | 60 | 44.49 | 30.45 |
| P5 | 64.50 | 50 | 210 | 43.06 | 27.07 |
| P6 | 196.00 | 50 | 210 | 43.02b | 28.59 |
| P7 | 64.50 | 100 | 210 | 46.12 | 29.55 |
| P8 | 196.00 | 100 | 210 | 44.49 | 31.07 |
| P9 | 130.25 | 75 | 135 | 57.81 | 28.53 |
aMaximum Li recovery; bminimal Li recovery; cminimal Co recovery; dmaximum Co recovery.
The leaching process was conducted in a thermal processes laboratory. First, purified water was acquired through the process of distillation to cleanse the glass materials and prepare the nine samples for leaching. Each sample was weighed in an analytical balance (±0.5 g margin of error), and prepared based on a two-level factorial design.
During the leaching process, an electromagnetic stirrer was used to control time, temperature, and magnetic agitation (fixed value of 700 rpm). The following procedure was performed for each test: 2 mL of H2SO4 with a purity level of 95-97% was measured with an automatic pipette. Then, 19.62 g and 58.80 g of battery cathode were weighed to achieve the required density of 65.4 g/L and 196 g/L, respectively.
The steps followed to execute the leaching are detailed below, taking experiment P1 as an example (Table V).
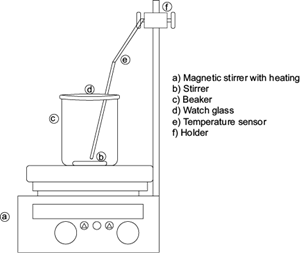
After turning on the magnetic stirrer, 283.07 mL of distilled water in a 500 mL beaker was heating to 25 ºC. Then, 16.93 mL of 1 M H2SO4 was added with an automatic pipette, and 19.62 g of battery cathode (LiCoO2) was gradually incorporated. A homogeneous solution was obtained using a stirring rod. Finally, the temperature was adjusted to 50 ºC, and the leaching process was perform using magnetic stirring at 700 rpm for 60 minutes following the design of experiment P1, as shown in figure 1. After that, the product was left to rest for 24 hours before moving on to the next step.
Collection of cathode leachates
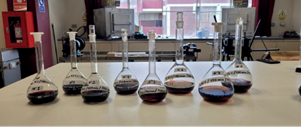
After 24 hours, a solution was obtained using filtration equipment and a vacuum pump. The pressure difference generated was used to retain the solids in the filter paper. The leachate solutions were stored in 500 mL volumetric flasks labeled as shown in figure 2.
The quantity of leach liquor and of remaining waste after the separation process are shown in table VI.
Analysis of cathode leachates
The leach liquors and the remaining residues resulting from the filtration were analyzed in an accredited laboratory, the methods applied to obtain the quantity of lithium and cobalt in each sample are:
Test method for cobalt in metals.
Lithium test method by ICP-OES for metals.
Test method for lithium by atomic absorption in acid solutions.
Test method for cobalt by atomic absorption in acid solutions.
Chemical equations involved in the process
There are diverse types of cathodes used for portable electronic devices. In this study, the cathode for cell phone batteries was used. The cathode material lithium cobalt oxide has the formula LiCoO2 (Tang et al. 2019).
The equations involved in the leaching process with 1 M H2 SO4 were:
However, with the acid 3 M H2 SO4, we obtained:
The determination of the recovery of Li and Co was carried out by mass balance. This process starts with the calculation of the input values, considering the mass of the cathode powder in milligrams (mg). This mass is then multiplied by the concentration of Li and Co determined by ICP-OES. This calculation allows the initial amount of each element, specifically lithium and cobalt, present in the cathode powder to be determined. The amount of leach obtained in milliliters (mL) in each test is then evaluated. This volume is multiplied by the concentration of each element in milligrams per liter (mg/L), also determined by ICP-OES. This product gives the recovered amount of each element in the leach liquor (Table VI).
The calculation of the recovery percentage (R %) is presented in equation 4 described below, where C(l) is the element concentration in the leach liquor, Vf is the volume of the final leach liquor, C(s) is the element concentration in the cathode powder and Mi is the cathode input mass. Table IX shows the input and output quantities of Li and Co.
RESULTS AND DISCUSSION
Despite being exposed to high temperatures in the muffle furnace, the moisture content of the cathode sample was 9.36%. The presence of water in the recovery stage increases the danger of the sample, as the water molecules react with the electrolyte components and generate hazardous gases.
Nine samples of acid-leaching liquor were obtained through the successfully development of the experimental leaching. The results of quantities of lithium and cobalt in the products after acid leaching are shown below:
Quantity of lithium and cobalt in 0.2 grams of cathode
According to the lab results, the quantities (w/w) in 0.2 grams of cathode are: 5.31% lithium and 32.78% cobalt.
Quantity of lithium and cobalt present in 5 mL of cathode leachate
According to the lab results, the quantities of lithium and cobalt present in the acid solution are shown in g/L in table VII.
TABLE VII Li AND Co PRESENT IN 5 mL OF SOLUTIONS.
| Liquid sample code | Description | Li (g/L) | Co (g/L) |
| P1-L | Acid solution | 2.38 | 6.29 |
| P2-L | Acid solution | 4.80 | 19.76 |
| P3-L | Acid solution | 2.74 | 6.91 |
| P4-L | Acid solution | 6.04 | 25.52 |
| P5-L | Acid solution | 3.56 | 13.82 |
| P6-L | Acid solution | 5.84 | 23.96 |
| P7-L | Acid solution | 3.64 | 14.40 |
| P8-L | Acid solution | 6.04 | 26.04 |
| P9-L | Acid solution | 4.08 | 12.43 |
Quantity of lithium and cobalt in 0.2 grams of remaining leachate solids
According to the lab results, the quantities of lithium and cobalt present in the remaining solids are shown in w/w in table VIII.
TABLE VIII QUANTITY OF Li AND Co IN 0.2 GRAMS OF REMAINING SOLIDS.
| Solid sample code | Description | Li (%) | Co (%) |
| P1-R | Remaining solids | 1.82 | 34.58 |
| P2-R | Remaining solids | 1.70 | 30.25 |
| P3-R | Remaining solids | 1.66 | 33.08 |
| P4-R | Remaining solids | 1.56 | 30.56 |
| P5-R | Remaining solids | 1.76 | 33.39 |
| P6-R | Remaining solids | 1.62 | 30.80 |
| P7-R | Remaining solids | 1.59 | 36.23 |
| P8-R | Remaining solids | 0.72 | 22.36 |
| P9-R | Remaining solids | 1.41 | 32.76 |
TABLE IX LITHIUM AND COBALT INPUT/OUTPUT MASS BALANCE.
| Test code | Solid sample income | Leachate liquor output | ||
| Li (g) | Co (g) | Li (g) | Co (g) | |
| P1 | 1.04 | 6.43 | 0.72 | 1.89 |
| P2 | 3.12 | 19.27 | 1.37 | 5.10 |
| P3 | 1.04 | 6.43 | 0.79 | 2.00 |
| P4 | 3.12 | 19.27 | 1.39 | 5.87 |
| P5 | 1.04 | 6.43 | 0.45 | 1.74 |
| P6 | 3.12 | 19.27 | 1.34 | 5.51 |
| P7 | 1.04 | 6.43 | 0.48 | 1.90 |
| P8 | 3.12 | 19.27 | 1.39 | 5.99 |
| P9 | 2.08 | 12.85 | 1.20 | 3.67 |
With this data, the mass balance was applied to calculate the recovery quantity of Li and total Co, the results are shown in table V.
Statistical analysis of influence of variables
The results of the data processing in the Statgraphics Centurion XVIII Software are detailed in table V.
Analysis of lithium recovery
Regression analysis, influence of variables and interactions
The estimated effects obtained are presented in table X. The results of the cathode leaching process have been adjusted to a regression equation, in this way, the impact of input factors on the variable is described according to the following relationship:
TABLE X SUMMARY OF RESULTS OF THE LITHIUM RECOVERY MODEL ANALYSIS.
| Regression coefficient for interacting variables | Estimated effect |
| Constant | 90.0051 |
| A: Density | -0.250206 |
| B: Temperature | 0.17991 |
| C: Time | -0.256847 |
| AB | -0.000640418 |
| AC | 0.00139009 |
| BC | -0.000243447 |
Analysis of variance of the recovery percentage (ANOVA)
The variance obtained have p-values less than 0.05 which mean significant with a confidence level of 95%. Density (A) and time (C) are significant for lithium recovery with p-values of 0.0462 and 0.0489, respectively (Table XI).
TABLE XI RELEVANCE OF VARIABLE FACTORS ACCORDING TO ANALYSIS OF VARIANCE.
| Effect | Sum of squares | F ratio | p-value |
| A: Density | 422.857 | 20.16 | 0.0462 |
| B: Temperature | 20.2442 | 0.97 | 0.4295 |
| C: Time | 398.011 | 18.97 | 0.0489 |
| AB | 8.86521 | 0.42 | 0.5823 |
| AC | 375.916 | 17.92 | 0.0515 |
| BC | 1.66686 | 0.08 | 0.8045 |
Analysis of the variable’s interaction
Variables interactions are shown in figure 3. According to the Pareto diagram (Fig. 3a, Table XII), density, time, and their interaction are the most important factors for lithium recovery. Therefore, it is possible to exclude the influence of temperature on density and time, by adjusting the interactions based on the graph in figure 3b. The adjusted equation of the lithium recovery model is:
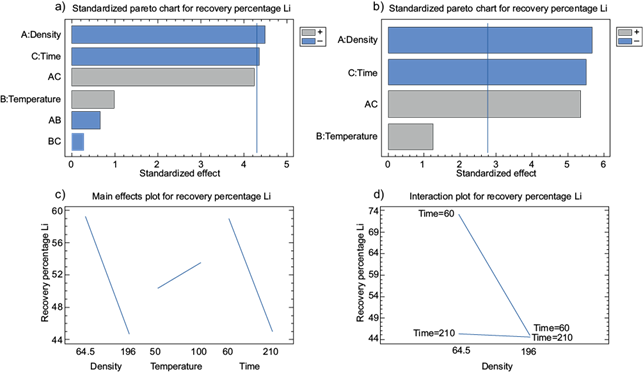
Fig. 3 Lithium recovery. a) Pareto diagram of variables influence, b) adjusted Pareto diagram of variables influence, c) influence graph of individual variables, d) influence graph of interactions of significant variables.
TABLE XII OPTIMIZATION OF VALUES FOR LITHIUM RECOVERY.
| Factor | Low | High | Optimum |
| Density | 64.5 | 196.0 | 64.5 |
| Temperature | 50.0 | 100.0 | 100.0 |
| Time | 60.0 | 210.0 | 60.0 |
The interaction of individual variables concerning lithium recovery is shown in figure 3c, where the percentage of Li recovery increases as density approaches the lower range (64.5 g/L). The recovery percentage of Li increases as the temperature approaches the higher range (100 ºC). The percentage of Li recovery increases as the time value approaches the lower range (60 min). On the other hand, the analysis of the interaction of significant variables (density and time) is shown in figure 3d. The percentage of recovery of lithium is greater in the shorter range of time (60 min) and lower density (64.5 g/L).
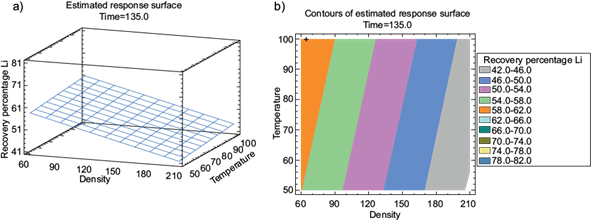
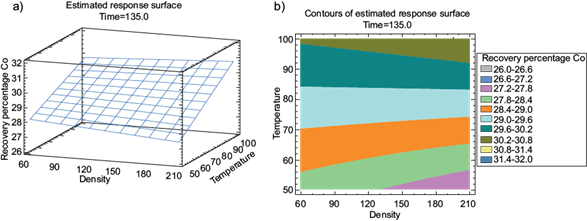
The surface graph shows the recovery response to the parameter’s variation during leaching. With 135 min the effect of density is noticeable in figure 4a, and it displays higher efficiency when it is around 60 g/L. Similarly, the contour plot in figure 4b, shows that with 135 min, a Li recovery efficiency of 62% was achieved (orange region), which increases as the temperature approaches 100 ºC and the density decreases to 60 g/L.
Optimization values
The optimal values for a lithium recovery of 76.16 % based on the levels of density (64.5 g/L), temperature (100 ºC), and time (60 min), are presented in table XII.
Temperature is a critical variable in the kinetics of the leaching reaction for lithium recovery. The optimum identified is 100 ºC. At this temperature, the thermal energy supplied increases the speed of the molecules as described by the Maxwell-Boltzmann distribution. This theory explains that as the temperature increases, the number of molecules with sufficient energy to overcome the activation barrier of the reaction also increases. The Arrhenius equation supports this phenomenon, where a higher temperature reduces the activation energy required, speeding up the reaction. This is observed in test 3, which operates at high temperatures and achieves a recovery of 76.16%. In contrast, a test with similar density and time variables, but at 50 ºC, shows a lower recovery of 68.65٪. However, raising the temperature above 100 ºC can cause the water to boil, resulting in a violent exothermic reaction. This causes not only sample loss but also evaporation of the leach liquor, making the process difficult to control and reducing leach efficiency.
The density of the solution also plays a crucial role in leaching efficiency. The optimum value found was 64.50 g/L. At this density, the mass/solution ratio is balanced, providing a suitable medium for the dispersion of the LiCoO2 molecules without saturating the solution. A suitable density ensures that the reactant molecules are sufficiently separated to allow effective interactions with the H2SO4, thus allowing a higher reaction rate. This is evident in test 3, which shows the highest lithium recovery. In contrast, test 4, using a density of 196.0 g/L, shows a lower recovery of 44.49 %. This reflects that a higher ratio of cathode powder to solution is less efficient as it oversaturates the solution.
The optimum reaction time was found to be 60 minutes. During this time the reaction between H2SO4 and LiCoO2 reaches its maximum efficiency. In the early stages of the reaction, the interaction between H2SO4 and LiCoO2 is rapid, generating an instantaneous rise in temperature due to the exothermic nature of the initial reaction. After 60 minutes it was observed that the amount of lithium leached stabilized, indicating that most of the available lithium had reacted. Extending the reaction time beyond this point does not significantly increase the amount of lithium recovered. This is reflected in test 3, which operates with a reaction time of 60 minutes and shows high recoveries. However, test 7, which operates at 210 minutes, shows a recovery of 46.12%. This is because as the time increases, the loss of liquor by evaporation is greater as the time in which the solutions react and are subjected to an increase in temperature is extended.
Analysis of cobalt recovery
Regression analysis and influence of variables and interactions
The estimated effects are shown in table XIII. The data result of cobalt recovered in the cathode mass leaching process have been adjusted to the following relationship:
TABLE XIII SUMMARY RESULTS OF THE COBALT RECOVERY MODEL ANALYSIS.
| Regression coefficient for interacting variables | Estimated effect |
| Constant | 29.4476 |
| A: Density | -0.0360937 |
| B: Temperature | 0.0404558 |
| C: Time | -0.0194257 |
| AB | 0.000164357 |
| AC | 0.000168251 |
| BC | -0.00005794 |
Analysis of variance of the recovery percentage (ANOVA)
It has been identified that temperature is the most significant variable for the recovery of cobalt, with a p-value of 0.0325 (Table XIV).
TABLE XIV RELEVANCE OF VARIABLE FACTORS ACCORDING TO ANALYSIS OF VARIANCE.
| Effect | Sum of squares | F ratio | p-value |
| A: Density | 0.0383507 | 0.08 | 0.8076 |
| B: Temperature | 14.6024 | 29.28 | 0.0325 |
| C: Time | 0.155097 | 0.31 | 0.6331 |
| AB | 0.583902 | 1.17 | 0.3923 |
| AC | 5.50705 | 11.04 | 0.0799 |
| BC | 0.0944169 | 0.19 | 0.7059 |
According to the analysis, temperature is the most influential variable in cobalt recovery because the higher the temperature, the more the complex structures formed by cobalt in solution, characteristic of transition elements break down. In addition, under normal conditions, cobalt is not stimulated by water or air, but is rapidly affected by inorganic acids. In this study used sulphuric acid, which has a significant effect on cobalt as the temperature rises due to the kinetic energy generated by the leaching process.
Analysis of the variable’s interaction
Variables interactions are shown in figure 5. According to the Pareto diagram (Fig. 5a, Table XIV), temperature is the most important variable factor in the recovery of cobalt. These results are similar to the study of (Sakultung et al. 2007), who concluded that the recovery percentage of cobalt depends strongly on the leaching temperature. The increase in temperature, lead the increase of the kinetic energy of the acid. According to the results in graph (a) (Fig. 5a), it is feasible to exclude the interaction between temperature and time, obtaining the adjustment of the interactions in the graph shown in figure 5b. The adjusted equation of the cobalt recovery model is represented with the following equation:
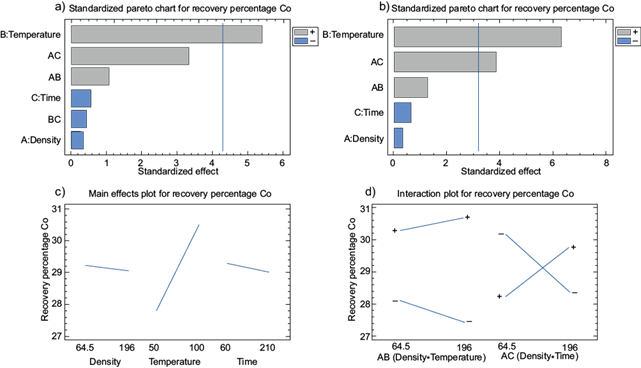
Fig. 5 Cobalt recovery. a) Pareto diagram of variables influence, b) adjusted Pareto diagram of variables influence, c) influence graph of individual variables, d) influence graph of interactions of significant variables.
Similar results are shown in figure 5c, where the percentage of Co recovery increases as density approaches the lower range (64.5 g/L). The recovery percentage of Co increases significantly as the temperature approaches the higher range (100 ºC). The percentage of Co recovery efficiency increases as the time decreases towards the lower range (60 min). Similarly, the Li recovery efficiency increases with the decrease in the density of Co (64.5 g/L).
On the other hand, it is important to mention the influence of pH in the leaching process; in acidic conditions (lower pH), the mobility and solubility of Li and Co metal ions increases, forming sulphates in solution.
The surface graph shows the variation of parameters during leaching. In figure 6a. With 135 min, the effect of temperature is pronounced and shows greater efficiency at 100 ºC. Similarly, the response contour (for a time of 135 min) shows a higher Co recovery efficiency (30.8 %) in the upper region in figure 6b. The efficiency increases as the temperature approaches 100 ºC and density increases to the higher range.
Optimization values
The optimal values for a cobalt recovery percentage of 31.17 % based on the levels of density (64.5 g/L), temperature (100 ºC), and time (60 min) are presented in table XV.
CONCLUSIONS
This study focused the importance of retrieving lithium and cobalt metals from used cell phone batteries by examining the performance of the most influential variables such as density, temperature, and time. The research involved conducting nine acid-leaching tests. During the development of the research and with data analysis, the following conclusions have been formulated:
In the pretreatment of batteries, the importance of the total battery discharge stage stands out; on the contrary, residual charges could cause explosions, generation of harmful gases, and the inadequate release of the organic components of the electrolyte into the environment.
In the characterization of a battery (Table II), the highest percentage of cathode weight is 42.80%. The concentration of valuable metals in the weight of the black mass (LiCoO2), which represents 63.34 % of the cathode total, contrasts the viability of the recovery of lithium and cobalt from cell phone batteries.
According to the experimental design, the highest percentage of lithium recovery was 76.16 %. This was achieved at a density of 64.50 g/L, a temperature of 100 ºC, and a time of 60 min (P3) after the leaching process. In the case of cobalt, a maximum percentage of 31.17% was obtained in the same leaching test. It seems that the parameters for the recovery of lithium and cobalt through acid leaching have different performances, so it is convenient to recover them in phases and separately.
Different performances are justified based on the following:
The recovery of lithium depends mainly on setting the appropriate values for the density and time. In P3, the values 64.50 g/L and 60 min were used, and it was concluded that density and time (the most influential variables) have an inverse relationship with efficiency. If these values decrease, the efficiency of lithium recovery increases.
Regarding the recovery of cobalt, the temperature during the leaching process is the most significant variable that affects its efficiency. In test P3, the temperature of 100 ºC was utilized, and it was concluded that there is a direct correlation between the temperature and the efficiency. This means that if the temperature value is increased, the percentage of cobalt recovery increases.
The optimal regression equations for the recovery of lithium and cobalt are equation 6 and equation 8.

