


 texto en
  Inglés (pdf)
 Artículo en XML
 Referencias del artículo
 Enviar artículo por email
 Citado por SciELO
  Similares en
SciELO
Similares en
SciELO 
 Permalink
INTRODUCTION
The factors influencing irregular migration from the Northern Triangle of Central America (Guatemala, Honduras, El Salvador) to the United States have been extensively studied. Primary incentives include poverty in the countries of origin, civil violence, improved job market conditions in the U.S., and the impact of climate change, while the main identified deterrent is a rigorous enforcement of the U.S. border controls (Buehn & Eichler, 2013; Dhanireddy, 2014; Nájera Aguire, 2016; Morris & Kloppe-Santamaría, 2022). Irregular migration, the movement of people outside the laws, regulations, or international agreements governing the entry into or out of the State of origin, transit, or destination (International Organization for Migration [IOM], 2011), is a clandestine phenomenon that needs exploration beyond its causes. However, a gap in identifying the factors determining the ability of migrants to enter and reside irregularly in the destination country remains.
Through an innovative methodology used to model the probabilities associated with their success and failure, this paper aims to fill this information gap by investigating the factors contributing to the success or failure of Northern Triangle migrants in irregularly reaching and staying in the U.S. Given the lack of information on their number, classified by success or failure in entering and residing in the U.S., this research built these data as a binomial logistical regression’s dependent variable. This model was applied to test four hypotheses about the success of Northern Triangle irregular migrants in entering and residing in the U.S., based on a dataset comprising 12 585 entries from apprehensions, both within the U.S. and at the border, between 2016 and 2019.
Specifically, it examines whether the success or failure of Northern Triangle irregular migrants depends on four categories of variables: individual characteristics, including sociodemographic ones; possession of social and network capital; recruitment of smugglers; and individual decisions. The first variable includes the migrant’s country of origin, age, education level, and English proficiency. The possession of social and network capital is tied to having previous migration experience, and recruiting a smuggler is related to the existence of a migration industry. As for individual decisions, they are specific choices to reach and reside in the intended destination, e.g., using a certain transportation modality and crossing a Mexican state at the Southwest border to reach the U.S.
The data used stems from the Encuesta sobre Migración en la Frontera Sur de México (EMIF SUR),3 a tool funded by the Mexican government and designed to understand the border dynamics of Mexico’s role as a transit point (Días Ferraro et al., 2020). EMIF SUR’s target population includes Northern Triangle migrants who were returned by U.S. immigration authorities and captures events related to those who transited from the southern border of Mexico and successfully crossed into the United States. The survey enhances the understanding of migratory labor flows between Guatemala and Mexico, as well as the undocumented migrant population using Mexican territory as a transit point and who were returned by Mexican and U.S. immigration authorities. This paper focuses on migrants from Guatemala, El Salvador, and Honduras, as they represent the major source of irregular migration crossing Mexico toward the U.S. (Economic Commission for Latin America and the Caribbean [ECLAC], 2018).
The paper is organized as follows: it first presents the theoretical approaches used to posit the four hypotheses to be tested and then describes the methodology for building the necessary data to model the probabilities for Northern Triangle irregular migrants to enter and reside in the U.S. It presents the results of the model and conducts a robustness check. Finally, the results are discussed through hypothesis testing.
THEORETICAL APPROACHES
The article aims to test four specific hypotheses based on sociological approaches to identify the factors determining the success or failure of irregular migrants from Central America’s Northern Triangle in their attempts to enter and establish residence in the U.S.
Social Theory of Life Chances
The first hypothesis, that the probability of success for irregular migrants to reach and reside in the U.S depends on their sociodemographic characteristics, is based on the sociological theory of life chances, which emphasizes that individual characteristics, such as race, gender, and age, represent ascribed statuses that influence their quality of life overall. Since they are aspects of personal identity beyond an individual’s control, they represent life chances and reflect basic aspects of social structure that condition the life choices people can make, ultimately influencing their quality of life (LaGory et al., 2001). In both sociology and psychology, the availability of resources is a key factor in achieving life goals, such as physical and psychological well-being (Liefbroer & Zoutewelle-Terovan, 2021). Demographic events that reduce people’s resources affect their future life chances and well-being, whereas events that increase their resources have a positive effect.
When it comes to irregular migration, the term “life chances” refers to the options available to migrant workers of better employment, moving up the urban social ladder, and settling down in cities (Zhan, 2011, p. 8). Migrants’ life chances can be drastically reduced whenever they face exclusion, when local social groups exclude outsiders, namely migrants, by establishing and maintaining boundaries between themselves and others (Silver, 2007). Weber (1958) identified two types of boundaries: legal (enforced by state regulations) and social (exclusion practiced informally by social groups), delineated against irregular migrants according to attributes such as race, language, religion, and geographical location. For instance, national citizenship is a characteristic subject to exclusion based on legal boundaries enforced by the State. In life chances studies, the neo-Weberian perspective underscores the importance of economic security, which involves accessing property and financial resources (Anikin et al., 2017).
Indeed, irregular migrants’ characteristics, including country of origin, age, sex, education, and language proficiency, may impact their economic security, i.e., their ability to, first, secure entering the intended destination country and, subsequently, establish a long-term residence by accessing employment, financial resources, and own property. Evidence shows that sociodemographic characteristics correlate with rates of deportation (Sohn et al., 2023) and that irregular migrants from Central America going to the U.S. are more likely to suffer violence than Mexican migrants (Leyva-Flores et al., 2019).
Bastard Institutions and the Migration Industry
The second hypothesis –the probability of success depends on the fees paid to smugglers– is based on the bastard institutions theory. The irregular migrants’ marginalized status compels them to navigate through channels out of the conventional legal frameworks to reach their desired destinations. In other words, the exclusion of migrants from many legal institutions in their receiving societies pushes them towards bastard institutions (Hughes, 1994), i.e., chronic deviations from established institutions, which provide alternative distribution channels for goods and services and are mainly created and fueled by ethnic networks.
The migration industry can be conceptualized as a bastard institution, as its actors and infrastructures provide alternatives to State-sanctioned mobility across international borders (Hernández-León & Sandoval, 2014). Often deemed illegal by States, this industry enjoys varying degrees of legitimacy and support from migrants and migration entrepreneurs. The concept of “foggy social structures” was developed to highlight these “social structures that emerge from efforts by individuals and organizations to avoid the production of knowledge about their activities by making them either unobservable or indeterminable” (Serra Mingot & Mazzucato, 2018, p. 7).
In this regard, the increase in migration controls along the Mexico-U.S. border over the last decade has forced people to use the services of smugglers, who have raised their prices accordingly (Massey et al., 2002). The migration industry plays a complementary role to the migrant networks by offering services that require specialized knowledge or a sophisticated and costly technical infrastructure. Organizing journeys and border crossings, producing fake documents, providing invitations, and corrupting public officials are the services sold and bought in the black market of the migration industry. In particular, migrants lacking official status rely on brokers to access services, jobs, legalization of their status, or the possibility to evade controls.
Moreover, because migrant networks are not infallible, under certain circumstances the migration industry not only complements but may also replace social networks. Due to conditions of poverty and social marginality experienced by migrants, such as ethnic and gender inequalities or abuses by network members (Hagan, 1998; Menjívar, 2000; Portes & Sensenbrenner, 1993), migrants’ social infrastructure does not always deliver its expected social capital. Emigrants, then, rely on traffickers, recruiters, moneylenders, travel agents, transporters, and other intermediaries to identify labor markets and migratory routes, as well as to negotiate a minimal economic and social incorporation into the host country. In terms of the formation of new migratory destinations, the relevance of recruitment lies in the knowledge possessed by contractors, not available to workers, of routes, arrival points, and labor markets. Additionally, strengthened border enforcement bolsters the use of smugglers and innovative techniques, such as decoys, while border fences may lead to digging tunnels (Carriquiry & Majmundar, 2013).
Social Networks
The third hypothesis, irregular migrants’ probability of success builds upon their previous migration experience, is based on an approach according to which migrant networks, the “sets of interpersonal ties that connect migrants, former migrants, and non-migrants in origin and destination areas through ties of kinship, friendship, and shared community origin” (Massey et al., 1993, p. 448), lower the costs and risks of movements, increasing the likelihood of a successful border crossing.
These networks constitute a form of social capital people can draw upon to gain access to foreign employment. Their expansion reduces costs and risks, generating additional movement, which furthers expansion. These networks, first of all, tend to reduce risks, which could explain the higher probability of success for individuals with previous migration experience in reaching and establishing a de facto residence in the destination country. Having gone through the migration process before, these individuals may have expanded and strengthened their social networks, gaining access to valuable job information and resources through personal connections.
Moreover, the theoretical approach suggests that social capital involves both monetary and non-monetary benefits. While friends and relatives within social networks exchange various forms of support, including smaller and bigger services, financial aid, emotional support, and companionship (Wellman & Wortley, 1990), others with prior U.S. experiences usually accompany initiates across the border, showcasing preferred staging areas, routes, and techniques of clandestine entry (Singer & Massey, 1998), directing them to spots where smugglers provide their services, and helping them to learn how to choose a trustworthy guide for their journey.
Additionally, they can provide instruction on adopting the appropriate conduct if apprehended. After gaining familiarity with the migrant network on the first couple of trips, it is also assumed that they tend to reduce the costs of the journey to the destination. Upon becoming acquainted with the migrant network during their initial journeys, migrants discover that the absence of legal documents no longer hinders further migration to the U.S. (Singer & Massey, 1998), and subsequent trips and accumulated experience reveal that migration indeed becomes a self-sustaining cycle.
The likelihood of undertaking another migration journey rises with each subsequent trip and with the accumulation of migrant experience over time. The availability of migration-specific human and social capital thus changes the social process of border crossing, yielding a conceptual distinction between first and later trips. On their initial crossings, migrants depend on guides to provide them with the experience and knowledge they lack.
However, on later trips, they can apply what they learned from their social capital to increase their odds of success, making them less dependent on guides, which is precisely where the reduction of costs occurs. Individuals are likely to rely on knowledge and skills acquired over time, instead of paying for the services of guides or smugglers to assist them in their journey. Rather than scaring the migrants into purchasing the services of smugglers, the experience of deportation convinces them that hiring a guide is not worthwhile to avoid apprehension (Singer & Massey, 1998), and even this provides the migrants with the experience needed to increase their probability of success to reach and reside in the U.S.
Migrant Decisions are not Purely Rational
The fourth hypothesis is that the probability of success of the irregular migrants depends on specific decisions made during their journey towards the U.S., i.e., choosing a transportation modality and opting to cross a determined Mexican state to enter and reside irregularly in the U.S. Unlike the neoclassical economic theory, which asserts that individuals seek to gather as much information as possible to make optimal decisions (Epstein, 2008), the decision-making process in the context of migration involves a nuanced interplay between information, awareness, and subjective factors (Czaika et al., 2021).
The search for migratory options is also influenced by imaginations, expectations, and perceptions of these places (Haberkorn, 1981; Thompson, 2017). This dual influence of objective and subjective factors highlights that information not only directly shapes search behavior but also, more indirectly, molds aspirations, expectations, and perceptions throughout the decision-making process (McKenzie et al., 2013). Indeed, migration decisions are not always driven by a purely rational choice model, and can also be the result of ad hoc decisions based on scarce information and minimal planning and preparation. All forms of migration decisions are often surrounded by very high and possibly irreducible uncertainty and are conceptualized as driven by several simple decision rules (heuristics) and other shortcuts such as imitation, affect, norms, and commitments (Czaika et al., 2021).
Certain migratory pathways are more common and become culturally embedded as destinations (Mescoli, 2013; Schultz, 2013), revealing how the U.S. is a dream destination for many aspiring migrants (Wilson, 2010). Indeed, migrants are willing to relocate to less favorable locations to acquire the necessary skills to reach their desired destinations. For example, the choice of the Mexican state through which the migrants from the Central America Northern Triangle decide to cross the U.S. Southwest border illustrates this nuanced decision-making process.
As will be mentioned later, the majority of these migrants opt to cross through Tamaulipas, a Mexican state associated with high risks and dangers for migrants (Días Ferraro et al., 2020). Additionally, it is noteworthy that some choose to cross the Río Bravo on the Mexican side using inflatable rafts, a particularly perilous method that significantly lowers their chances of reaching the U.S. The decision to use a more dangerous modality and traverse an unsafe route is not solely explained by rational calculations based on objective information, it is influenced by subjective factors, including personal experiences, social networks, and perhaps a lack of alternative options.
METHODOLOGY
It was necessary to develop a methodology to model the probabilities of success for Northern Triangle irregular migrants to enter and reside in the U.S. This consisted, first, of creating a dependent variable and employing relevant statistical models built from available information. Data science techniques were used by leveraging spatial analysis through tools like QGIS and R statistical software, generating a dataset of U.S.-Mexico border points, and conducting distance calculations to U.S. border counties, while identifying risk counties where the migrants are considered unsuccessful in their attempt to reach and reside in the U.S., based on a specific distance thresholds.
Build the Dependent Variable
Confronted with a notable gap in available data concerning the success or failure of Northern Triangle irregular migrants in their endeavors to enter and establish residence in the United States, this informational void was resolved by undertaking the construction of a dependent variable: the number of irregular migrants classified by success or failure. The success of irregular migrants in reaching and residing in the U.S. was deemed contingent upon two key conditions: space and time. In summary, those migrants who successfully crossed the border into the U.S. (reaching a distance of 124 miles from the U.S.-Mexico border) and remained in the U.S. for a specified duration (one year) were considered successful in their irregular migration endeavors. The creation of the dependent variable was first based on space, meaning, the location where these migrants were apprehended. Therefore, it was necessary to create a vector of U.S. counties of risk, that is, a list of counties at a certain distance from the U.S.-Mexico border, given the statutory power granted by U.S. federal regulations to the U.S. Customs and Border Protection authority to operate within 100 miles of any U.S. external boundary (American Civil Liberties Union of New Mexico [ACLU-NM], n.d.).
However, the threshold was set at 124 miles because the county centroid was used to calculate the distance from the U.S.-Mexico border. Centroids refer to the geographic coordinates (longitude and latitude) of the county seat of each of the U.S. border counties. This threshold avoids excluding those counties with a distance greater than 100 miles between their centroids and the border. For this exercise, as a first condition to determine success or failure, the migrants apprehended in these counties were considered unsuccessful in their attempt to reach and reside in the U.S. The creation of this vector of counties consisted of four steps: create the border points, calculate the distances between each border point and each county, obtain the distance between each county and its closest border point, and select the counties less than 124 miles away from the border.
Create the Border Points
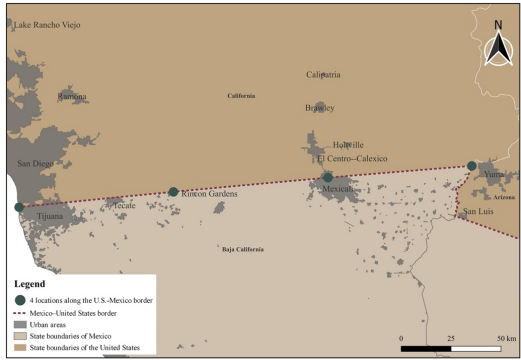
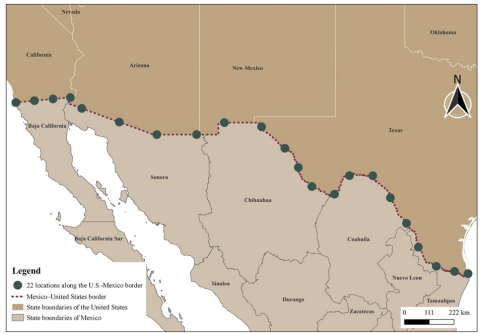
A dataset of coordinates for 20 U.S.-Mexico border points was generated through the geographic information system application QGis. The border line between Mexico and the United States was set with Natural Earth, and, for this process, the Boundary Lines resource was used at a scale of 1:10m.4 Given the length of Mexico’s border with the United States, which spans over 3 152 kilometers, points were plotted at intervals of 167.6 km to ensure equal distance between them. To add these points along the border, a function in the statistical software R was designed to create 2 midpoints, e.g., between the first and second points and between the second and third points. Therefore, the function returns 2n – 1 point. For example, in the state of California, with two border points, the function returns 2x2 – 1 = 3 border points. Then, one point in the city of Yuma was added, resulting in four U.S.-Mexico border points, as shown in Map 1. The same procedure was carried out for each of the other U.S. border states (Arizona, New Mexico, and Texas), resulting in 22 U.S.-Mexico border points, as shown in Map 2.
Calculate the Distance Between the Border Points and the Counties Centroids of Each U.S. Border State
The next step was to calculate the distance between the border points and the counties’ centroids of each U.S. border state. The 360 centroids displayed on Map 3 were obtained from the geoCounty dataset, a table of geographical coordinates from the housingDataR package.
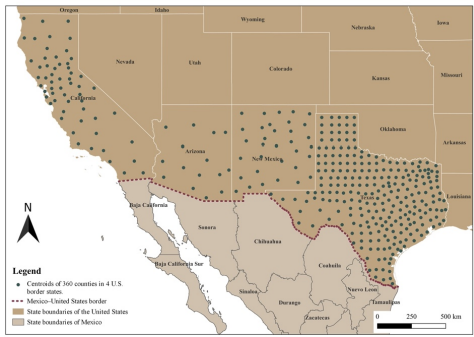
Source: Own elaboration with the geoCounty R dataset.
Map 3. U.S. Counties of the Four U.S. States Bordering Mexico: California, Arizona, New Mexico, and Texas
Then, k distances were calculated, which are equal to i counties x j border points. It’s noticeable that California has 58 counties, Arizona 15 counties, New Mexico 33 counties, and Texas 254 counties, resulting in a total of 360. Since there were 360 counties and 20 border points, 7 920 distances needed to be calculated. After computing the distances for the initial county, a function iteratively applied the procedure until reaching the final county, encompassing a total of 360 counties.
Obtain the Distance Between Each County and its Closest Border Point
Then, each U.S. county was assigned a distance from the U.S.-Mexico border. The aim was to obtain a distance per county, i.e., 360 distances. The R package sf, which provides simple features access for R, was used, while the minimum distance was chosen as the metric to mitigate the sensitivity issue associated with extreme values. Consequently, each U.S. border county was assigned the distance to its nearest border point.
Obtain the Risk Counties
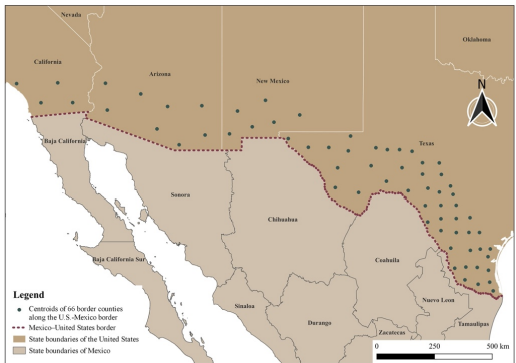
To obtain the risk counties, another function was designed to select those counties whose distance from the U.S.-Mexico border is less than 161 miles. Not only was it necessary to obtain their names and the states they belong to, but also their coordinates. The procedure resulted in 66 risk counties, as Map 4 shows.
Create Additional Points
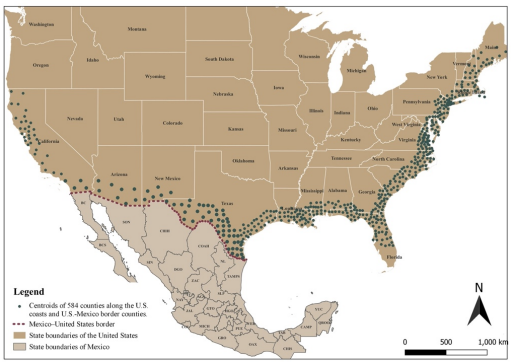
Given the USBP’s faculties, the marine patrols conduct rounds along the coastal waterways of the United States, primarily along the Pacific coast, the Caribbean, the tip of Florida, and Puerto Rico, as well as interior waterways common to the United States and Canada (U.S. Customs and Border Protection [U.S. CBP], 2008). The agency police activities from 130 marine craft of various sizes, and since the U.S. Border Patrol has the mandate to monitor the U.S. coast, and irregular migrants are also apprehended in this zone, it was necessary to create points in the near-border areas of the Pacific, Gulf of Mexico, and the East Coast to measure their distance to the centroids of each U.S. border county.
As defined before when referring to the U.S.-Mexico border, a successful attempt to enter the United States occurs when a migrant is apprehended more than 124 miles from the coast. The four steps mentioned above were followed to obtain the counties less than 161 miles away from the coast. Table 1 presents a summary of the inputs needed to create the U.S. risk counties; the 43 duplicates found in the risk counties dataset were removed from the 627 risk counties, resulting in 584, shown in Map 5.
Table 1. Summary of the Inputs
| Region | Number of border points |
Number of counties |
Number of distances |
Number of minimum distances |
Number of risk counties |
|---|---|---|---|---|---|
| U.S.-Mexico border | 22 | 360 | 7 920 | 360 | 66 |
| Pacific coast | 9 | 58 | 522 | 58 | 42 |
| East Coast | 55 | 1 228 | 67 540 | 1 228 | 519 |
| Total | 86 | 1 646 | 75 982 | 1 646 | 627 |
Source: Own elaboration with the geoCounty R dataset.
The risk counties plotted above were assigned a codification based on the EMIF SUR to locate them in this database, resulting in a new dataset representing the risk counties, where the migrants were apprehended, and the non-risk counties, where the migrants were not. This was possible via a 3-step function: obtain all the counties from the U.S. states of interest (border and Coast); detect the position each risk county occupies in the EMIF SUR database; and obtain the specific EMIF SUR codes of the risk counties.
This allowed the development of a binary variable, where 0 was assigned when the counties of the survey database were found in the dataset of risk counties and 1 to those not found in the dataset of risk counties. The result is the first condition of the outlined dependent variable: those U.S. counties located less than 161 miles away from the border were considered risk counties, i.e., where migrants located there are considered unsuccessful in their attempt to reach and reside in the U.S.
Add Time to Build the Dependent Variable: Length of Stay of the Irregular Migrants
A second condition was added to the spatial described above to build the dependent variable: time. Only those irregular migrants who arrived in the U.S. and stayed for a set period of time before being apprehended by the U.S. authorities5 were considered successful. As per the Recommendations on statistics of international migration (United Nations, 1998), migrants are classified into two categories: short-term migrants, i.e., individuals who relocate to a country other than their habitual residence for a duration exceeding three months but less than a year, and long-term migrants, i.e., those persons who move to a country for a period of at least a year so that the country of destination effectively becomes their usual residence.
Based on these international definitions, two thresholds were chosen (6 and 12 months) to compare the results of the model and select the most robust. Finally, the creation of the proposed dependent variable was submitted to 2 conditions: assign 0 (failure) to those migrants apprehended in a U.S. county located less than 161 miles away from the border or coast but who also stayed in the U.S. for less than 12 months before being apprehended, and assign 1 (success) when it was the contrary.
The Independent Variables
The variables directly involved with the hypotheses were selected from the results of the EMIF SUR. They are presented in Table 2, which also includes the type of variable, the names and percentages for the levels in the case of categorical variables, as well as the minimum, median, mean, and maximum for numerical variables. In total, there were 12 587 records.
Table 2. Description of the Variables
| Variable | Type of variable |
Levels of category |
|---|---|---|
| Country of origin of the migrant | Categorical | 1: Guatemala (32%); 2: El Salvador (49%); 3: Honduras (19%) |
| Year of survey | Categorical | 1: 2016 (31%); 2: 2017 (27%); 3: 2018 (22%); 4: 2019 (19%) |
| Amount paid by the migrant to cross Mexico (USD) |
Categorical | 0: None (34%); 1: [1 500] (46%); 2: [5 001, 10 000] (18%); 3: [10 001, 15 000] (2%) |
| Amount paid by the migrant to reach the U.S. (USD) |
Categorical | 0: None (30%); 1: [1 500] (52%); 2: [5 001, 10 000] (16%); 3: [10 001, 15 000] (2%) |
| Place of payment | Categorical | 0: Did not pay (24%); 1: Place of origin (16%); 2: Mexico (15%); 3: U.S. (9%); 4: Place of origin and Mexico (2%); 5: Place of origin and the U.S. (30%); 6: Mexico and the U.S. (4%) |
| State of Mexico through which the migrant crossed to reach the U.S. |
Categorical | 1: Baja California (5%); 2: Coahuila (6%); 3: Chihuahua (4%); 4: Nuevo León (()1%); 5: Sonora (12%); 6: Tamaulipas (73%) |
| Type of means to cross from Mexico to the U.S. |
Categorical | 0: Walking or swimming (48%); 1: Raft or boar (32%); 2: Land (20%) |
| Use of a smuggler to cross from Mexico to the US |
Categorical | 0: Did not recruit (34%); 1: Yes (29%); 2: It was another person (29%); 3: Did not use a guide to cross Mexico (8%) |
| Sex of the migrant | Categorical | 1: Male (85%); 2: Female (15%) |
| The migrant speaks English | Categorical | 1: Yes (17%); 2: No (83%) |
| Marital status of the migrant | Categorical | 1: Free union (21%); 2: Single (61%); 3: Married (18%) |
| Head of household | Categorical | 1: Yes (47%); 2: No (53%) |
| Education level of the migrant | Categorical | 0: None (4%); 1: Basic (33%); 2: Upper middle education (30%); 3: Bachelor’s degree (30%); 4: Postgraduate degree (3%) |
| Health condition of the migrant | Categorical | 1: Good (89%); 2: Bad (11%) |
| Minors accompanying the migrant | Categorical | 0: Was accompanied with no minor (31%); 1: Was accompanied by minors (6%); 2: Was alone (63%) |
| Children accompanying the migrant | Categorical | 0: Was alone (63%); 1: Was with his/her children (1%); 2: Was accompanied by minors who were not his/her children (31%); 3: Was accompanied by adults (5%) |
| Returned by the U.S. to Mexico | Categorical | 0: Never crossed (0.2%); 1: Was apprehended (83%); 2: Was not apprehended (17%) |
| Bad weather conditions while crossing Mexico |
Categorical | 1: Yes (14%); 2: No (86%) |
| Lack of food or water while crossing Mexico |
Categorical | 1: Yes (12%); 2: No (88%) |
| Bad weather conditions while crossing the Mexico-US border |
Categorical | 1: Yes (13%); 2: No (87%) |
| Lack of food or water while crossing the Mexico-US border |
Categorical | 1: Yes (11%); 2: No (89%) |
| Amount paid from origin country of the migrant to the U.S. (USD) |
Continuous | Minimum = 0; Median = 3 500; Mean = 3 858; Maximum = 25 000 |
| Time spent in Mexico before crossing the border (weeks) |
Continuous | Minimum = 0.006; Median = 0.43; Mean = 2.04; Maximum = 13 |
| Number of times the migrant was apprehended in Mexico |
Continuous | Minimum = 0; Median = 0; Mean = 0.07; Maximum = 17 |
| Age (in years) | Continuous | Minimum = 16; Median = 26; Mean = 28.18; Maximum = 92 |
Source: Own elaboration with data from the EMIF SUR (El Colegio de la Frontera Norte [EL COLEF] et al., 2016, 2017, 2018, 2019).
*Some percentages do not add up to 100% due to rounding.
The Model: Logistic Regression
As the research objective is to predict a categorical variable, i.e., the success or failure of irregular migrants to enter and reside in the U.S., a binomial logistic regression was used to model their probabilities of success. The purpose of logistic modeling is to asses or predict a measure of event occurrence by estimating a linear regression model indirectly. Let Y be the variable of interest denoting the occurrence of an event; that is, Y = 0 if the event of interest does not occur (failure), and Y = 1 if the event of interest occurs (success). Then, one is interested in estimating the probability that the event occurs (p, probability of success) through knowledge of other characteristics called covariates: x1.,..., xp Therefore, using statistical notation one can write:
The general linear model approach, the link function g(p) and the linear regression model x β are related as follows:
where p is the parameter of interest, β is the vector of regression coefficients of the linear model and x is the i-th row of the covariate matrix x1.,..., xp. Therefore, if one has an estimate of β, an estimation can be obtained of the parameter p using the inverse function of the link function g(p) given as follows: let β̄ be an estimate of the vector β, then an estimate of p is obtained from the following expression:
Thus, given the fitted linear regression model, estimates of the probabilities of the occurrence of Y are obtained for each record included in the sample.
RESULTS
The Model
The datasets were merged over the period 2016-2019, resulting in 12 587 rows. Multicollinearity was avoided by using the variance inflation factor test, and a stepwise regression was carried out to select the statistically significant independent variables. Based on the international definitions of short-term and long-term migrants mentioned in the methodology section, four logistic models were run based on two criteria: time (setting 6 or 12 months of staying for the irregular migrants in the U.S. to consider it a success) and the inclusion of factors from the categorical variables in the model. As shown in Table 3, the model with factors and with a 12-month threshold has the highest area under the curve, 79.08%, and was thus selected, meaning that migrants were considered successful in their migration attempt only if they lived in the U.S. for more than 12 months and were located more than 161 miles away from the border or coast when apprehended by U.S. authorities.
Table 3. Comparison of the Areas Under the Curve of the Four Logistic Regression Models
| 6-month threshold (%) |
12-month threshold (%) |
|
|---|---|---|
| Without factors | 74.82 | 74.7 |
| With factors | 78.4 | 79.08 |
Source: Own elaboration with data from the EMIF SUR (EL COLEF et al., 2016, 2017, 2018, 2019).
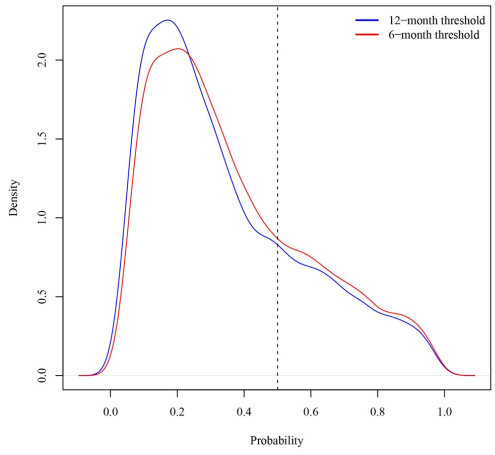
As displayed in Graph 1, the density for probabilities with a 12-month threshold is more conservative than the one of those with a 6-month threshold, meaning that, the longer stay, the chances for irregular migrants being apprehended by authorities increase, affecting their ability to remain in such status.
Source: Own elaboration with data from the EMIF SUR (EL COLEF et al., 2016, 2017, 2018, 2019).
Graph 1. Density Plots of the Probabilities from the Logistic Models with a 6-Month and 12-Month Thresholds
In this regard, Table 4 shows that the probabilities of the 12-month model are all lower than those of the 6-month model. This pattern indicates the increased difficulty for migrants to sustain irregular stays in the U.S. for a duration of 12 months compared to 6 months.
Table 4. Summary Statistics of the Probabilities from the Logistic Models with a 6-Month and 12-Month Thresholds
| First quartile |
Median | Mean | Third quartile |
|
|---|---|---|---|---|
| Probabilities with a 6- month threshold |
0.178 | 0.305 | 0.363 | 0.514 |
| Probabilities with a 12- month threshold |
0.160 | 0.277 | 0.343 | 0.489 |
Source: Own elaboration with data from the EMIF SUR (EL COLEF et al., 2016, 2017, 2018, 2019).
From the table above, based on the 12-month threshold model, it is noteworthy that half of the irregular migrants surveyed have a probability of effectively reaching and residing in the U.S. equal to or less than 28%. On the other hand, 75% of the surveyed irregular migrants have a probability of effectively residing in the U.S. equal to or less than 49%.
The Goodness of Fit
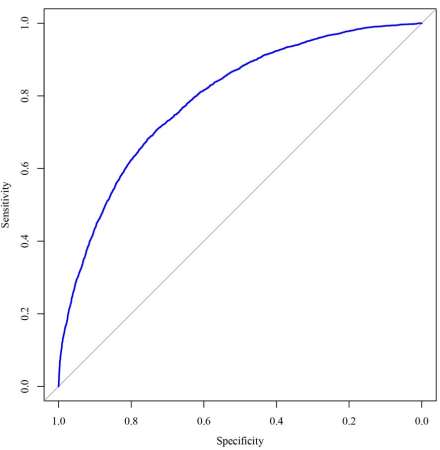
A goodness-of-fit test was used to compare model predictions and choose a robust statistical model. This test, the Anderson-Darling two-sample test, ensures that the selected model significantly differs from others with lower accuracy, and was used to reject the null hypothesis that both samples of predictions come from the same distribution. The Receiver Operating Characteristic (ROC) curve serves as a widely employed evaluation tool in binary classification algorithms, and it visually represents the classifier’s proficiency in identifying instances that align with the observations.
This curve is constructed in two steps. First, the true positive rate (the sensitivity, or values that the model correctly classifies as positive) and the false positive rate (records that the model classifies as positive but are actually negative) are calculated using a sequence of values ranging from 0 to 1. Then, the ROC curve is constructed using the vector of true positive rate and specificity values, with the latest on the x-axis and the true positive rate on the y-axis. The interpretation of the true positive rate refers to the probability that a genuinely positive case is correctly identified by the model, while the false positive rate measures how often the model classifies a case as positive when it is not.
Here, the classifier is a logistic regression model, which, according to Graph 2, has an acceptable performance, as the curve it generates is above the diagonal reference line for the four thresholds used to calculate the rate of true positives and false positives. The diagonal line indicates that the classifier lacks optimal performance, as it is guessing the status of the cases (negative and positive). Therefore, a curve above this line, such as the one obtained from the evaluation of the model performance, provides satisfactory predictive power. The area under the curve (AUC), showing how well the logistics regression model predicts, was calculated from the ROC curve, concluding that, the higher the value (close to 1), the better the performance of the classifier. Here, the UAC value is 0.7907, confirming what was displayed by the ROC curve: the logistic regression model has a predictive power of 79.07%, making it an adequate tool for estimating and predicting the probability of success in classifying cases according to the set variables.
Source: Own elaboration with data from the EMIF SUR (EL COLEF et al., 2016, 2017, 2018, 2019).
Graph 2. Area Under the Curve of the Model
Analysis of the Results
This section tests four hypotheses about the success of Northern Triangle irregular migrants in entering and residing in the U.S., based on apprehensions data from 2016 to 2019. The premise is that their probability of success depends on four key aspects: individual characteristics, including, sociodemographic ones, the possession of social and network capital, the recruitment of smugglers, and individual decisions. These hypotheses posit that the success probability of Northern Triangle irregular migrants is contingent upon key characteristics of the irregular migrants and the circumstances of their journey. These journey-related factors are not fully under the control of the migrants, who are rarely in a position to know in advance how likely they are to fall victim to the dangers along the migration journey (Belloni, 2022).
THE HYPOTHESIS TESTING
Hypothesis 1: The Probability of Success Depends on Individual Characteristics of the Irregular Migrants
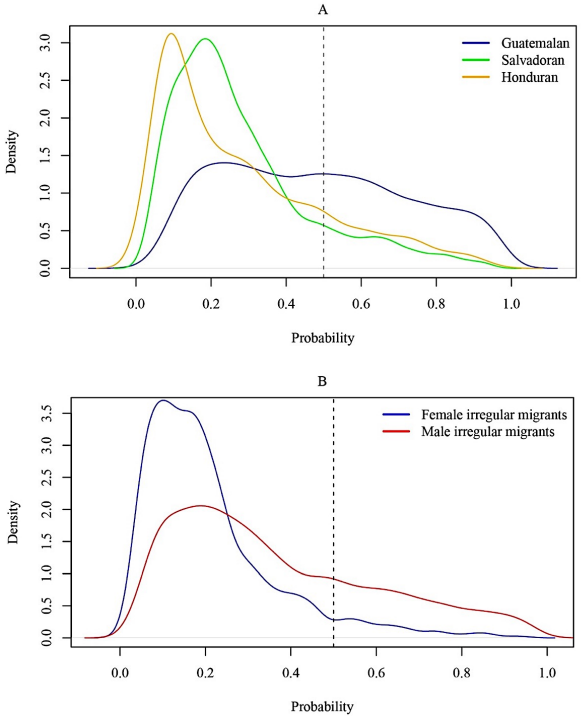
Irregular migrants from the Northern Triangle seeking entry and residence in the U.S. encounter unique challenges and opportunities shaped by individual characteristics. Factors such as country of origin, gender, age, education, and English proficiency, are hypothesized to impact their success or failure in reaching their destination. This hypothesis aligns with the sociological theory of life chances, which emphasizes how sociodemographic traits influence individuals’ ability to achieve their goals (Zhan, 2011; Liefbroer & Zoutewelle-Terovan, 2021; Leyva-Flores et al., 2019). Nationality, for instance, was found to be a key factor determining the probability of success for these migrants: as shown in Graph 3, the chances for Guatemalans (47%) are higher than those of Salvadoran (23%) and Honduran origin (21%).
Source: Own elaboration with data from the EMIF SUR (EL COLEF et al., 2016, 2017, 2018, 2019).
Graph 3. Density Plots of the Estimated Probabilities of Success per Nationality and per Sex
The higher probability of success for Guatemalans can be explained by the deep historical migration ties between Mexico and their country, which has developed a highly dynamic cross-border labor market due to their geographic proximity (Martínez de la Peña & Bermúdez Lobera, 2018) but may also have generated deeper smuggling of migrant networks in comparison with the Hondurans and Salvadorans. Guatemala’s western border with Mexico is a major access point for migrant smuggling and has long served as the main exit point for Northern Triangle migrants heading to the United States (Papadovassilakis, 2022). In addition, Guatemalan migrants use most frequently a smuggler to cross Mexico and reach the United States (87% of them in 2019), followed by those from El Salvador (80% of them in 2019) and Honduras (31% of them in 2019) (Días Ferraro et al., 2020), which increases their probability of success, as it will be seen later on.
In the proposed model, as noticeable in Graph 3, sex is also a statistically significant variable that determines the probability of success of an irregular migrant, as it also shows Graph 3. Considering the specific situations of vulnerability linked to gender and the fact that women are more likely to be exposed to more risks than men, it is not a surprise that, on average, between 2016 and 2020 the estimated probability of success for female irregular migrants is significantly lower (21%) than for male (37%). The difficult conditions in which women from the Northern Triangle face the journey, with no support, no papers, and no clear knowledge of what they will find, expose them to higher levels of violence than those faced by their male counterparts (Anguita Olmedo & Sampó, 2021).
Women are more vulnerable during the journey, especially because most travelers and smugglers are men. When women go through the migration process, they face an increased risk of violence, notably sexual violence, with the most extreme manifestation being human trafficking orchestrated by criminal organizations. According to Kuhner (2011), instances of sexual violence encompass a range of actions, including rape, unwelcome sexual advances, or harassment, which may involve demands for sexual favors in exchange for benefits, as well as coerced prostitution and human trafficking for sexual exploitation. On the way to the U.S., recruiters falsely pose as migrant guides, often preying on women lacking economic resources (Izcara-Palacios, 2023); these recruiters build trust by offering job opportunities or free passage to the United States but ultimately deceive and exploit the victims. Women, lacking social capital and economic means, are more vulnerable, leading to their captivity and exploitation, often ending in forced prostitution when their families refuse to pay for their release.
English proficiency, as seen on Graph 4A, was also identified as a factor that increases the probability of success for irregular migrants, since it may certainly be very useful to communicate with U.S.-based smugglers to reach destination points in the U.S. and to develop social networks, including work-based linkages that offer wider sources of advice for finding a job and both a temporary and permanent place to live. In this regard, improvements in English proficiency and educational attainment noted since 2007 are mainly attributed to the changing profile of unauthorized immigrants who arrived in the U.S. within the previous five years (Passel & D’Vera, 2019), among which 32% were proficient in English in 2016, compared with 18% in 2007.
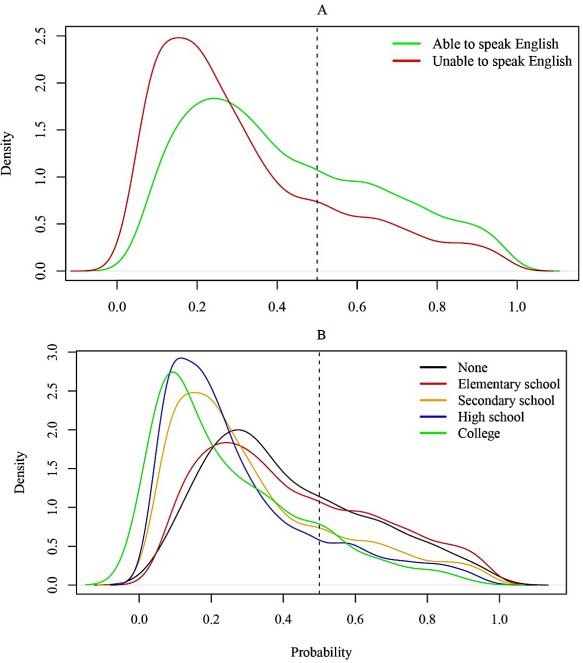
Source: Own elaboration with data from the EMIF SUR (EL COLEF et al., 2016, 2017, 2018, 2019).
Graph 4. Density Plots of the Estimated Probabilities of Success per Ability in English and per Education Level
Similarly, as presented on Graph 4B, the estimated probability of success is higher for uneducated unauthorized migrants (41.25%) than for educated ones (34.0%). Indeed, migrants with higher levels of education and language proficiency are prone to look for regular ways to migrate, such as getting a tourist visa and then overstaying. On the contrary, migrants with lower levels of education are more likely to opt for irregular services to cross the border to the U.S. A reason explaining this is that the probability of obtaining an immigration visa is higher for more skilled workers.
Education and a job offer are typically required conditions for obtaining a visa, but these resources are not accessible to uneducated migrants (Beine et al., 2021), which reminds the role of bastard institutions, as previously evoked. In this regard, it is worth mentioning that irregularity is not entirely of the migrant’s making: it may correlate with red tape or labor market dynamics where some employers are inclined to consider the advantages of hiring irregular migrants due to the cost savings they may offer (IOM, 2019).
As shown in the graph above, the chances of success are higher for migrants who attended elementary school than for those with higher education levels, i.e., secondary school, high school, and college. It is worth noting that, according to previous research (Días Ferraro et al., 2020), the majority of the Northern Triangle irregular migrants have a low level of education, as 71% of the persons in the target flow lack a high school diploma or higher.
Age is also statistically significant, and a function was run to compute the probabilities of success by varying the ages based on the standard profile migrant, with the ages of all the individuals set between 16 and 92. As Graph 5 shows, the probability of success increases in function of age but does not exceed 50%, meaning that age alone does not provide a comprehensive explanation for success in irregular migration. According to the data analyzed, 74% of migrants fall within the 18 to 29 age group, highlighting the pivotal role of youth in shaping the outcomes of irregular migration. This underscores the importance of considering age-related factors when examining the complexities of the migration process.
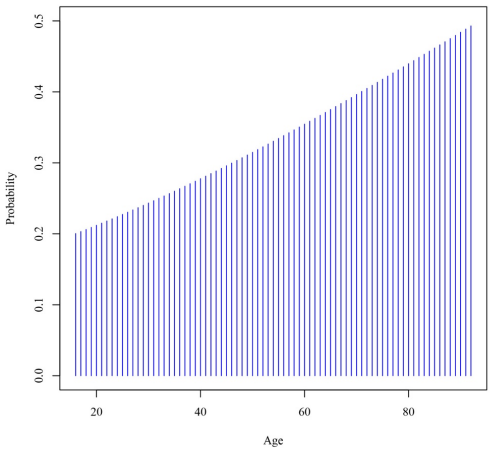
Source: Own elaboration with data from the EMIF SUR (EL COLEF et al., 2016, 2017, 2018, 2019).
Graph 5. Density Plots of the Estimated Probabilities of Success per Age
Hypothesis 2: The Probability of Success Depends on the Fees Paid to Smugglers
The second hypothesis, which asserts that the probability of success for Northern Triangle irregular migrants depends on the fees paid to smugglers, is grounded in the recognition that smugglers specialized knowledge complements the migrant’s social networks to reach their destination. (Massey et al., 2002). To determine if the probability of success depends on paying fees to smugglers, two variables were analyzed: the fees paid to smugglers to cross the Mexican territory to reach the U.S. Southwest border from the Northern Triangle and the total amount paid from the beginning to the end of the journey. The prices were adjusted per year. Regarding the first variable, the fees to cross Mexico were converted into a categorical variable of 4 levels.6
As Table 5 shows below, the highest probability of success is reached when the irregular migrants pay the highest range of amount. Many migrants hire smugglers for assistance or pay others for rights of way at some point during the journey. Irregular migrants from the Northern Triangle who hire smugglers pay them thousands of U.S. dollars (USD) to make that journey and evade capture or being smuggled between ports of entry (Greenfield et al., 2019). According to the data, from 2016 to 2019, Northern Triangle irregular migrants paid smugglers an average of 4 848.51 USD to cross Mexican territory and reach the U.S Southwest border.7 Evidence suggests that “the militarization of the border transformed coyote usage from a common practice that was followed by most migrants into a universal practice adopted by all migrants” (Massey et al., 2016, p. 1576).
Table 5. Probability of Success per Fees Paid to Smugglers to Cross Mexico Towards the U.S. Southwest Border
| Amount (USD) | Average probability in percentage term |
|---|---|
| None | 34.97 |
| 1 - 5 000 | 32.61 |
| 5 001 - 10 000 | 36.79 |
| 10 001 - 15 000 | 40 |
Source: Own elaboration with data from the EMIF SUR (EL COLEF et al., 2016, 2017, 2018, 2019).
The marginal effect of paying this service corresponding to the individual with the best profile, i.e., with the highest probability of success, is 0.004. While this effect is small, it nonetheless suggests that paying very high fees to smugglers to cross Mexican territory has some influence on the likelihood of residing in the U.S. Following the election of Donald Trump as U.S. President on 2016, the price paid by Central American irregular migrants to smugglers cross the U.S.-Mexico border in 2017 was the lowest of our study period (1 804 USD), with the number of irregular migrants apprehended at the U.S.-Mexico border falling to the lowest amount recorded since 1971 (Robertson, 2018).
Indeed, the rhetoric of the Trump administration dramatically reduced flows of unauthorized immigrants due to their fear of being caught and returned (Hoekstra & Orozco-Aleman, 2021). However, after the first year of his administration, the “Trump effect” dissipated, and the rise in apprehensions of Central American migrants in the subsequent years led to an increase in prices, reaching their highest point in 2018 (3 376 USD). This price hike was also exacerbated by the fact that, according to the data, that year all the migrants did recruit a smuggler to better face the law enforcement measures at the US-Mexico border.
Concerning the second price variable analyzed—the total amount paid since the beginning of the journey—a function was run to compute the probabilities of success by varying the amounts that would have been paid by the standard profile-migrant (between 0 and 30 000 USD, with a 1 000 USD interval). As shown in Graph 6, there is a positive relation between the total amount paid and the probability of success. The use of migrant smuggling services by irregular migrants is fundamentally driven by the overarching objective of enhancing the probability of successfully reaching their intended destination; according to the United Nations Office on Drugs and Crime (UNODC, 2020), between 2016 and 2018 it was estimated that 57% of the Northern Triangle migrants recruited a smuggler to cross Mexico and that 71% recruited a smuggler to cross the U.S. border. This underscores the pivotal role of recruiting a smuggler in the migrants’ strategic approach, signifying a deliberate and instrumental choice to optimize the efficiency of their journey and elevate the likelihood of a successful outcome.
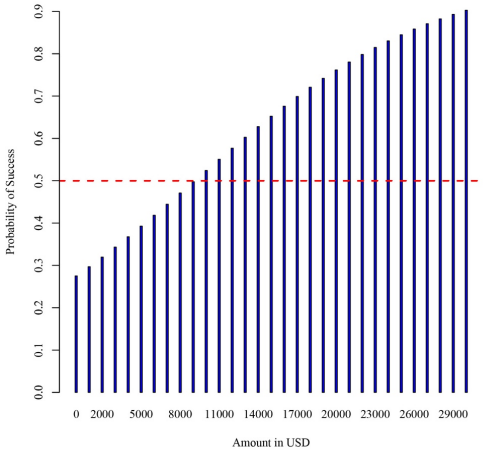
Source: Own elaboration with data from the EMIF SUR (EL COLEF et al., 2016, 2017, 2018, 2019).
Graph 6. Trend of the Probability of Success with Different Amounts, Based on the Standard Profile of an Irregular Migrant
Hypothesis 3: The Probability of Success of Irregular Migrants Depends on Their Previous Migration Experience
In relation to how prior exposure to migration may provide a unique set of skills, insights, and coping mechanisms that can significantly influence the migrant’s ability to succeed in subsequent migration attempts, it was tested whether the probability of success of irregular migrants depends on their previous migration experience, i.e., if they had already been returned by U.S. migration authorities to their countries of origin. Statistical evidence shows that irregular migrants with previous migration experience have a higher probability of success (35.37%) when compared to those without such experience (29.21%). Once migration has been undergone, it becomes a familiar and reliable socioeconomic resource that can be employed repeatedly as new needs arise (Reichert, 1979; Mines, 1981).
Successive trips allow the migrants to accumulate foreign experience and knowledge that render ties to them increasingly valuable (Massey et al., 1994). Migrants who have been previously deported may adapt and learn from past experiences, gaining insight into the migration process, including understanding potential risks, navigating routes more effectively, and making more informed decisions to enhance the chances of a successful journey. Besides, individuals with prior deportation experience may have established networks or acquired resources that could be beneficial in subsequent attempts. The Guatemalans who have a higher probability of success had already been arrested by U.S. migration authorities more frequently (85%) than the Salvadorans and the Hondurans (respectively 82% and 80%).
This data also shows that having a previous migration experience provides knowledge on the routes and places to temporarily stay (shelters), in a context of exchanging information and favors motivated by feelings of solidarity built on common origins and experience of foreignness (Hernández-León, 2005). The fact that 85% of the total flow of people returned in 2019 stated that it was the first time they had crossed into the United States suggests that inexperience may determine the need to hire a smuggler (Días Ferraro et al., 2020).
Hypothesis 4: The Probability of Success of Irregular Migrants Depends on Specific Choices Made During Their Journey to the U.S.
Considering that the migration process is not solely influenced by individual characteristics, the last hypothesis asserts that the probability of success for Northern Triangle irregular migrants depends on their choices of the modalities surrounding their journey, such as modes of transportation and the specific Mexican state they crossed, which impact the likelihood of their success or failure. The transportation modality to cross the U.S. Southwest border and the Mexican state crossed to enter the U.S. irregularly were indeed found relevant. Graph 7 (A, B) shows the densities of the estimated probabilities of success upon these two conditions.
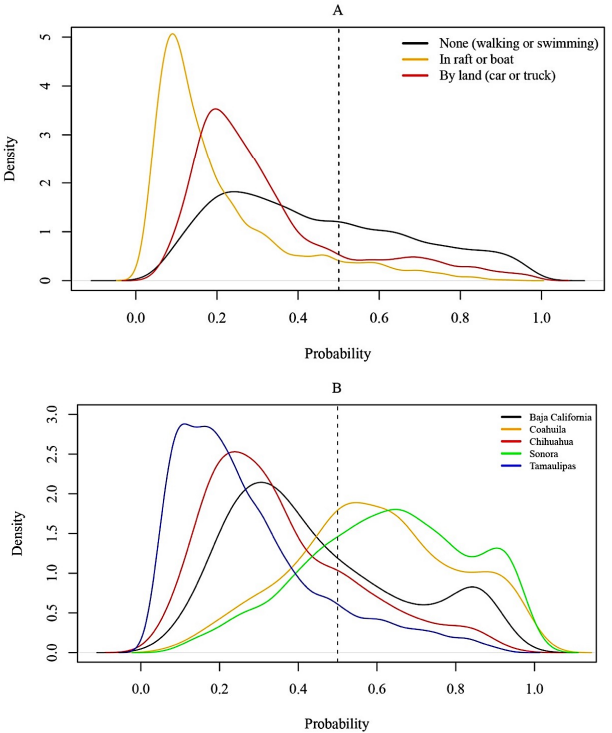
Source: Own elaboration with data from the EMIF SUR (EL COLEF et al., 2016, 2017, 2018, 2019).
Graph 7. Density Plots of the Probabilities of Success per Transportation Modality and per Mexican State to Cross the U.S. Southwest Border
First, the mode of transportation chosen by migrants, whether by foot, vehicle, or other means, plays a crucial role in determining the challenges and vulnerabilities encountered during the journey. Different modalities may expose migrants to varying levels of risk, influence travel speeds, and affect their ability to evade detection. For example, inflatable rafts with groups of migrants on board are characterized by a higher danger than other means in an unsafe journey to cross the Río Bravo on the Mexican side (Riaño, 2021). The estimated probability of success of those migrants using this modality is significantly lower (21%) than those who choose walking (44%) or the car or truck modality (33%).
According to the Missing Migrant Project (2020) data, the leading cause of death among migrants en route to the United States is drowning (Bermúdez Lobera et al., 2020). The records of drowning deaths are located in the border areas, especially in North Mexico, where the Rio Grande River is located, which suggests that a considerable number of persons died while attempting to cross it. From 2014 to July 2019, drowning deaths totaled 230 casualties on the Mexican side and 146 on the U.S. side. It can be inferred that, when migration is irregular, the mode of transportation represents one of the greatest risks faced, as it might often lead to life-threatening situations.
Besides, the choice of the Mexican state through which migrants transit en route to the U.S. border introduces geographical and logistical variations. Different states may present distinct environmental conditions, border enforcement levels, and availability of resources, all of which can significantly impact the migrants’ ability to navigate successfully. Regarding Mexico’s northern route to the U.S., the highest probability of success corresponds to the irregular migrants passing through the Mexican state of Sonora (62.81%), and the lowest probability of success corresponds to those who went through Tamaulipas (26.91%).
Tamaulipas, a state located in northeastern Mexico, poses high risks for migrants (Bermúdez Lobera et al., 2020), recording significant levels of violence against migrants (Izcara-Palacios, 2012). Rural communities in central Tamaulipas, which receive more than 5 000 migrants annually to work in the orange harvest, have suffered violent attacks against migrants since 2009. Despite this, Tamaulipas was also the Mexican state of choice for 73% of the irregular Northern Triangle migrants between 2016 and 2019, and, at least since 2010, Tamaulipas has been the main irregular crossing point for people coming from the Northern Triangle, followed by Sonora (Días Ferraro et al., 2020). The substantial volume of migration passing through Tamaulipas may be attributed to its position as the final stop along the Gulf migratory route before reaching the U.S., a route predominantly favored by the migrant population, likely due to its efficiency and geographical proximity, making it the shortest path to reach the United States.
Even if human and drug smuggling are separate illicit markets along the U.S.-Mexico border, it is important to mention the drug cartels in Mexico. Drug-related violence occurs in the northern border states of Tamaulipas, Chihuahua, and Baja California, where Mexico’s largest border cities are located (Beittel, 2022). As Mexican drug cartels display an increasing capacity for violence, migrant smugglers may find it increasingly necessary to negotiate agreements with local plaza bosses who control specific segments of the border (Greenfield et al., 2019), and since the Northern Triangle migrants have limited access to local migrant networks, they would be more likely to contract with a criminal syndicate that offers smuggling services.
Limitations
Despite the innovative approach presented, certain limitations must be acknowledged. First, the dependent variable, constructed to reflect the success or failure of the Northern Triangle migrants to irregularly enter and reside in the U.S., hinges on specific conditions of space and time, delineating success based on reaching a certain distance from the U.S.-Mexico border and maintaining residence for a designated period. This definition may simplify the nuanced nature of irregular migration success, potentially neglecting other essential dimensions of migrants’ experiences and outcomes.
Moreover, the reliance on U.S. counties within 124 miles of the border as a spatial criterion for success or failure introduces a potential limitation. While federal regulations grant border enforcement authority within 100 miles, the study employs a slightly extended threshold to include counties with centroids beyond this range. This decision, while pragmatic, may impact the accuracy of delineating successful and unsuccessful cases, as it deviates from the strict 100-mile boundary established by federal regulations. Finally, due to the lack of available information from the EMIF SUR survey used for this study, the effect of the migration enforcement authorities could not be tested on the probability of the irregular migrants’ success.
CONCLUSIONS
Drawing on data from the Migration at Mexico’s Southern Border Survey spanning the period from 2016 to 2019, there are some valuable insights into the probabilities of success for Northern Triangle migrants seeking irregular entry and residence in the United States. Through spatial analysis, a detailed dataset of U.S.-Mexico border points was constructed, calculating distances to border counties, and identifying risk counties intending to classify the irregular migrants per success or failure to reach and reside in the U.S. Notably, approximately half of the surveyed irregular migrants exhibited a probability equal to or less than 28%.
Delving deeper into the individual factors influencing these probabilities, it was highlighted the paramount role of gender, with the estimated probability of success for female irregular migrants significantly lower (21%) than that for their male counterparts (37%) during the period 2016-2019. Nationality emerges as another crucial determinant, with Guatemalan migrants assigned the highest probability of success compared to Salvadorans and Hondurans. Beyond demographic variables, financial considerations play a pivotal role, as migrants who made payments throughout their journey, including fees to smugglers for traversing Mexico, exhibited increased probabilities of success. Furthermore, possessing prior experience with irregular migration and the ability to speak English were identified as key factors positively influencing the likelihood of successful irregular residence in the U.S.
Finally, the findings reveal distinctive probabilities of success for migrants crossing different Mexican states, a choice that appears crucial for their success in reaching and residing in the U.S. For instance, migrants passing through the Mexican state of Sonora exhibit the highest probability of success, at 62.81%, while those traversing Tamaulipas face the lowest probability at 26.91%. It is also worth noting that the model does not predict but rather sheds light on the factors determining the success of Central American migrants to irregularly enter and reside in the U.S.

