


 nueva página del texto (beta)
 Inglés (pdf)
 Artículo en XML
 Referencias del artículo
 Enviar artículo por email
 Citado por SciELO
  Similares en
SciELO
Similares en
SciELO 
 Permalink
Introduction
The genus Ganoderma P. Karst. has a worldwide distribution from temperate to tropical environments and has been little studied in desert areas (López-Peña et al., 2016). It is not uncommon to observe their fruiting bodies in various locations in the Sonoran desert associated with roots, trunks, and stems decay; others with dying or stressed trees, or as pathogens in peach orchards in La Costa de Hermosillo, Sonora (López-Peña et al., 2016; 2019). Of the around 500 Ganoderma records in Index Fungorum (2023) and Mycobank (2023), almost 185 are considered taxonomically valid (He et al., 2022). Thirty-six species of Ganoderma have been reported for the Mexican mycobiota (Cappello-García et al., 2023) and eight species in Sonora, Mexico: G. applanatum (Pers.) Pat., G. curtisii (Berk.) Murrill, G. lobatum (Schwein.) G.F. Atk., G. oerstedii (Fr.) Torrend, G. sessile Murrill, G. sessiliforme Murrill, G. subincrustatum Murrill and G. weberianum (Bres. & Henn. ex Sacc.) Steyaert (López-Peña et al., 2016, 2019).
Ganoderma contains about 400 bioactive compounds and more than 150 types of triterpenoids isolated from the fruiting bodies, mycelia, and spores, which vary depending on the species (Wang et al., 2020). Ganoderma lucidum s.l. is the most distinctive species of the genus, used in oriental culture for more than six millennia (Wang et al., 2020). A wide range of Ganoderma commodities derived from its fruiting bodies generate about 5 to 6 billion U.S. dollars in commercialization annually (Hapuarachchi et al., 2018), mainly due to the pharmacological attributes of diverse bioactive compounds. The main bioactive constituents are polysaccharides and triterpenoids, e.g. ganoderic acids; the latter exhibit potent antioxidant, immunostimulant, antitumor, hepatoprotective, hypoglycemic, hypocholesterolemic, and other activities (Cör et al., 2018; Angulo-Sanchez et al., 2022). The production of bioactive compounds in medicinal mushrooms remains a major challenge to meet market demand, particularly in Ganoderma, where the yield of triterpenoids such as ganoderic acids is low (Ahmad et al., 2022; Arshadi et al., 2023).
Ganoderma lucidum is commonly cultivated on a solid medium because it exhibits higher potential pharmacological properties. However, it requires 3-5 months to produce fruiting bodies with variability in chemical composition depending on environmental conditions (Mustafin et al., 2022). Mushroom cultivation is a dynamic industry that recycles a wide range of agricultural wastes by bioconversion into food and supplements, reducing pollution problems due to high-volume open deposition of agro-industrial wastes (Morales-Estrada et al., 2018). A crop that generates waste in Mexico is grapes (Vitis vinifera L., Vitaceae), where Sonora is the leading producer with ~80%, generating 287,913 t of vineyard pruning waste (SIAP, 2022). Part of them is incorporated into the soil with good results, but most of it is incinerated wasting its biotechnological potential (Morales-Estrada et al., 2018). It is necessary to search for alternatives that expand its use.
The chemical composition of vineyard pruning is high in sugars and various compounds susceptible to rapid oxidation (Cabrera et al., 2018), favoring the development of fruiting bodies of Pleurotus spp. (Sánchez et al., 2002), Lentinula edodes (Berk.) Pegler (Gaitán-Hernández et al., 2006), and Ganoderma spp. (Morales-Estrada et al., 2018). In vine wood chips vs. oak wood, fruiting bodies of native Ganoderma strains increase their performance traits (e.g. biological efficiency, production rate, yield, protein, and fat content) (Morales-Estrada et al., 2018). Therefore, the use of vine wood chips represents an environmentally friendly strategy useful for biotechnological applications for cultivation and bioconversion in active compounds (Morales-Estrada et al., 2018).
On the other hand, the liquid culture of Ganoderma has increased because fermentation processes can result in specific products, batch-to-batch uniformity, reduced production time, high productivity, quality control, and easy post-harvest processing (Feng et al., 2016; Sun et al., 2021). Several surveys have been carried out to optimize the medium, pH, oxygen supply, stirring speed, and elicitors (Zhang et al., 2014; Hu et al., 2017, 2018), being a promising alternative for bioactive production. However, mycelial biomass and bioactive yields are still low, which is a significant limitation for commercialization. This research aims to evaluate the effect of vineyard pruning extracts of different polarities and concentrations on biomass in the liquid culture of Ganoderma spp. native strains from the Sonoran desert, Mexico. Therefore, total triterpenoid and antioxidant capacity were prospected by using the most competitive native strain vs. the control strain. The terpenoid structural analysis was determined by Fourier Transform Infrared Spectroscopy (FTIR).
Materials and Methods
Vineyard pruning extracts
Extracts were obtained from dry wood of Vitis vinifera cv. 'Ruby Seedless' from Pesqueira, Hermosillo, Sonora, Mexico (29°21'20.64"N, 110°51'43.30"W), according to the protocol of Harris-Valle et al. (2007). This methodology was selected for its good yield of vineyard pruning waste extracts. From each extract using solvents toluene, chloroform, ethanol, and aqueous, 1 g was taken and diluted in 70% ethanol to prepare the stock solutions. Subsequently, different concentrations (250, 500, 1000, 1500, and 2000 µg/l) of vineyard pruning extracts were prepared. These included polar extracts (ethanol:aqueous, 1:1), polar and non-polar extracts (ethanol-aqueous:toluene-chloroform, 3:1), and a combination of all extracts (toluene:chloroform:ethanol:aqueous, 1:1:1:1).
Following the protocol proposed by Muñoz-Bernal et al. (2023), a preliminary phenolic profile of vine wood extracts was established by HPLC-QTOF-MS/MS in an Agilent system (Infinity Series 1290 LC, Agilent Technologies, Santa Clara, USA) combined with an Agilent 6500 system (Series Q-TOF LC/MS, Agilent Technologies, Santa Clara, USA).
Liquid culture of Ganoderma spp.
We evaluated three native strains of Ganoderma spp. from the Sonoran desert, which were isolated by the Plant and Fungi Biotechnology Laboratory of the Centro de Investigación en Alimentación y Desarrollo, A.C.: G. oerstedii (BH-17), G. subincrustatum (BH-1), and G. weberianum (BH-21). The strains were obtained from the context of fresh fruiting bodies previously collected, taxonomically identified, and reported from the Sonoran desert by López-Peña et al. (2016; 2019). Vouchers of specimens are indicated in Table 1. In addition to the native strains, a commercial strain of G. lucidum (FP-34D, Fungi Perfecti, USA), was included as a control in the study (Table 1).
Table 1: Ganoderma spp. strains evaluated. *Localities belong to the Sonoran desert. **Vouchers are deposited in the Mushroom Collection of Universidad Estatal de Sonora (UES), Mexico.
| Strain | Species | Origin |
|---|---|---|
| BH-1 | Ganoderma subincrustatum Murrill** (UES 10500) | *La Costa de Hermosillo, Hermosillo municipality 29°01'1.47''N, 111°34'24.33''W |
| BH-17 | Ganoderma oerstedii (Fr.) Murrill** (UES 10419) | *Pueblo de Álamos, Ures municipality 29°11'11.97''N, 110°8'48.57''W |
| BH-21 | Ganoderma weberianum (Bres. & Henn. ex Sacc.) Steyaert** (UES 10415) | *Sierra de Mazatán, Ures municipality 29°06'2.29''N, 110°11'0.80''W |
| FP-34D | Ganoderma lucidum (Curtis) P. Karst. | Fungi Perfecti |
The liquid cornmeal culture medium was composed of 21 g cornmeal (Maseca©), 16 g glucose, 2.9 g peptone, and 7 g soy protein per 1l of distilled water (Xu et al., 2008). This medium was selected because, in preliminary evaluations with potato dextrose agar, malt extract agar, and glucose peptone agar, the highest biomass production was observed in the cornmeal medium (data not shown). The initial pH was adjusted to 5.5. The assessments were made in triplicate with 50 ml of liquid culture, to which a mycelium disk of 1 cm in diameter was added. The flasks were then placed in a refrigerated orbital incubator shaker model TE-421 (Tecnal, Sao Paulo, Brazil) at 25 °C at 120 rpm, under darkness, for 7 d with the different extracts and concentrations, as well as a control without extracts. Then, the culture broth was filtered with Whatman #1 paper, and two washes with 100 ml of distilled water were carried out on the harvested fungal biomass, from which samples were taken, structurally analyzed, and compared with the pure original culture in Petri dish, under light microscopy (Olympus, Model BX51, Tokyo, Japan) to verify contamination-free cultivation. Samples were stored at -20 °C and then lyophilized (LyoQuest-85 PLUS ECO, Lyoquest, Telstar, Terrassa, Spain), weighed to determine biomass production and stored at 25 °C.
Antioxidant capacity
The antioxidant capacity was determined in the native strain with the highest total biomass production (G. oerstedii) and G. lucidum. Both strains were grown in 400 ml of the cornmeal culture medium described above, adding polar extract at 500 µg/l and the combination of all extracts at 1000, µg/l respectively. These extracts were selected in the preliminary evaluation, where G. oerstedii and G. lucidum produced the highest amount of biomass with these treatments. Then, the biomass was collected, filtered, and lyophilized at 3, 6, 9, 12, and 15 d of culture. Lyophilized fungal biomass was macerated to obtain the methanolic extracts later for subsequent analysis. A sample of 1 g was taken and homogenized with 20 ml of 80% methanol, then sonicated for 30 min and centrifuged at 9400 g for 15 min at 4 °C (2-16KL, Sigma, Osterode am Harz, Germany). The supernatant was recovered and filtered with Whatman #1 paper; the extraction residues were washed twice more with 10 ml; extracts were stored at -20 °C.
The ferric reducing antioxidant assay (FRAP), which relies on the reduction of ferric tripyridyltriazine (FeIII-TPTZ) by the antioxidants forming ferrous tripyridyltriazine (FeII-TPTZ), was evaluated; it was determined following the protocol of Benzie and Strain (1996). In the TEAC method (Trolox Equivalent Antioxidant Capacity), the ABTS+ radical is inactivated; 19.3 mg of K2S2O8 is mixed in 1 ml of distilled water; it was evaluated according to the protocol of Re et al. (1999). For the ORAC (Oxygen Radical Absorbance Capacity) method, the protocol of Ou et al. (2001) was followed. In the three assays to analyze the antioxidant capacity, a Trolox standard curve was made from 6.25 to 200 µM, and methanol was used as a blank. Absorbance was determined in a spectrophotometer FLUOstar Omega (BMG Labtech Inc., Cary, North Carolina, USA).
Triterpenoid content
The potential for total triterpenoid production was explored only with the native G. oerstedii strain due to its greater biomass production, contrasting it with the commercial control strain (G. lucidum). Total triterpenoids were determined by the spectrophotometric method using a 96-well microplate according to the protocol of Bidegain et al. (2019). Oleanolic acid (O5504, Sigma©) dissolved in methanol was the standard. G. lucidum and G. oerstedii methanolic extracts, as well as standard, were placed in each well cell and evaporated to dryness (60 °C, 2 h); then filled with 10 µl of 5% vanillin (V1104, Sigma©) in glacial acetic acid and 35 µl of 70% perchloric acid. The calorimetric reaction was heated at 60 °C for 45 min, then cooled to 4 °C for 5 min and diluted with 165 µl of glacial acetic acid. The absorbance was determined at 548 nm in a spectrophotometer FLUOstar Omega (BMG Labtech Inc., Cary, North Carolina, USA). All experiments were performed in triplicate.
FTIR
The structural analysis of G. oerstedii and G. lucidum methanolic extracts was determined using attenuated total reflectance-Fourier transform infrared spectroscopy (FTIR). Both strains were previously selected for the total triterpenoid content assay. Control and treatment samples were analyzed in liquid state with two lectures in a Cary 630 FTIR spectrophotometer (Agilent, Santa Clara, USA). The spectra range analyzed was 4000 to 650 cm-1 with a resolution of 4 cm-1. Fifty scans were averaged for each spectrum. The spectra were obtained using Spectragryph-Optical Spectroscopy Software v. 1.2.16.1 (SOSS, 2022). Analysis of each sample was done in duplicate.
Statistical analysis
To evaluate biomass production (response variable), a completely randomized design with a 3 × 4 factorial arrangement was used, where the factors were the three types of extracts and the four species. For treatments with significant differences, a Tukey-Kramer means comparison test was applied at p<0.05 using NCSS 2020 software v. 20.0.8 (NCSS, 2020). To determine the type and concentration of optimal extract by species, the response surface analysis was applied with the Design Expert 11 program (SEI, 2018). A one-way variance analysis was performed for the antioxidant capacity, using TEAC, FRAP, and ORAC as response variables. When there was a significant difference between treatments, the Tukey-Kramer means comparison test was applied using NCSS 2020 software v. 20.0.8 (NCSS, 2020). For total triterpenoids, a completely randomized design was used with a 2 × 5 × 2 factorial arrangement, and the Tukey-Kramer mean comparison was applied using NCSS 2020 software v. 20.0.8 (NCSS, 2020).
Results
Vineyard pruning extracts - biomass production
The highest yield of the extracts corresponded to the aqueous (5.34 g), with slightly more than twice the ethanolic (2.61 g), followed by toluene (1.28 g), and chloroform (1.12 g). In general, the proportion of polar extracts was higher than non-polar extracts (3.3:1). Preliminary analysis by HPLC-QTOF-MS of polar vineyard pruning extracts for phenolic compounds showed the presence of resveratrol, naringenin, ellagic acid, and quercitrin, while in the non-polar extracts, caryatin, naringenin, hydroxybenzoic acid, among others were present (data not shown).
Biomass production varied significantly among Ganoderma species (p<0.05); the highest corresponding to G. oerstedii, followed by G. subincrustatum, with no differences between G. weberianum and G. lucidum (p>0.05) (Fig. 1). The highest biomass production was recorded in G. oerstedii with the polar extract at 500 µg/l, followed by the same extract at 250 µg/l (Table 2). In contrast, the lowest biomass generation was determined in G. lucidum with polar at 1500 µg/l, followed by G. weberianum without extracts. Biomass production changed according to Ganoderma species and vineyard pruning extract type and concentration.
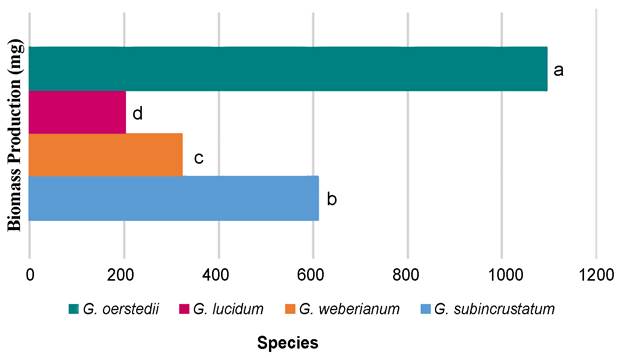
Table 2: Biomass production of Ganoderma spp. strains cultivated in liquid media with vineyard pruning extracts. † Concentration in µg/l; control: without extracts; polar (ethanol:water, 1:1); all (toluene:chloroform:ethanol:water, 1:1:1:1); 3:1 (polar and non-polar: ethanol-water:toluene-chloroform). *Means with different superscripts are significantly different (p<0.05, Tukey-Kramer).
| Treatments † | Ganoderma lucidum (Curtis) P. Karst. | Ganoderma oerstedii (Fr.) Murrill | Ganoderma subincrustatum Murrill | Ganoderma weberianum (Bres. & Henn. ex Sacc.) Steyaert |
|---|---|---|---|---|
| Control | *185.4±96.87s-t | 1285.15±45.04a-c | 499.85±66.54i-t | 133.80±30.12s-t |
| Polar 250 | 164.95±34.44s-t | 1519.40±171.40ab | 216.90±17.25r-t | 317.15±87.89n-t |
| Polar 500 | 146.20±20.51s-t | 1617.15±87.89a | 773.05±189.15d-p | 270.40±28.71q-t |
| Polar 1000 | 243.70±40.73q-t | 1098.25±199.90b-g | 837.65±135.55c-m | 219.00±87.40r-t |
| Polar 1500 | 97.55±24.54t | 979.30±26.73c-i | 734.85±230.59e-q | 281.95±35.85p-t |
| Polar 2000 | 175.40±29.27s-t | 1282.60±144.82a-c | 854.85±145.03c-m | 435.90±40.31k-t |
| All 250 | 204.00±53.17r-t | 1027.20±115.26b-h | 363.05±83.93m-t | 379.30±99.28l-t |
| All 500 | 202.40±5.23r-t | 1143.85±225.49a-f | 623.95±50.28g-s | 472.85±34.29j-t |
| All 1000 | 371.00±27.86m-t | 968.15±220.41c-j | 399.30±115.40l-t | 287.00±64.63p-t |
| All 1500 | 198.30±18.81r-t | 1174.85±63.28a-f | 578.55±122.82h-t | 376.40±112.71l-t |
| All 2000 | 244.95±23.69q-t | 1203.70±44.40a-e | 811.95±153.80c-n | 232.15±57.35r-t |
| 3:1 250 | 192.50±37.33s-t | 1243.40±133.36a-d | 874.65±163.41c-l | 316.50±52.32n-t |
| 3:1 500 | 192.45±27.79s-t | 795.90±19.09c-o | 424.75±20.01k-t | 389.85±74.88l-t |
| 3:1 1000 | 269.50±31.82q-t | 914.95±127.07c-k | 827.65±181.09c-m | 301.30±41.01o-t |
| 3:1 1500 | 309.40±95.88o-t | 978.35±62.01c-i | 973.65±307.52c-i | 292.05±33.73p-t |
| 3:1 2000 | 247.35±2.48q-t | 954.65±112.36c-j | 693.75±195.80f-r | 565.20±25.31h-t |
Due to the variability observed, we applied the response surface methodology to identify the optimal growing conditions. The variables considered were the type and concentration of extracts and biomass production by species. In G. lucidum (Fig. 2A), no significant differences were recorded between the extract of all solvents and polar and non-polar (3:1); however, the yield was significantly lower with polar extract (p<0.05). The highest biomass production was obtained with the extract of all solvents at 1000 µg/l, followed by polar and non-polar (3:1) at 1500 µg/l. The polar extract showed the lowest production at 1500 and 500 µg/l.
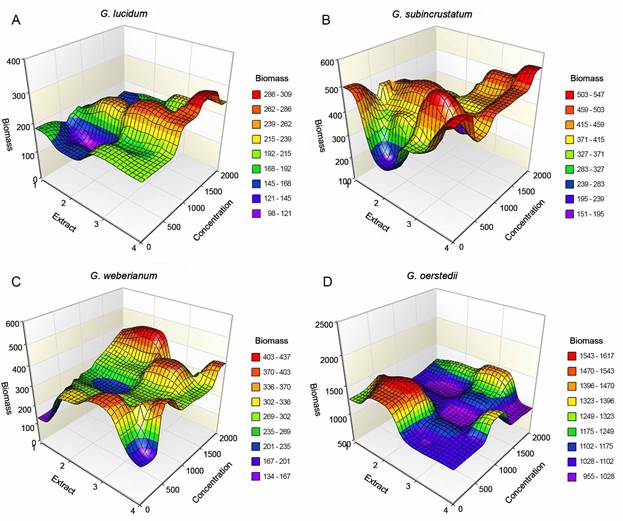
Figure 2: Response surface analysis. A. Ganoderma lucidum (Curtis) P. Karst. (FP-34D); B. Ganoderma subincustratum Murrill (BH-1); C. Ganoderma weberianum (Bres. & Henn. ex Sacc.) Steyaert (BH-21); D. Ganoderma oerstedii (Fr.) Murrill (BH-17). Biomass (mg); type of extracts: 1: control, without extracts; 2: polar (ethanol:aqueous, 1:1); 3: polar and non-polar (ethanol-aqueous:toluene-chloroform, 3:1); 4: all extracts (toluene:chloroform:ethanol:aqueous, 1:1:1:1); concentration: 0, 500, 1000, 1500, and 2000 µg/l.
In G. subincrustatum, biomass generation changed among treatments (p<0.05) (Fig. 2B); named, polar and non-polar (3:1)>polar>extract with all solvents. The highest biomass formation was recorded with polar and non-polar (3:1) at 1500 µg/l, followed by the same extract at 250 µg/l. Conversely, the lowest production was determined with polar extract at 250 µg/l, followed by extract with all solvents at 250 µg/l. In G. weberianum (Fig. 2C), no differences among treatments were observed (p>0.05). The highest biomass generation was registered with polar and non-polar (3:1) at 2000 µg/l, followed by extract with all solvents at 500 µg/l. The lowest production was recorded without extracts, followed by polar extract at 1000 µg/l. In G. oerstedii (Fig. D2), differences among extracts were found (p<0.05). The highest biomass generation occurred with polar extract at 500 µg/l, followed by the same at 250 µg/l, while the lowest occurred with polar and non-polar 3:1 at 500 µg/l, followed by the same extract at 1000 µg/l. In general, this strain showed higher biomass production with the different treatments compared to the other strains.
Antioxidant capacity
There was no significant difference between G. lucidum and G. oerstedii (p>0.05) with ORAC (Fig. 3A). In G. oerstedii, the highest antioxidant capacity was obtained in the medium with extracts at 12 d and the lowest with extracts at 3 d. In G. lucidum, the highest antioxidant capacity was produced with the control at 15 d and the lowest with extracts at 3 d (Fig. 3B). There was a significant difference between G. lucidum and G. oerstedii with FRAP (p<0.05), with higher activity in the latter (Fig. 3A). In G. oerstedii, the highest antioxidant capacity was recorded with the control at 12 d and the lowest at 3 d. In G. lucidum, the highest antioxidant capacity values were observed with extracts at 15 d and the lowest at 3 d (Fig. 3B).
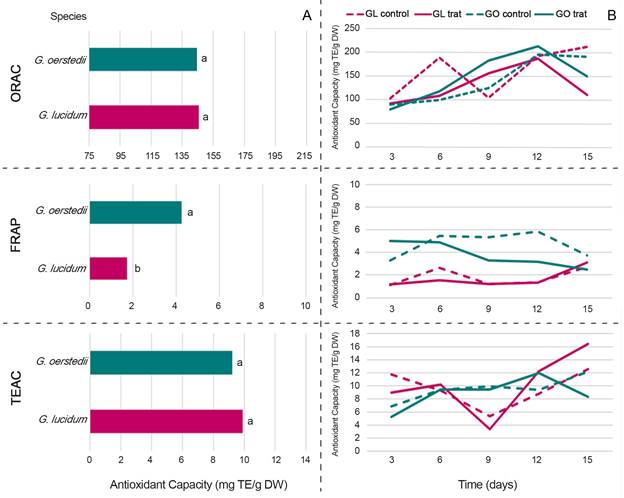
Figure 3: Antioxidant capacity determined by ORAC, FRAP, and TEAC from biomass of Ganoderma oerstedii (Fr.) Murrill (Go)(BH-17) and G. lucidum (Curtis) P. Karst. (GI)(FP-34D). A. total value; B. concerning time (days 3, 6, 9, 12, and 15) (p<0.05). Sample tested in triplicate.
There was no significant difference between G. lucidum and G. oerstedii with TEAC (p>0.05) (Fig. 3A). In G. oerstedii, the highest antioxidant capacity was achieved with the control at 15 d and the lowest with extracts at 3 d. In G. lucidum, the highest antioxidant activity was recorded with extracts at 15 d and the lowest with the control at 9 d (Fig. 3B). The response was dissimilar, with no clear trend for a greater or lesser antioxidant capacity. It is relevant to highlight this activity in the dikaryotic mycelium of both Ganoderma species, with FRAP being higher in native species.
Total triterpenoids
The total triterpenoid content of Ganoderma species varied significantly between strains through culture days, but not between treatments (Table 3). Ganoderma oerstedii and G. lucidum produced the highest amount of terpenoids on days 9 and 12 of culture with the extract, respectively, and the lowest on days 15 and 3 of culture with the extract and the control, respectively. Overall, G. oerstedii was the best strain to produce triterpenoids, but without significant differences between treatments.
Table 3: Total triterpenoid content of Ganoderma lucidum (Curtis) P. Karst. and G. oerstedii (Fr.) Murrill methanolic extract. Go: Ganoderma oerstedii; Gl: G. lucidum; the units are in µg/ml; means and standard deviation with different superscripts are statistically different (p<0.05). Sample tested in triplicate.
| Strain | Treatment | Days | x̄/Treatment | x̄/Strain | |||||
|---|---|---|---|---|---|---|---|---|---|
| 3 | 6 | 9 | 12 | 15 | |||||
| Go | Control | 429.75±51.85bcd | 520.58±119.03abc | 520.58±117.85abc | 568.92±28.28ab | 441.42±09.43bcd | Control | Go | |
| Extract | 367.67±39.48bcde | 556.00±15.91ab | 686.00±21.80a | 514.75±55.39abc | 339.33±47.73cde | 390.52±149.98a | 494.5±109.82a | ||
| Gl | Control | 71.42±29.46f | 338.50±76.01cde | 252.67±07.66def | 388.08±34.18bcd | 373.29±24.45bcde | Extract | Gl | |
| Extract | 173.50±72.48ef | 258.92±04.71def | 288.92±12.96de | 466.00±50.09bcd | 415.17±10.02bcd | 406.62±152.03a | 302.65±119.62b | ||
| x̄ /days | 260.58±159.14c | 418.50±116.09ab | 437.04±118.94ab | 484.44±78.29a | 392.30±123.92b | ||||
FTIR
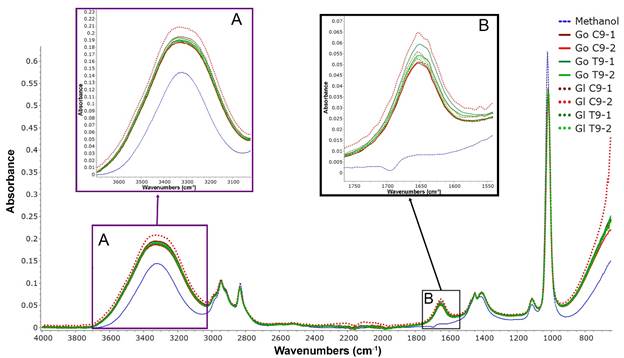
Figure 4 shows the FTIR spectra for G. lucidum and G. oerstedii methanolic extracts. The intensity of the signals between 3600 to 3000 cm-1 (hydroxyl groups) (Fig. 4, Box A) and 1700 to 1600 cm-1 (enols, benzene ring) (Fig. 4, Box B) depended on the duration of treatment and may be related to the triterpenoid content.
Discussion
The yield of vineyard pruning extracts was similar to the previous report of Harris-Valle et al. (2007), being even higher in polar vs. non-polar (7.6:1). Differences may be due to wine grape variety, material origin, particle size, harvest season, and storage time. Tay and Chong (2016) found this same trend in papaya leaf extracts with polar and non-polar solvents, which they attribute to the ability of polar solvents to dissolve more compounds including phenols, a higher proportion in the substrate, and easier extraction.
The enhancement of fungal biomass production by vineyard pruning extracts was observed in the liquid culture of Lentinula edodes by Harris-Valle et al. (2007) and López-Peña et al. (2013). Harris-Valle et al. (2007) supplemented the culture medium with polar, non-polar, and mixed extracts. Chloroform extract did not affect growth but decreased with toluene extract. Aqueous and ethanolic extracts showed a growth-promoting effect vs. control (p<0.05). Because the growth of L. edodes increased by 50 (Harris-Valle et al., 2007) and 100% (López-Peña et al., 2013) in the culture medium glucose-peptone 40:10 (v/v) supplemented with polar and non-polar extract (3:1), this concentration of extracts was also evaluated in the present study.
For the different Ganoderma strains, the elicitor effect varied according to extract type and concentration; thus, the mixture of four solvent extracts at 1000 µg/l was the best in G. lucidum, polar at 500 µg/l in G. oerstedii, polar and non-polar (3:1) at 500 µg/l in G. subincrustatum, and the last extract at 2000 µg/l in G. weberianum. This variable response could be explained by the complex chemical composition of vineyard pruning extracts and the complexity of the metabolic pathways involved in biomass formation, which respond differently to these elicitors. The cornmeal culture medium is considered optimal for growing Ganoderma species (Xu et al., 2008); however, because it is a complex medium, it could mask the promoting effect of vineyard pruning extracts (López-Peña et al., 2013). These authors also used an enriched broth with a discrete increase in production of ca. 14%. There was also an enhancement in the growth of L. edodes, yielding at 15 d an amount of biomass that exceeded what the control achieved by 21 d. Tay and Chong (2016) mention that antifungal papaya extracts (Carica papaya L.) at low concentrations initially improve the growth and development of Ganoderma boninense Pat. mycelium. Thus, the response of a fungal species is variable depending on the type and concentration of the extract.
Biomass and ganoderic acid yields have been increased by fermentation changes, the addition of promoters, and the development of new bioprocessing strategies (Feng et al., 2016; Hu et al., 2018). Some elicitors enhance the polysaccharides and ganoderic acids production in the liquid culture of G. lucidum (Feng et al., 2016). Hu et al. (2018) showed that a static culture with adequate nitrogen limitation could promote the accumulation of ganoderic acids, and an air supply further enhances their production. In addition to enhancing secondary metabolite synthesis, elicitors can play an important role in biosynthetic pathways. Zhao et al. (2011) demonstrated that limiting nitrogen sources increases ganoderic acids through transcriptional induction of biosynthetic genes. Heydarian et al. (2015) used methyl jasmonate as an inducer of ganoderic acids and added salicylic acid during culture to cause apoptosis; they also evaluated the synergistic effect and obtained a significant relationship in the metabolite production. Likewise, Zhang et al. (2014) identified cellulase as an effective elicitor to increase ganoderic acid production.
An alternative to enhance the elicitor effect would be to use a non-enriched culture medium or add the extracts every few days of culture as suggested by the microcalorimetry study with Ganoderma spp. native strains from Sonora (Martínez-Miranda et al., 2023), where an increase in the growth rate was observed after establishing the fungus in the liquid culture of glucose-peptone. Overall, in this study, the native Sonoran desert strains had a higher metabolic yield compared to G. lucidum, when cultivated with vineyard pruning extracts. The growth rate of G. curtisii and G. weberianum increased mainly due to a 3:1 ratio of polar and non-polar extracts. The time of greatest activity and the adaptation phase varied based on strain, polarity, and concentration of extracts.
The culture condition, strain, and time produced a variable response in the antioxidant capacity determined by ORAC, TEAC, and FRAP. Shah and Modi (2015) compared the antioxidant activity of an aqueous extract of three mushroom species cultivated in a liquid yeast powder-glucose-peptone medium: G. lucidum, L. edodes, and Agaricus bisporus (J.E. Lange) Imbach. They recorded significant differences (p<0.05), being higher in G. lucidum for DPPH, ABTS, and FRAP, all assays with a concentration of 0.5-5.0 mg/ml with the scavenging activity of 21.5-68.1%, 46.7-72.2%, and 0.04-0.13 ascorbic acid equivalents AAE/ml, respectively.
Ayala-Zavala et al. (2015) performed ethanolic extracts of Ganoderma species fruiting bodies from Sonora, Mexico, to analyze their antioxidant potential. The authors determined the content of phenolic compounds, obtaining the highest amount in G. subincrustatum, followed by Ganoderma sp., G. curtisii, and G. oerstedii, being the content of phenols (8.5, 5.5, 5.5, and 3.7 gallic acid equivalents mg/g) and flavonoids (2.9, 2.5, 2.4, and 2.0 quercetin equivalents mg/g), respectively. The correlation between the concentration of these compounds and antioxidant capacity was positive.
Aruwa et al. (2021) evaluated the antioxidant capacity of G. lucidum basidiomes. For this purpose, authors prepared extracts of different polarities and tested them to varying concentrations with an increase proportional to the concentration of the extract. The percentage scavenging activity for DPPH varied from 6.4 (hexane extract at 200 µg/ml) to 96.4 (ethylacetate extract at 1000 µg/ml). For FRAP, hexane extract was better at 60, 80, and 100 µg/ml, while in ethanolic extract at 40 µg/ml. For total antioxidant capacity (TAC), hexane extract at 200 and 600 µg/ml was better, while ethylacetate at 1000 µg/ml. The fungal antioxidant capacity was attributed to mycochemicals; they determined a significant number of alkaloids, flavonoids, saponins, tannins, and terpenoids.
Sułkowska-Ziaja et al. (2022) cultivated in liquid medium six species of Ganoderma, analyzing bioactivity and the mycochemical profile of mycelial culture extracts, determining phenolic acids, amino acids, indoles, sterols, and kojic acid, with variability according to the species, which has an impact on the antioxidant capacity (p<0.05). Cör et al. (2018) obtained fractions rich in polysaccharides and terpenes from G. lucidum extracts; likewise, they demonstrated that terpenes have greater antioxidant activity, highlighting ganoderic acids. Extracts of G. lucidum spore powder inhibited DPPH radicals with a maximum of 61% at triterpenoid concentration of 600 µm/ml (Shen et al., 2020). In the present study, FRAP results varied in antioxidant activity (p<0.05), knowing the mycochemical profile of G. oerstedii and G. lucidum strains will help to explain these differences.
The Ganoderma oerstedii strain was obtained from the cactus Stenocereus thurberi (Engelm.) Buxb. in the Sonoran desert (López-Peña et al., 2016), where arid conditions could be a factor to improve triterpenoid production. In G. oerstedii on days 6 and 9, and in G. lucidum on days 9, 12, and 15 of culture, the average content of total triterpenoids was higher with vineyard pruning extract, but not significantly different (p>0.05) (Table 3). The elicitors used in Ganoderma spp. liquid culture generally do not show a direct correlation with bioactive production (Shi et al., 2015; Cao et al., 2017).
FTIR spectra of Ganoderma species extracts were similar to previous studies of G. lucidum extracts. Bidegain et al. (2019) mentioned that G. lucidum extracts present strong peaks in the region of 3600-2400 cm-1 that corresponds to the stretching mode of -OH and -NH. Signals at 2948 and 2835 cm-1 corresponded to the stretching of aliphatic methyl groups (CH3) in the triterpenoid rings. Peaks in the region of 1700-1600 cm-1 were attributed to the benzene ring. These peaks were observed in the FTIR of G. oerstedii and G. lucidum. Sangeetha et al. (2019) determined for G. lucidum extract at 1480-1410, 1350-1260, and 1075-1000 cm-1, corresponding to the stretching mode of halogens (C-F, C-Br, and C-I), phosphorus compounds (P-O-P and P-Cl), and silicon compound Si-O-Si, respectively. Carbohydrate fingerprint signals were observed between 1100 and 1000 cm-1. These signals can be attributed to the presence of β-glucans in Ganoderma extracts (Choong et al., 2012), which were not observed in our samples due to the solvent signal.
Conclusion
Vineyard pruning extracts enhance the biomass production of Ganoderma spp. strains native from the Sonoran desert, when growing in liquid medium exhibiting a competitive level with a differential response based on the strain, composition, and concentration of extracts. On the other hand, the antioxidant capacity and total triterpene content were variable in response to the nature of the extracts.

