




 nueva página del texto (beta)
 Inglés (pdf)
 Artículo en XML
 Referencias del artículo
 Traducción automática
 Enviar artículo por email
 Citado por SciELO
  Similares en
SciELO
Similares en
SciELO 
 Permalink
1. Introduction
Understanding the connection between energy available for atmospheric convection and the occurrence of convective activity is crucial (Adams and Souza, 2009). Convective activity in the atmosphere is fuelled by the instability that permeates the entire atmosphere (Jayakrishnan and Babu, 2014; Samanta et al., 2020). Environmental parameters to assess the development of convective activity are derived from vertical profiling of meteorological variables, e.g., temperature, humidity, and wind (Rasmussen and Blanchard, 1998; Brooks et al., 2003; Púčik et al., 2015; Sahu et al., 2020a, b; Taszarek et al., 2020a). Due to differences and uncertainties in available human reports, remote sensing methodologies, and computational techniques, climatological analysis of convective weather events is challenging (Varga and Breuer, 2022). The thermodynamic indices, which calculate potential, conditional, latent, and convective instability, are widely used to accurately examine the physical and dynamic evolution of the atmosphere (Kunz, 2007; Tyagi et al., 2011). The two environmental proxies that are most frequently employed to describe convective evolution across any region are convective available potential energy (CAPE) and convective inhibition (CIN) (Murugavel et al., 2014; Westermayer et al., 2017; Liu et al., 2020; Sahu et al., 2022a, b). CIN represents the negative buoyant energy required to lift an air parcel upward to its level of free convection (LFC) for convective event initiation. CAPE represents the positive buoyant energy associated with the parcel. The favorable conditions for convective events commonly occur under low CIN, high CAPE environments (Brooks et al., 2007; Riemann-Campe et al., 2009, 2011).
The calculation of CAPE and CIN is based on vertical profiling of temperature and humidity in the atmosphere, which is usually achieved with radiosonde observations (Tyagi et al., 2013). Radiosonde observations often capture the thermodynamic characteristics of an area of interest; however, they generally have limited geographical and temporal coverage. Radiosonde observations have been used as benchmarks for verifying and calibrating soundings retrieved from satellites (Kuo et al., 2005), which supplement in-situ observations in regions with no data recording available. Despite broad coverage, space-borne observations have poor temporal sampling (Das et al., 2016). Temporal and spatial continuity would be helpful for accurately understanding and predicting the development of any convective activity over the region of interest. The excellent global coverage of climate reanalyses makes them popular for understanding atmospheric events (Virman et al., 2021). Climate research applications currently rely heavily on reanalyses (Hersbach et al., 2020). The European Centre for Medium-Range Weather Forecasts (ECMWF) reanalysis product ERA5 is one of the most frequently used datasets for the spatial analysis of convective variables due to its proven accuracy (Sahu et al., 2022a; Sahu and Tyagi, 2022; Bandary et al., 2025).
However, ERA5 monthly mean CAPE is overestimated by 20 J kg-1 when convection is at its peak (April to September) over the European regions. In contrast, ERA5 underestimates CIN by nearly 5 J kg-1 (Varga and Breuer, 2022). For most sites east/west of the Rocky Mountains, extreme CAPE is typically underestimated/overestimated by ERA5 (Li et al., 2020). Eastern India experiences severe thunderstorms and is one of the lightning hotspots during the pre-monsoon season (Tyagi et al., 2014, 2022; Tyagi and Satyanarayana, 2015). Several studies have reported using ERA5 data for spatial analysis of convective variables over eastern India (Sahu et al., 2020a, b). The ERA5 bias estimation for convective variables has not been reported in eastern India. The present work aims to evaluate the performance of CAPE and CIN convective variables derived from ERA5 dataset over eastern India.
2. Study sites, data description, and methodology
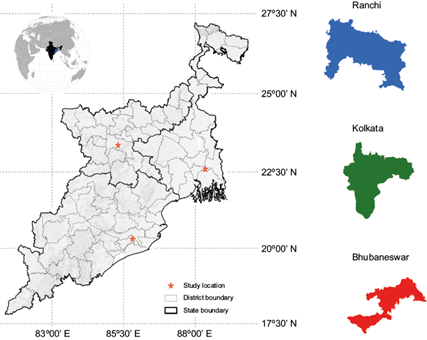
For the current study, we have considered three state capital cities in eastern India: Bhubaneswar, Kolkata, and Ranchi. Eastern India experiences high convective activities during the pre-monsoon season (March-May). The Bay of Bengal, located near these areas, provides a substantial moisture supply, facilitating the generation of severe convective events (Tyagi et al., 2022). Figure 1 represents the three site locations in eastern India. Radiosonde observations at 00:00 and 12:00 UTC were obtained from the University of Wyoming archive (https://weather.uwyo.edu/upperair/sounding.html) and were used for plotting only after quality control, including removal of missing values and physically unrealistic outliers. Daily text soundings were converted to spreadsheet format and limited to pressure, air temperature, and dew-point temperature. Because vertical resolution varied by day and dew-point temperature was frequently unavailable at several levels, all March-May profiles for the three stations were re-gridded to a common 27-level pressure framework (1000-100 hPa), with missing levels retained as NaN. Vertical gaps were filled using MetPy interpolation (MetPy, 2025), applied only to soundings containing at least five observed levels. Convective instability indices (SBCAPE, MLCAPE, and MUCAPE) were then computed from the interpolated profiles, considering only soundings with at least 12 valid levels to ensure robust estimates. For visualization and additional outlier control, only values between the 5th and 95th percentiles were retained. ERA5 reanalysis data were obtained from the ECMWF Copernicus Climate Data Store (ECMWF, 2024). ERA5 (Hersbach et al., 2020) was analyzed at 00:00 and 12:00 UTC at 0.25º × 0.25º resolution and matched to each radiosonde site using the nearest ERA5 grid point (ERA5 provides 137 vertical levels [Gensini et al., 2021]). The study period covers 1987-2016 (March-May) for Bhubaneswar and Kolkata, and 1994-2016 (March-May) for Ranchi, based on data availability at both synoptic hours. From ERA5 as well, we have calculated the convective indices using MetPy, so that, when comparing, there will be no uncertainty due to different methods of calculation.
2.1 Convective available potential energy (CAPE)
The potential energy in the atmosphere that can cause upward motion and form turbulent (convective) clouds is measured by the CAPE (positive buoyant energy). Assuming a parcel of air is raised from the surface to a specific level, it is computed as the vertical integral of the differential between the virtual temperature of the air parcel and the atmosphere at each level (Moncrief and Miller, 1976).
where g is the acceleration caused by gravity (9.81 m s-2), ZLNB is the height of the level of neutral buoyancy, ZLFC is the height of the level of free convection, T ve is the environmental virtual temperature, T vp is the air parcel virtual temperature that has been raised from the surface to the upper level of the atmosphere, and Z represents the height above the ground. CAPE is also indicated by the area enclosed between the moist adiabat and temperature line from the level of free convection (LFC) to the equilibrium level (EL), representing the positive buoyancy associated with the parcel to support the convective growth.
2.2 Convective inhibition (CIN)
CIN (negative buoyant energy) measures the energy needed to start updrafts and convective clouds by overcoming the atmosphere’s stability. It is computed as the vertical integral of the virtual temperature differential between the atmosphere and a parcel of air raised to the LFC from the surface (Colby, 1984).
where T v,parcel represents the virtual temperature of the lifted air parcel, T v,env represents the temperature of the surrounding environment, CIN is the area between the parcel’s origination level (e.g., the ground) to the LFC enclosed by temperature and the adiabat/moist adiabats (Riemann-Campe et al., 2009; Stull, 2017).
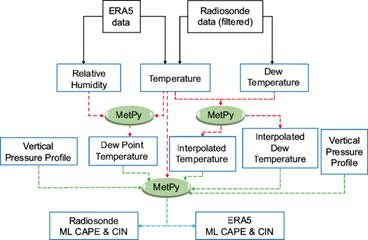
CAPE and CIN values for the radiosonde profiles are available from the University of Wyoming (https://weather.uwyo.edu/upperair/sounding.html); however, the CAPE and CIN values obtained from the University of Wyoming cannot be directly compared to those from ERA5 because the Wyoming database provides mixed-layer CAPE (MLCAPE) and CIN, whereas the ERA5 diagnostic uses a different methodology to compute CAPE. To calculate MLCAPE we used the temperature and relative humidity variables from ERA5 and followed the approach, as outlined in the flow chart shown in Figure 2. Calculations were performed using the Python package MetPy (MetPy, 2025), which uses vertical and dewpoint temperatures. Vertical temperature was obtained from ERA5, while dewpoint temperature was calculated using the MetPy package, which uses relative humidity and temperature. Using the package, we calculated the MLCAPE and MLCIN values and compared them with the radiosonde data provided by the University of Wyoming (UW, 2024).
2.3 Calculation of error metrics
For the statistical analysis of ERA5-derived temperature, relative humidity, CAPE, and CIN values, we used root mean square error (RMSE), mean absolute error (MAE), mean bias error (MBE), and Pearson correlation coefficient (r). RMSE is defined as the square root of the average of the squares of all errors. It gives the standard deviation of the residuals (errors).
where x i and y i represent the obtained and true values for the i th pair of n pairs.
MAE is defined as the arithmetic average of the absolute difference between the obtained and true value.
where x i and y i represents obtained and true values for the i th pair of n pairs. MBE is defined as the mean of the differences between the obtained and true values.
where x i and y i represents the obtained and true values for the i th pair of n pairs.
Pearson correlation coefficient (r) is determined by the ratio of the covariance between two variables to the product of their standard deviations.
Here, x̅ represents the average of all the x values, and y̅ represents the average of the y values. where x i and y represent the obtained and true values, respectively, for the j th pair of n pairs.
3. Results and discussion
3.1 Observed biases in ERA5-derived CAPE and CIN
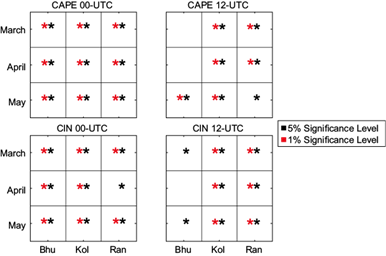
The present study employs CAPE and CIN to evaluate the performance of ERA5 datasets in capturing atmospheric convective instability over eastern India. Box-whisker diagrams have been used to define the CAPE and CIN values, including the mean, median, maximum, and minimum, for the study period across the sites. Figure 3 compares CAPE and CIN values derived from radiosonde measurements and ERA5 data at 00:00 and 12:00 UTC across three study locations. All values were subjected to physical verification to exclude any extreme or unrealistic data before being included in the analysis. The statistical significance calculated using a two-sample t-test, as shown in Figure 4 for CAPE at 00:00 and 12:00 UTC, is significant at the 1 and 5% levels for all months and all stations.
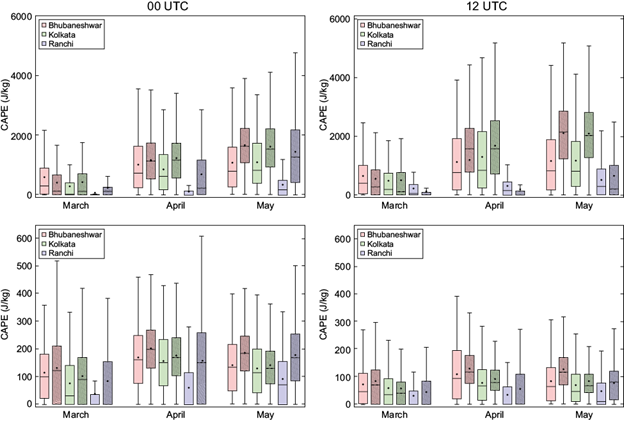
Fig. 3 Month-wise box plots are portrayed for radiosonde and ERA5 to compare CAPE (upper panel) with CIN (lower panel) over Bhubaneswar (red), Kolkata (green), and Ranchi (blue). The first column shows the 00:00 UTC variability, while the second column shows the 12:00 UTC variability. The solid fill box shows radiosonde, and the patterned fill box represents the ERA5 values. The quartiles are 25%, median (line), mean (dot), and 75%.
3.1.1 CAPE bias characteristics for 00:00 UTC
At 00:00 UTC, ERA5 exhibits station- and month-dependent CAPE biases, with a clear tendency toward CAPE overestimation in April and May, particularly inland at Ranchi. At 00:00 UTC, ERA5-derived CAPE shows a clear station- and month-dependent bias relative to radiosonde observations. Over Bhubaneswar, ERA5 is marginally lower than the radiosonde estimates in March (MBE = −162.3 J kg-1). Still, the bias reverses sign and becomes positive in April (MBE = +155.9 J kg-1) and strengthens further in May (MBE = +530.8 J kg-1). In contrast, Kolkata exhibits a consistent positive bias throughout the season, with ERA5 overestimating CAPE by +103.2 J kg-1 in March, +344.6 J kg-1 in April, and +540.6 J kg-1 in May. The most substantial positive departures occur at Ranchi, where ERA5 overestimation increases sharply from +130.7 J kg-1 in March to +497.3 J kg-1 in April and peaks at +1076.6 J kg-1 in May. The error magnitudes also increase toward the late pre-monsoon period, especially for CAPE. For instance, RMSE reaches 1389.6 J kg-1 (Bhubaneswar, May), 1379.3 J kg-1 (Kolkata, May), and 1699.8 J kg-1 (Ranchi, May) at 00:00 UTC. Across all stations, CAPE correlations are near zero (≈ −0.05 to 0.10), indicating that ERA5 does not reliably reproduce day-to-day CAPE variability during this season.
3.1.2 CAPE bias characteristics for 12:00 UTC
At 12:00 UTC, ERA5 CAPE biases are generally larger in magnitude than at 00:00 UTC, with pronounced positive departures during April-May at Bhubaneswar and Kolkata. Over Bhubaneswar, ERA5 is slightly negatively biased in March (MBE = −125.7 J kg-1) but shifts to substantial overestimation in April (MBE = +430.7 J kg-1) and May (MBE = +959.2 J kg-1). A similar seasonal transition is observed at Kolkata, where the bias is near neutral in March (MBE = −15.3 J kg-1) but becomes strongly positive in April (MBE = +265.7 J kg-1) and peaks in May (MBE = +1012 J kg-1). In contrast, Ranchi shows negative biases in March (MBE = −24.3 J kg-1) and April (MBE = −80.56 J kg-1), followed by a sign reversal to a positive bias in May (MBE = +207.9 J kg-1). Consistent with these patterns, the most significant CAPE errors occur at 12:00 UTC, with RMSE reaching 1847 J kg-1 at Bhubaneswar (May) and Kolkata (May), and 1499.9 J kg-1 at Ranchi (May), confirming that ERA5 instability representation is most uncertain during the daytime sounding window. Moreover, the two-sample t-test results (Fig. 4) show that ERA5 and radiosonde CAPE distributions differ significantly for most station-month combinations at the 1 and/or 5% levels, indicating that these discrepancies are systematic rather than attributable to sampling variability.
3.1.3 CIN bias characteristics for 00:00 UTC
At 00:00 UTC, ERA5 exhibits a consistent overestimation of CIN relative to radiosonde observations at all three stations throughout March-May, as indicated by positive MBE values in every case. Over Bhubaneswar, CIN is overestimated by +14.2 J kg-1 in March, increasing to +33.8 J kg-1 in April and +44.1 J kg-1 in May. Kolkata also shows persistent CIN overestimation, with MBE values of +26.0 J kg-1 in March, +17.7 J kg-1 in April, and +13.52 J kg-1 in May. The strongest excessive inhibition is evident at Ranchi, where ERA5 overestimates CIN by +33.8 J kg-1 in March, rising sharply to +91.6 J kg-1 in April and remaining high in May (+86.5 J kg-1), highlighting larger inland departures. Consistent with this, CIN RMSE reaches as high as 190.7 J kg-1 at Ranchi in April, reinforcing that CIN errors are more pronounced inland at 00:00 UTC. Similar to CAPE, CIN correlations are weak (near zero, occasionally slightly negative), indicating that ERA5 does not reliably reproduce the day-to-day variability of observed inhibition during the pre-monsoon season.
3.1.4 CIN bias characteristics for 12:00 UTC
At 12:00 UTC, CIN biases are generally smaller in magnitude than the corresponding CAPE biases; yet, they still exhibit systematic station- and month-dependent behavior. Over Bhubaneswar, ERA5 consistently overestimates CIN, with MBE values of +13.2 J kg-1 in March and +9.9 J kg-1 in April, increasing markedly to +44.5 J kg-1 in May. Kolkata shows a sign change, with ERA5 underestimating CIN in March (MBE = −13.5 J kg-1) but shifting to overestimation in April (MBE = +13.5 J kg-1) and May (MBE = +16.3 J kg-1). Ranchi maintains positive biases throughout the season, with MBE values of +8.1 J kg-1 in March, +23.7 J kg-1 in April, and +19.4 J kg-1 in May. Consistent with these comparatively more minor biases, CIN RMSE values at 12:00 UTC remain modest overall (typically ~70.2-120 J kg-1 across stations and months). However, correlations remain weak, indicating limited ability to capture day-to-day CIN variability. The two-sample t-test results (Fig. 4) further indicate that ERA5-radiosonde CIN differences are statistically significant in many station-month combinations. However, the significance level and strength vary across locations and months.
These findings indicate that ERA5 data exhibit altered buoyancy, leading to an overestimation of CAPE values over Bhubaneswar, Kolkata, and Ranchi at 00:00 UTC. Conversely, the data show decreased buoyancy and underestimation of CAPE values specifically for March. At the same time, the overestimation of CIN represents the suppression of convection. Although CAPE may be underestimated and CIN overestimated, as seen with the 12:00 UTC profiles for Kolkata (which suggests changed convection magnitude in the reanalysis datasets), the relationship between CAPE, CIN, and the resultant convective activity is complex; thus, some convective activity could still occur. However, for CAPE, at all three sites, 12:00 UTC values have higher biases, as evident by RMSE, MAE, MBE, and r. The CIN values, however, show slightly higher biases at 00:00 UTC for all three sites, as shown in Table I. Both CAPE and CIN utilize temperature and humidity profiles, and biases in these variables can significantly impact the estimation of these variables in ERA5 data (Varga and Breuer, 2022).
Table I Station-wise metrics (MBE, MAE, RMSE, correlation) of CAPE and CIN at 00:00 and 12:00 UTC for Bhubaneswar, Kolkata, and Ranchi.
| CAPE (J kg-1) | CIN (J kg-1) | ||||||||||||
| 00:00 UTC | 12:00 UTC | 00:00 UTC | 12:00 UTC | ||||||||||
| Mar | Apr | May | Mar | Apr | May | Mar | Apr | May | Mar | Apr | May | ||
| Bhubaneswar | MBE | -162.3 | 155.9 | 530.8 | -125.7 | 430.7 | 959.2 | 14.2 | 33.8 | 44.1 | 13.2 | 9.9 | 44.5 |
| MAE | 649.3 | 922 | 1141.8 | 683.8 | 1257.3 | 1551.9 | 117 | 130 | 119.9 | 88.1 | 108.7 | 93.88 | |
| RMSE | 920.9 | 1194.1 | 1389.6 | 934.4 | 1545.2 | 1847 | 150.9 | 159.2 | 147.6 | 120 | 134.6 | 118 | |
| Corr | -0.004 | 0.1 | -0.004 | 0.09 | 0.0118 | -0.004 | 0.09 | -0.007 | 0.008 | -0.05 | -0.02 | 0.02 | |
| Kolkata | MBE | 103.2 | 344.6 | 540.6 | -15.3 | 265.7 | 1012 | 26 | 17.7 | 13.52 | -13.5 | 13.5 | 16.3 |
| MAE | 479.9 | 914.3 | 1105.8 | 684.2 | 1332.8 | 1519.7 | 112.4 | 127.1 | 102.6 | 68.3 | 76.6 | 68.5 | |
| RMSE | 719.4 | 1160.3 | 1379.3 | 975.9 | 1664 | 1847 | 146.3 | 159.6 | 128.8 | 94 | 96.3 | 87.3 | |
| Corr | 0.06 | 0.06 | -0.005 | 0.009 | 0.01 | 0.05 | -0.01 | -0.04 | 0.04 | -0.06 | -0.02 | 0.1 | |
| Ranchi | MBE | 130.7 | 497.3 | 1076.6 | -24.3 | -80.56 | 207.9 | 33.8 | 91.6 | 86.5 | 8.1 | 23.7 | 19.4 |
| MAE | 228.5 | 623.2 | 1278.8 | 307.9 | 408.2 | 845.8 | 86.6 | 139.7 | 142.2 | 47.8 | 61.1 | 72.6 | |
| RMSE | 453.3 | 984.3 | 1699.8 | 473 | 617.1 | 1499.9 | 136.1 | 190.7 | 176.5 | 70.2 | 90.8 | 91.1 | |
| Corr | -0.02 | -0.05 | 0.03 | 0.08 | -0.033 | 0.03 | 0.03 | 0.03 | -0.007 | 0.01 | 0.0006 | -0.005 | |
3.2 Analyzing temperature and relative humidity profile errors from ERA5 and radiosonde values to understand their impact on CAPE/CIN biases
To diagnose the source of the CAPE and CIN biases, we evaluated ERA5 performance against radiosonde (RS) temperature and relative humidity (RH) profiles (Table II). It was observed that although the ERA5 temperature profiles are close to the observations, the humidity profiles exhibit a considerable deviation (Figs. 5, 6, and 7). Overall, ERA5 reproduces temperature profiles well at all stations, with very high correlations (r ≈ 0.99) at Bhubaneswar and Kolkata for both 00:00 and 12:00 UTC, and similarly strong agreement at Ranchi (r = 0.99 at 00:00 UTC and r = 0.97 at 12:00 UTC). Consistent with this, temperature errors are small, with MAE ≤ 0.88 ºC at Bhubaneswar and ≤ 0.68 ºC at Kolkata, although errors increase inland at Ranchi, reaching 2.55 ºC at 12:00 UTC. In contrast, ERA5 RH skill is substantially weaker, particularly at Ranchi, where correlations are very low (r = 0.16 at both 00:00 and 12:00 UTC) and errors are large (RMSE = 28.75% at 00:00 UTC and 19.93% at 12:00 UTC). Bhubaneswar also shows degraded daytime RH agreement (r = 0.27 at 12:00 UTC) with a large RH RMSE of 22.8%, consistent with the significant daytime CAPE RMSE at this station. Kolkata exhibits the best RH representation, with correlation (r) values of 0.86 at 00:00 UTC and 0.77 at 12:00 UTC, and comparatively moderate RH errors (RMSE ~9-10%). Collectively, these results indicate that the ERA5 instability biases over eastern India are primarily linked to moisture-profile (RH) errors rather than temperature errors, with the strongest degradation evident at the inland station Ranchi.
Table II ERA5-RS skill scores (MAE, RMSE, bias, and Pearson correlation) for temperature (Temp) and relative humidity (RH) at 00:00 and 12:00 UTC.
| Station | Metric | Temp at 00:00 UTC (ºC) | Temp at 12:00 UTC (ºC) | RH at 00:00 UTC (%) | RH at 12:00 UTC (%) |
| Bhubaneswar | MAE | 0.49 | 0.88 | 8.93 | 10.6 |
| RMSE | 0.7 | 1.2 | 13.3 | 22.8 | |
| Bias | -0.3 | -0.3 | 2.3 | -6.4 | |
| Corr | 0.99 | 0.99 | 0.75 | 0.27 | |
| Kolkata | MAE | 0.53 | 0.68 | 6.91 | 6.54 |
| RMSE | 0.67 | 0.81 | 9.92 | 9.23 | |
| Bias | -0.1 | -0.1 | 3.76 | 2.32 | |
| Corr | 0.99 | 0.99 | 0.86 | 0.77 | |
| Ranchi | MAE | 0.72 | 2.55 | 14.38 | 11.08 |
| RMSE | 1.39 | 7.26 | 28.75 | 19.93 | |
| Bias | 0.13 | 1.32 | -4.01 | -9.06 | |
| Corr | 0.99 | 0.97 | 0.16 | 0.16 |
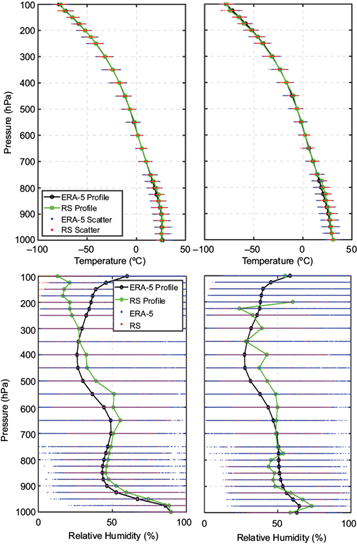
Fig. 5 Vertical profiles of temperature (first row) and relative humidity (second row) for Bhubaneswar. The first column represents 00:00 UTC, while the second column represents 12:00 UTC. Green and black lines indicate averaged values for radiosonde and ERA-5 data for each level and the blue and red dots indicates the profile daily data values.
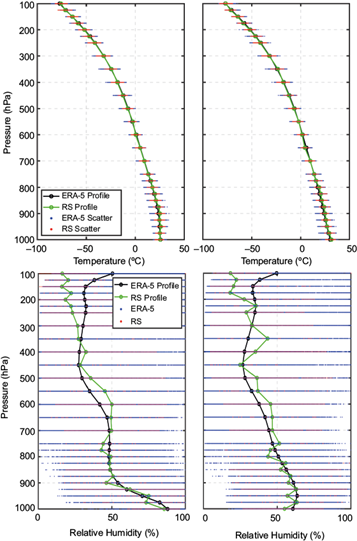
Fig. 6 Vertical profiles of temperature (first row) and relative humidity (second row) for Kolkata. The first column represents 00:00 UTC, while the second column represents 12:00 UTC. Green and black lines indicate averaged values for radiosonde and ERA-5 data for each level and the blue and red dots indicates the profile daily data values.
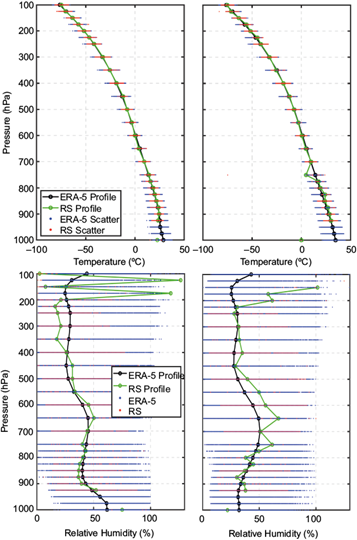
Fig. 7 Vertical profiles of temperature (first row) and relative humidity (second row) for Ranchi. The first column represents 00:00 UTC, while the second column represents 12:00 UTC. Green and black lines indicate averaged values for radiosonde and ERA-5 data for each level and the blue and red dots indicates the profile daily data values.
CAPE biases may also be associated with errors in the representation of boundary-layer height, low-level moisture content, or the temperature change with height (Celiński-Mysław et al., 2020). Another probable cause may be a change in surface elevation in the ECMWF model, which may produce bias in estimating CAPE and CIN over eastern India. Pučik et al. (2017) reported that the model simulates simple convective parameters better, which does not require integration across levels, unlike CAPE and CIN, which might explain the bias in ERA5. Taszarek et al. (2021) reported that ERA5 underestimates the lifting condensation level (LCL), overestimates the level of free convection (LFC), and underestimates the equilibrium level (EL), leading to overestimates of CIN and underestimates of CAPE compared to soundings over Europe and North America. Bias in estimating CAPE and CIN can also be due to data assimilation, boundary layer, and convective parameterizations (Taszarek et al., 2020b). CAPE underestimation/overestimation indicates the reduced/enhanced buoyancy of the air parcel.
The overestimation of CAPE indicates that the model outputs incorporated into the ERA5 data overestimate buoyant conditions during the night/early-morning hours at these tropical stations. CIN overestimation indicates excessive inhibition or negative buoyancy defined by the ERA5 datasets, which may limit or prevent convective activity development. There may be many factors responsible for these over- and underestimations of CAPE and CIN, and one reason is the deviation of the ERA5 temperature and RH profiles from the radiosonde. When it comes to terrain elevation, Ranchi is located higher than the coast compared to Kolkata and Bhubaneswar, and the gridded elevation used in reanalyses means the effective model “station elevation” can differ from the radiosonde launch elevation. For sites where the station elevation differs substantially from the ERA5 grid-box mean, near-surface temperature and moisture are biased, which in turn leads to MLCAPE differences. Also, the proximity of Bhubaneswar and Kolkata to the Bay of Bengal may produce more homogeneous low-level moisture (sea-breeze influenced, relatively consistent surface humidity) at the scale resolved by ERA5, so the reanalysis better represents the sounding. In contrast, inland stations such as Ranchi (the latter located in a complex deltaic/urban plain) may experience sharper local moisture gradients, land-sea contrasts, or urban effects that are under-resolved by the reanalysis, resulting in larger biases in low-level RH and MLCAPE.
4. Conclusions
The present study compared CAPE and CIN values from ERA5 and radiosonde observations (00:00 and 12:00 UTC) for the pre-monsoon season over eastern India. The results indicate that the uncertainties associated with ERA5 CAPE and CIN are significant over eastern India. The biases associated with CAPE and CIN differ between 00:00 and 12:00 UTC, and variability also varies across sites. The findings can be summarized as:
At 00:00 UTC, the CAPE bias shows strong spatial and seasonal dependence, with Bhubaneswar shifting from a negative bias in March (MBE = −162.3 J kg-1) to positive biases in April (+155.9 J kg-1) and May (+530.8 J kg-1), while Kolkata remains consistently positively biased throughout March-May (+103.2, +344.6, +540.6 J kg-1), and Ranchi exhibits the largest positive departures, intensifying sharply toward May (+130.7, +497.3, +1076.6 J kg-1).
At 12:00 UTC, CAPE errors are generally larger, with Bhubaneswar showing −125.7 J kg-1 in March followed by strong overestimation in April (+430.7 J kg-1) and May (+959.2 J kg-1), Kolkata similarly shifting from near-neutral in March (−15.3 J kg-1) to large positive biases in April (+265.7 J kg-1) and May (+1012 J kg-1), and Ranchi remaining negatively biased in March (−24.3 J kg-1) and April (−80.56 J kg-1) before turning positive in May (+207.9 J kg-1); correspondingly, CAPE errors peak at 12:00 UTC with RMSE reaching 1847 J kg-1 in May at both Bhubaneswar and Kolkata.
For CIN, ERA5 overestimates inhibition at 00:00 UTC for all stations and months (e.g., Bhubaneswar: +14.2 to +44.1 J kg-1, Kolkata: +13.52 to +26.0 J kg-1, and Ranchi: +33.8 to +91.6 J kg-1), while at 12:00 UTC, CIN is generally slightly overestimated at Bhubaneswar and Ranchi. Kolkata shows a sign change from underestimation in March (−13.5 J kg-1) to overestimation in April-May.
Across both CAPE and CIN, correlations are consistently near zero, indicating weak temporal agreement and poor reproduction of day-to-day variability. Thermodynamic-profile evaluation (Table II) further indicates that temperature is well represented (r ≈ 0.99 at most stations; 0.97 at Ranchi at 12:00 UTC with small MAE), whereas RH is the dominant limitation-most notably at Ranchi where RH correlation is only 0.16 at both 00:00 and 12:00 UTC and RMSE reaches 28.75%-consistent with the largest inland CAPE/CIN errors.
Overall, these findings suggest that using ERA5 CAPE/CIN directly for instability thresholds or convective-environment classification over eastern India, particularly for station-scale applications and daytime diagnostics, may introduce systematic and statistically significant biases. Therefore, bias correction or explicit uncertainty quantification is recommended before downstream use.

