


 nueva página del texto (beta)
 Inglés (pdf)
 Artículo en XML
 Referencias del artículo
 Enviar artículo por email
 Citado por SciELO
  Similares en
SciELO
Similares en
SciELO 
 Permalink
1. Introduction
The interest in the analysis of precipitation in Peninsular Spain (PS) derives, on the one hand, from (1) its location at the southwestern tip of Europe, (2) its position in the transition zone between the mid-latitudes maritime climate and the subtropical (Mediterranean) climate, (3) its contrasting orography, and (4) the high variability of rainfall; on the other hand, there is significant interest due to the scarcity of water available to support extensive irrigation, intense tourism, and other economic activities. In a context of climate change, it is particularly important to understand the variability of precipitation in Spain and the Mediterranean countries, where the expected increase in both temperature and drought severity further exacerbates this problem by increasing evapotranspiration (Bellido-Jiménez et al., 2023).
Large-scale atmospheric circulation exerts a significant influence on regional weather systems, accounting for much of the precipitation variability observed in many regions of the world (Ramos et al., 2010; Irannezhad, et al., 2020; Martínez-Artigas et al., 2020; Lemus-Cánovas, 2022, among many others). In the context of climate change, it is especially interesting to understand the behavior of precipitation variability in Spain and other Mediterranean countries, where the expected increases in both temperature and the droughts severity confirm this region as a ‘hotspot’, driven by a reduction in precipitation associated with the rising atmospheric pressure (Diffenbaugh, 2007; Tuel and Eltahir, 2020; Lazoglou et al., 2024). In each region, the influence of several low-frequency variability patterns-operating at regional, continental, hemispheric, and even global scales-can be detected, such as the El Niño-Southern Oscillation (ENSO) (Feldstein and Franzke, 2017). Teleconnection patterns also affect orographic rainfall (López-Moreno et al., 2011; Stagge et al., 2023). The North Atlantic Oscillation (NAO) is the most influential low-frequency variability pattern for Europe (Hurrell, 1995; Trigo et al., 2002; Hurrell et al., 2003; Osborn, 2004; Deser et al., 2017, among others), characterized by a dipole formed by the subtropical Azores anticyclone and the subpolar Icelandic low. The positive phase of the NAO is associated with above-normal sea surface pressure and geopotential heights over the subtropical and tropical North Atlantic-extending to the eastern United States and western Europe-and below-normal pressures and geopotential heights over the high latitudes of the North Atlantic. Conversely, the negative phase exhibits the opposite pattern of height and pressure anomalies. Both phases of the NAO are linked to significant changes in the speed and trajectories of the jet stream and storm tracks, in which they alter the zonal and meridional flows of heat and water vapor, ultimately resulting in changes in precipitation patterns and temperature above the aforementioned area.
Regarding precipitation in Europe, during strong positive phases of the NAO, rainfall is above-normal over the northern part of the continent and below-normal over southern and central Europe. This pattern is particularly evident over most of the Iberian Peninsula (IP), especially in southern Spain and Portugal. An opposite pattern of precipitation anomalies is observed during strong negative phases of the NAO (Trigo et al., 2004; Hernández et al., 2020). In some cases, dry or rainy anomalies-particularly prolonged droughts-can persist for many months in the IP.
Precipitation in the eastern IP-leeward of the NAO dipole due to the orographic configuration-shows little or no correlation with the NAO index (NAOi). This observation led to the proposal of a new variability pattern to explain rainfall in the eastern IP, particularly its intense events: the Western Mediterranean Oscillation (WeMO) (Osborn, 2004; Martín-Vide and López-Bustins, 2006). Notably, the eastern IP is the European region with the largest daily precipitation concentration index and one of the highest precipitation intensities (Martín-Vide, 2004).
The WeMO dipole is formed by the subtropical extended Azores anticyclone and the Ligurian low over northern Italy. In its positive phase, the WeMO is characterized by above-normal sea surface pressures and geopotential heights over the subtropical-tropical North Atlantic, which extends as a ridge toward the IP, and below-normal pressure and geopotential heights over northern Italy. In contrast, the negative phase exhibits the opposite pressure anomalies, with a low centered near the Gulf of Cadiz to the SW of the IP and an anticyclone over central Europe. Both phases of the WeMO yield markedly different precipitation patterns in eastern IP. During the positive phase of the WeMOi (WeMO index), anticyclonic stability combined with terrestrial winds on the eastern façade of the IP results in a very low probability of precipitation. Conversely, during the negative phase, easterly, Mediterranean and humid winds can trigger rainfall. This effect may be particularly significant if the low of the Gulf of Cadiz induces a divergence in height over the eastern Iberian coast.
The complex orography of the IP, with an altitude range exceeding 3400 m and spanning nearly 900 km from north to south, encompasses a transition from the maritime mid-latitudes climate in the northern fringe to the predominantly Mediterranean climate in the rest of the territory. Its geographical position between two major bodies, the Atlantic and the Mediterranean Sea, further contributes to significant spatial precipitation variability (Cortesi et al., 2014). The high spatial resolution MOPREDAS precipitation database (10 × 10 km), covering the 100-year period from December 1915 to November 2015 on a monthly scale, along with its recent extension to December 2020 (Beguería et al., 2023; Gonzalez-Hidalgo et al., 2023), provides a valuable resource for capturing the pronounced rainfall variability across the IP and assessing the varying influence of the two mentioned low-frequency variability patterns. Therefore, the objectives of this article are threefold: (1) to assess the geographical patterns of the correlation between low-frequency variability patterns (NAOi and WeMOi) and monthly and annual precipitation at the highest possible spatial scale across PS over a one-century period and several sub-periods; (2) to compare the spatial correlation patterns of these two low-frequency variability patterns with precipitation in December, the month most strongly influenced by them; and (3) to relate the above mentioned spatial patterns to different pluviometric variables, including the coefficient of variation, seasonality, and the concentration index.
The motivation behind the study is that a result has climatic significance when there is (1) a physical basis (in our case, the teleconnection patterns); (2) statistical accuracy (in our case, the standard procedure of linear correlations between variables), and, finally, (3) geographical consistency. This last point is what the article emphasizes.
The expected results must show spatial coherence, that is, they must be explainable by geographical factors, such as latitude, proximity to the Mediterranean and Cantabrian seas, the Atlantic Ocean, coastal orientation, etc. Additionally, we have analyzed the best-resolution database, covering a century-long period, which has never been used for this purpose before. This improves the existing basic knowledge from a geographical point of view.
2. Data and methods
The main precipitation database used in this study is the recently updated MOPREDAS_century database (MOnthly PREcipitation DAtabase of Spain) (Beguería et al., 2023). This gridded dataset integrates digital records from the Spanish Meteorological Agency (AEMET) with newly digitized data from climate yearbooks published between 1916 and 1950 by Spain’s former national meteorological services. Monthly precipitation grids were generated using universal kriging in a two-step process: (1) interpolation of the probability of zero precipitation, and (2) estimation of the precipitation magnitude. For this purpose, observed monthly precipitation values were normalized using their ratios relative to the 1961-2000 mean, which were used as the dependent variables in the interpolation process. To rescale the data to a common scale, altitude and monthly mean precipitation climatology were used as independent variables. The grid was calculated to maximize the original information while achieving the highest possible spatial density. Further details and information on the dataset construction and methodology can be found in Gonzalez-Hidalgo et al. (2023). The grid resolution is provided at a 10 × 10 km spatial resolution.
The NAOi values were obtained from the Climatic Research Unit (University of East Anglia) (Jones et al., 1997), while the WeMOi values come from the same source (Martín-Vide and López-Bustins, 2006). In this case, the dipole’s reference observatories are San Fernando, in the SW of PS, and Padova, in northern Italy, both of which have long, high-quality atmospheric pressure records.
The methods used include the well-known linear correlations (Pearson’s R) and isopleth maps, along with a comparative visual analysis of the different maps (Schmidt et al., 2013). The monthly precipitation values of each pixel were previously normalized by subtracting the mean and dividing by the standard deviation of each pixel. P-values lower than 0.05 (corresponding to a confidence level of 95%) were used to determine statistically significant correlations. For 100 pairs (monthly teleconnection index vs. monthly precipitation, corresponding to the period December 1915-November 2015), the critical values of Pearson’s R to achieve significance are ≥ 0.20 or ≤ -0.20.
Complementarily, the analysis was repeated for three subperiods of similar length, 30 and 35 years: 1915-1945, 1946-1980, and 1981-2015, covering the entire 100-year period. This approach enabled the identification of changes in spatial patterns over time. In addition, the two correlation patterns for December were compared. December was chosen because previous research has shown that this month is when both teleconnection patterns exert the highest influence on precipitation over the IP.
For all calculations and graphics, the free software R was used (R Core Team, 2018). Graphics were generated using isopleths in a grid format.
Additionally, the resulting spatial correlation patterns were compared with those of the daily concentration Index (CI), the consecutive disparity index (D), the interannual coefficient of variation (CV), the mean duration of dry spells, and precipitation seasonality. The CI represents the contribution of the rainiest days to the annual total (Martín-Vide, 2004; Cortesi et al., 2012); it is high when a few days account for most of the annual total and low when precipitation is more evenly distributed throughout the year. The CI is calculated on a daily resolution. For PS, CI values were computed using data from 32 meteorological stations for the period 1951-1990 (Martín-Vide, 2004), which adequately cover the territory.
The D index is defined as shown in Eq. (1) (Martín-Vide et al., 2022):
Where p
i
is the value at position i and N is the
series length,
The CV, widely known in climate series, is defined as follows:
that is, the quotient between the standard deviation (sd) and the mean (m) of the series. Here, the CV is expressed as a percentage. In this paper, the CV values used are taken from Martín-Vide (2022).
The mean dry spell duration requires daily precipitation data. It is defined as the average duration of all dry spells, including isolated dry days (Martín-Vide and Gómez, 1999; Lana et al., 2008). In this paper, the mean dry spell duration values used are also taken from Martín-Vide (2022).
Finally, precipitation seasonality is determined by ordering mean seasonal precipitation from highest to lowest (de Luis et al., 2010; Gonzalez-Hidalgo et al., 2024). The maps used in the present paper are sourced from Gonzalez-Hidalgo et al. (2024).
3. Results
3.1. The correlation between NAOi and precipitation (1915-2015)
The correlation between NAOi and precipitation in PS is negative and notably strong, being statistically significant across almost all the IP in January, February, March, April, May, September, and December (Table I and Fig. 1). On the contrary, in June, July, and August, the correlation is not statistically significant in a large part of the study area. In some parts of the PS, the minimum isopleth (maximum negative R value) reaches -0.6 or less in January, February, March, October, and December. In December, the correlation reaches -0.70. In January and May, the entire study area shows a statistically significant correlation, even at a 99.9% confidence level (R < -0.33).
Table I Minimum isopleth (IsoMin), maximum isopleth (IsoMax), spatial pattern, and range of the Pearson’s R values between NAOi and monthly precipitation in Peninsular Spain for the period 1915-2015.
| NAOi/Precipitation | 1915-2015 | |||
| IsoMin | IsoMax | Pattern | Range | |
| January | -0.65 | -0.35 | SW diagonal | 0.3 |
| February | -0.6 | -0.2 | SW center | 0.4 |
| March | -0.65 | -0.2 | SW meridional | 0.45 |
| April | -0.4 | -0.2 | SW center | 0.2 |
| May | -0.55 | -0.35 | N | 0.2 |
| June | -0.35 | -0.1 | NW | 0.25 |
| July | -0.25 | 0.05 | NW | 0.3 |
| August | -0.25 | 0.05 | SW | 0.3 |
| September | -0.4 | -0.2 | SW | 0.2 |
| October | -0.6 | -0.05 | SW meridional | 0.55 |
| November | -0.5 | -0.15 | SW | 0.35 |
| December | -0.7 | -0.25 | SW diagonal | 0.45 |
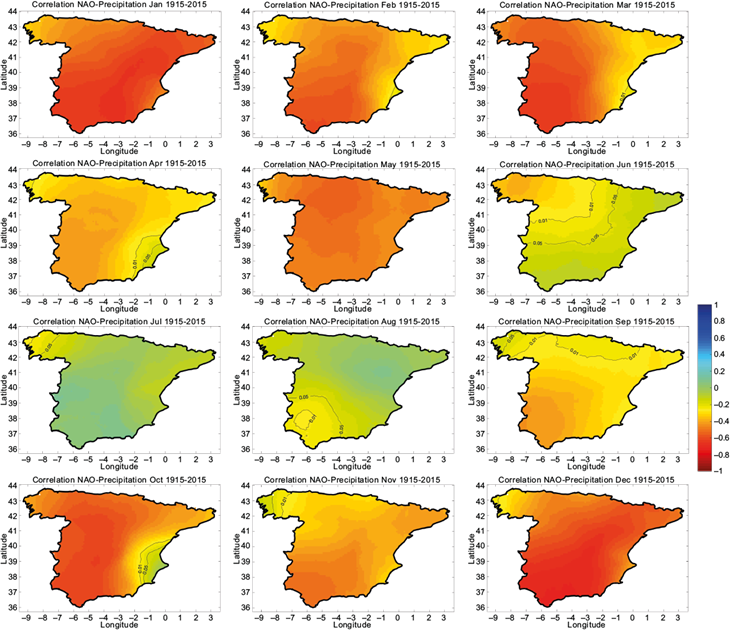
Fig. 1 Monthly maps of isopleths of the Pearson’s R values between NAOi and precipitation in Peninsular Spain for the period 1915-2015. Black contour lines indicate statistical significance thresholds: p = 0.01 (99% confidence), and p = 0.05 (95% confidence). The 0.05 threshold corresponds to R = 0.20/-0.20.
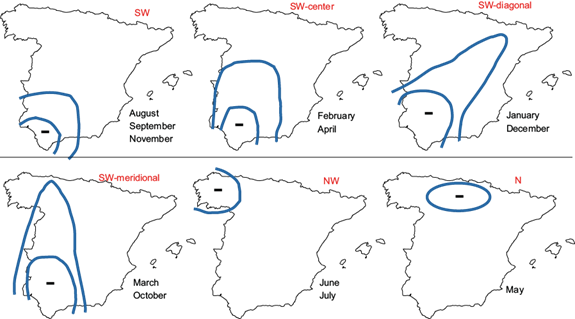
Regarding the spatial patterns of the isopleths, three dominant patterns can be identified, as previously recognized in a study using a limited number of meteorological stations (Martín-Vide et al., 1999): the so-called SW pattern, observed in August, September, and November; the SW-center pattern, present in February and April; and the SW-diagonal pattern, occurring in January and December (Fig. 2, above). These three patterns, which can be considered variations of a single SW to NE gradient, effectively explain the effect of the NAO on precipitation in the IP. They exhibit clearly negative correlations with rainfall in the southwestern quadrant, which can extend toward the center of the IP during the cold half of the year and, sometimes, elongate diagonally toward the NE. In addition to these three predominant models, three other patterns have been identified: a SW meridian pattern in March and October; a NW pattern in June and July; and an N pattern in May (Fig. 2, below). As it can be observed, the latter two are exclusive to warm months, when the NAO dipole reaches its lowest gradient and exerts minimal influence over the IP (Folland et al., 2009).
3.2. The correlation between NAOi and precipitation in three temporal sub-periods
Table II contains the same information as Table I, but for the three analyzed sub-periods: 1915-1945, 1946-1980, and 1981-2015. The main results are as follows: (1) the months showing the strongest negative correlations (winter months and some spring months), and those with the weakest or not-statistically significant correlations (summer months) tend to remain consistent across periods; (2) the spatial patterns of the correlation may vary for each month depending on the sub-period considered, and they may differ from those observed for the entire period; (3) new patterns appear, either similar to some of those previously mentioned or without a clear meteorological relevance; (4) the most frequently observed patterns are NW in the summer months and SW and SW-diagonal; (5) in the most recent sub-period (1981-2015), the strongest negative correlation reaches its lowest value of -0.80, in December. This result could be linked to the strong positive phase of the NAO during the 1990s (Hurrell and Deser, 2010).
Table II Minimum isopleth (IsoMin), maximum isopleth (IsoMax), spatial pattern, and range of Pearson’s R values between NAOi and precipitation in Peninsular Spain during three sub-periods.
| NAOi/Precipitation | 1915-1945 | |||
| IsoMin | IsoMax | Pattern | Range | |
| January | -0.7 | -0.4 | Center-E | 0.3 |
| February | -0.5 | -0.1 | S | 0.4 |
| March | -0.65 | -0.15 | SW center | 0.5 |
| April | -0.4 | -0.1 | S | 0.3 |
| May | -0.65 | -0.3 | W | 0.35 |
| June | -0.35 | 0.05 | NW | 0.4 |
| July | -0.35 | 0.15 | NW | 0.5 |
| August | -0.3 | 0.1 | NW | 0.4 |
| September | -0.35 | -0.2 | SW | 0.15 |
| October | -0.75 | -0.2 | SW diagonal | 0.55 |
| November | -0.6 | 0.05 | SW | 0.65 |
| December | -0.65 | -0.15 | NE diagonal | 0.5 |
| NAOi/Precipitation | 1946-1980 | |||
| IsoMin | IsoMax | Pattern | Range | |
| January | -0.65 | -0.3 | SE | 0.35 |
| February | -0.65 | 0 | SW diagonal | 0.65 |
| March | -0.65 | -0.25 | S | 0.4 |
| April | -0.55 | -0.2 | SW meridional | 0.35 |
| May | -0.5 | -0.3 | SE meridional | 0.2 |
| June | -0.6 | -0.05 | N | 0.55 |
| July | -0.25 | 0.15 | Zonal isopleths | 0.4 |
| August | -0.35 | 0.05 | SW | 0.4 |
| Septembre | -0.5 | -0.15 | W diagonal | 0.35 |
| October | -0.6 | -0.15 | S meridional | 0.45 |
| November | -0.6 | -0.25 | S diagonal | 0.35 |
| December | -0.7 | -0.15 | SW diagonal | 0.55 |
| NAOi/Precipitation | 1981-2015 | |||
| IsoMin | IsoMax | Pattern | Range | |
| January | -0.75 | -0.3 | SW diagonal | 0.45 |
| February | -0.6 | -0.3 | SW meridional | 0.3 |
| March | -0.7 | 0 | W | 0.7 |
| April | -0.55 | -0.1 | Center W | 0.45 |
| May | -0.65 | -0.35 | N | 0.3 |
| June | -0.5 | -0.15 | NW | 0.35 |
| July | -0.25 | 0.15 | NW | 0.4 |
| August | -0.4 | 0.25 | SW | 0.65 |
| Septembre | -0.45 | -0.2 | SW center | 0.25 |
| October | -0.6 | 0.05 | N meridional | 0.65 |
| November | -0.5 | -0.25 | SW center | 0.25 |
| December | -0.8 | -0.4 | SW diagonal | 0.4 |
3.3. The correlation between WeMOi and precipitation (1915-2015)
The correlation between WeMOi and precipitation in the IP is negative and statistically significant across a large part of the east, center, and south of the IP, while it is weakly positive in the north in all months except June, July, and August. From December to March, it draws a characteristic two-pole pattern (Table III and Fig. 3). In June, July, and August, there is no significant correlation in most of the study area. However, in some parts of eastern and southeastern IP, the minimum isopleth (maximum negative R value) achieves -0.5 or -0.55 from September to February, making the correlation statistically significant even at a 99.9% confidence level (R < -0.33).
Table III Minimum isopleth (IsoMin), maximum isopleth (IsoMax), spatial pattern, and range of the Pearson’s R values between the WeMOi and precipitation in Peninsular Spain for the period 1915-2015.
| WeMOi/Precipitation | 1915-2015 | |||
| IsoMin | IsoMax | Pattern | Range | |
| January | -0.5 | 0.3 | E/SE two-pole | 0.8 |
| February | -0.55 | 0.35 | E two-pole | 0.9 |
| March | -0.45 | 0.3 | E two-pole | 0.75 |
| April | -0.45 | 0.2 | Center-E | 0.65 |
| May | -0.35 | 0 | SE-S | 0.35 |
| June | 0 | 0.3 | SW | 0.3 |
| July | -0.15 | 0.2 | Center | 0.35 |
| August | -0.2 | 0.3 | SW | 0.5 |
| September | -0.55 | 0.15 | SE | 0.7 |
| October | -0.5 | 0.15 | SW two-pole | 0.65 |
| November | -0.55 | 0.15 | E | 0.7 |
| December | -0.55 | 0.3 | E two-pole | 0.85 |
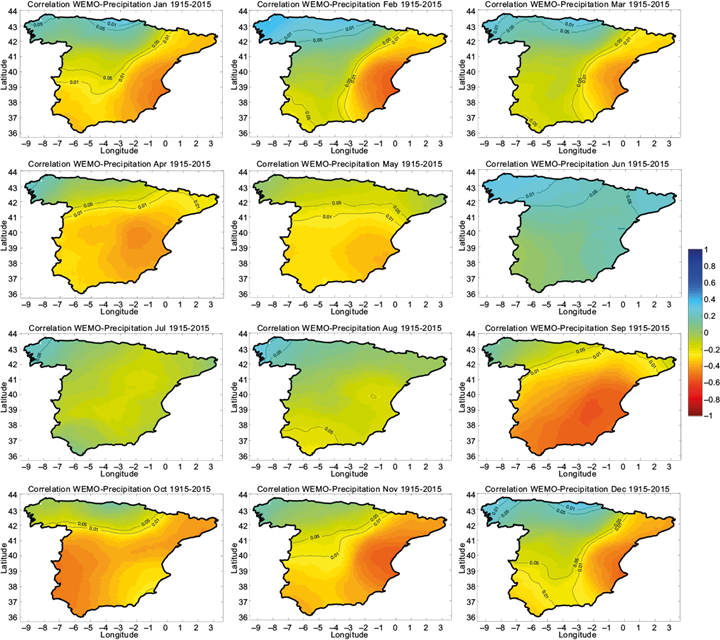
Fig. 3 Monthly maps of isopleths of Pearson’s R values between WeMOi and precipitation in Peninsular Spain for the period 1915-2015. Black contour lines indicate statistical significance thresholds: p = 0.01 (99% confidence), and p = 0.05 (95% confidence). The 0.05 threshold corresponds to R = 0.20/-0.20.
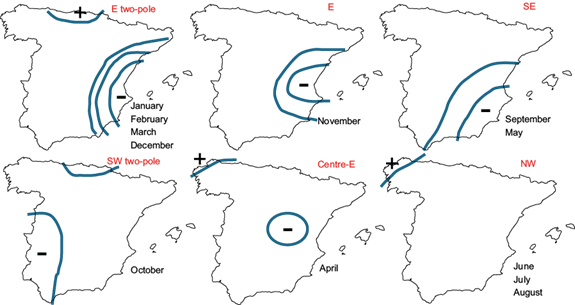
Regarding the spatial patterns of the isopleths, a characteristic two-pole pattern between the east-southeast and the north, especially in its eastern part, dominates during the winter months and March. In addition, excluding the summer months, other patterns emerge, showing maximum negative correlations in the SE, E, and central regions, and with an additional two pole pattern in the SW observed in October.
The correlation between WeMOi and precipitation is statistically significant in the winter and autumn months in the eastern part of the IP, where, as previously stated, NAO has shown little influence (Fig. 4).
3.4. The correlation between WeMOi and precipitation in the three sub-periods
Table IV summarizes the same information as Table III but for the subperiods 1915-1945, 1946-1980, and 1981-2015. The main results are: (1) the spatial correlation patterns remain consistent from November to March across the three subperiods, showing an E two-pole and E pattern, or similar, as observed in the complete period; (2) in the period 1981-2015, there has been an increase (less negative values) in the minimum isopleth for June, August, September, and October. Conversely, in February, April, May, and June, the minimum isopleth is significantly more negative in the second period than in the others. The most negative isopleth value is -0.75 in September and December during the first subperiod; (3) new patterns appear, some resembling those previously identified, while others lack specific meteorological relevance.
Table IV Minimum isopleth (IsoMin), maximum isopleth (IsoMax), spatial pattern, and range of the Pearson’s R values between WeMOi and precipitation in Peninsular Spain for the three sub-periods.
| 1915-1945 | ||||
| IsoMin | IsoMax | Pattern | Range | |
| January | -0.4 | 0.35 | E/SE dipole | 0.75 |
| February | -0.5 | 0.6 (Galicia) | E | 1.1 |
| March | -0.5 | 0.55 | E dipole | 1.05 |
| April | -0.35 | 0.3 | SW | 0.65 |
| May | -0.4 | 0.2 | Center-SE | 0.6 |
| June | -0.15 | (Catalonia) | SW | 0.55 |
| July | -0.4 | 0.45 | Center-E | 0.85 |
| August | -0.4 | 0.2 | Center-E | 0.6 |
| Septembre | -0.75 | 0.1 | S diagonal | 0.85 |
| October | -0.7 | 0 | W-center dipole | 0.7 |
| November | -0.55 | 0.15 | E | 0.7 |
| December | -0.75 | 0.15 | E | 0.9 |
| 1946-1980 | ||||
| IsoMin | IsoMax | Pattern | Range | |
| January | -0.4 | 0.3 | E/SE dipole | 0.7 |
| February | -0.7 | 0.2 | E dipole | 0.9 |
| March | -0.45 | 0.25 | E/SE | 0.7 |
| April | -0.7 | 0 | S-center | 0.7 |
| May | -0.55 | -0.05 | S-center | 0.5 |
| June | -0.45 | 0.35 | SE | 0.8 |
| July | -0.3 | (Catalonia) | W | 0.6 |
| August | -0.35 | 0.4 | E | 0.75 |
| Septembre | -0.6 | 0.1 | Center-E | 0.7 |
| October | -0.65 | 0.15 | NE dipole | 0.8 |
| November | -0.5 | 0.25 | E | 0.75 |
| December | -0.45 | 0.45 | E/NE dipole | 0.9 |
| 1981-2015 | ||||
| IsoMin | IsoMax | Pattern | Range | |
| January | -0.55 | 0.35 | E-SE dipole | 0.9 |
| February | -0.5 | 0.25 | E dipole | 0.75 |
| March | -0.55 | 0.2 | NE-E-SE dipole | 0.75 |
| April | -0.35 | 0.3 | SE dipole | 0.65 |
| May | -0.45 | 0.15 | SE | 0.6 |
| June | -0.05 | 0.35 | Center-E | 0.4 |
| July | -0.3 | 0.4 | SE | 0.7 |
| August | -0.25 | 0.4 | S | 0.65 |
| September | -0.55 | 0.3 | SE-S dipole | 0.85 |
| October | -0.35 | 0.2 | SW-W dipole | 0.55 |
| November | -0.6 | 0.05 | E dipole | 0.65 |
| December | -0.55 | 0.3 | E dipole | 0.85 |
4. Comparison between correlations of NAOi and WeMOi with precipitation in December
December is the month with the most characteristic and well-defined pattern for both the NAOi and the WeMOi, displaying the aforementioned SW-diagonal and bipolar-E patterns, respectively. It also shows the highest correlations in distinct zones, which consistently align with the two tele-connection dipoles. For this reason, comparing the influence of these two low-frequency variability patterns in the study area at the highest spatial resolution is particularly interesting. Figures 1 and 3 show maps of the Pearson’s R correlation between NAOi and WeMOi, and precipitation.
The spatial distribution of R values is almost opposite for the two indices: the SW diagonal pattern in the NAO is orthogonal to the E two-pole in the WeMO. Additional differences include: (1) the SW of the PS is the area with the strongest correlations with the NAOi, while the eastern façade is the most correlated with WeMOi, both negatively; (2) the two areas with the strongest correlation with the WeMOi-the eastern façade (negative) and the eastern Cantabrian fringe (positive)-correspond to those with the weakest correlation with the NAOi; (3) all correlations are negative for the NAOi, whereas the WeMOi shows both positive and negative values. In the case of the WeMO, positive and negative correlations can be clearly identified in the IP orographic systems, such as the Central System, the Cantabrian fringe, or the Betic System. The correlation sign depends on whether the influence of precipitation is Atlantic (northwest side, shown in yellow) or Mediterranean (southeast and southeastern sides, shown in dark blue).
The NAO and the WeMO produce a generally opposing influence on the study area, with exceptions. One notable exception is the southwestern area of the PS, which exhibits strong correlations with both the NAOi and the WeMOi indices. In contrast, the northwestern sector of the IP shows weak correlations with both indices.
5. Comparison between the correlation of NAO and WeMO with precipitation patterns and the patterns of selected pluviometric variables
5.1. The concentration index (CI)
The CI was first calculated for PS for the period 1951-1990 (Martín-Vide, 2004). It showed a west-east pattern, with its highest values located in a narrow fringe in the east, near the Mediterranean Sea (Fig. 5).
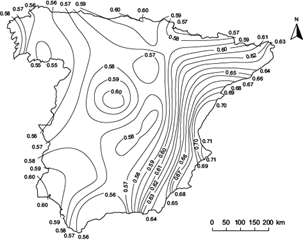
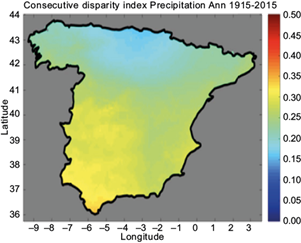
5.2. The consecutive disparity index (D)
The D index shows its highest annual values in the SW of PS and its lowest in the north, along the eastern Cantabrian coast (Fig. 6) (Martín-Vide et al., 2022).
5.3. The interannual coefficient of variation (CV) and the duration of dry spells
The CV exhibits a clear north-south pattern, with higher values at lower latitudes (Fig. 7). The duration of dry spells follows the same spatial pattern (not shown).
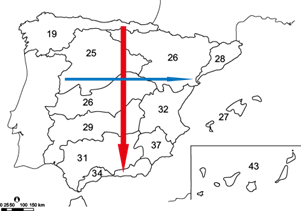
Fig. 7 Average values of the coefficient of variation (CV) of annual precipitation by river basin (Martín-Vide, 2022).
5.4. Seasonality
There is a significant variation in the seasonality of precipitation across PS. In the E, precipitation reaches its maximum in autumn (Fig. 8). In the SW, extending across the rest of the western part of PS, the precipitation maximum occurs in winter. In recent decades, the extent of the autumn maximum has expanded to many regions of the central plateau of the IP.
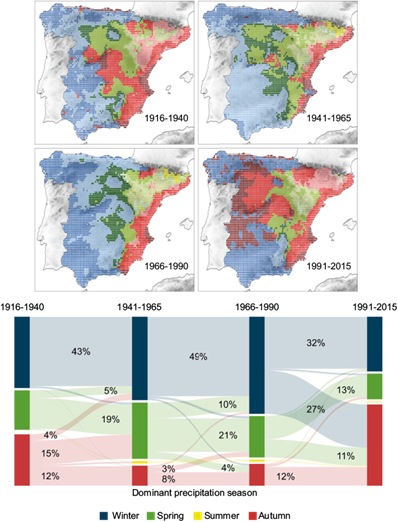
Fig. 8 Dominant precipitation season in Peninsular Spain (Gonzalez-Hidalgo et al., 2024). Colors indicate seasons: red: autumn; yellow: summer; blue: winter; green: spring.
6. Discussion and conclusions
In the European Mediterranean region, where a large part of PS is located-except for a narrow northern strip-precipitation shows high temporal variability, consistent with the Mediterranean climate. This is characterized by intense showers punctuated by long dry periods (Lionello et al., 2006). In addition, the location between two seas and two continents, along with its topographic complexity and the contrasting orientations of its relief, contributes to a high spatial variability (Martín-Vide, 2022). Using the MOPREDAS database (Beguería et al., 2023), which provides high spatial resolution and spans more than a century, it has been possible to determine the influence of two of the most important teleconnection patterns affecting PS: the NAO and WeMO.
This work presents a temporal analysis of very long, secular rainfall series at a monthly resolution, structured into three sub-periods (1915-1945, 1946-1980, and 1981-2015), along with high spatial resolution (10 × 10 km). Many studies over Spain have shown that winter months are the most influenced by the NAO (Ríos-Cornejo et al. 2015; Báez et al., 2019; Tsanis and Tapoglou, 2019; Hernández et al., 2020; Rehman et al., 2023). The results of this work confirm this pattern for both the overall period (1915-2015) and the three sub-periods. However, it has also been demonstrated that in March, October, and November, correlation coefficients between precipitation and the NAOi are just as high as those observed during the winter months.
The three main correlation patterns with the NAOi clearly illustrate the effect of the NAO on precipitation of the IP. Strong negative correlations are observed in its southwestern quadrant, which may reach the center of the IP, and, in a diagonal pattern, towards the NE (Hernández et al., 2020).
The correlation between WeMOi and precipitation is statistically significant during winter and autumn in the east of the IP, where the NAO has shown little influence (Martín-Vide and López-Bustins, 2006). As examples, strong negative correlations are associated with torrential precipitation in the NE (López-Bustins et al., 2020), while hydrological behavior in the southeastern region is heavily influenced by the Mediterranean pattern (Manzano et al., 2019). Both the NAO and the WeMO patterns share the characteristic that they do not exhibit significant negative or positive correlations with summer rainfall (June, July, and August).
Both indices show clear characteristic spatial patterns, except during the summer months. The spatial correlation patterns of NAOi, WeMOi, and precipitation are almost orthogonal. The NAO shows a diagonal shape from the SW of PS, where correlations are negative and highly statistically significant. The WeMO shows the highest negative values in the East, associated with a positive pole in the eastern part of the Cantabrian coast. The use of these two low-frequency variability patterns allows for an explanation of a substantial portion of the rainfall variability in PS at a monthly resolution. December is the month with the most characteristic spatial patterns and the highest correlations. The analysis for the three subperiods (1915-1945, 1946-1980, and 1981-2015) reveals some variations in the spatial influence patterns of the two teleconnections on precipitation. However, the most characteristic patterns remain distinguishable.
The spatial patterns of the relationship between NAOi, WeMOi, and precipitation align with the spatial distribution of certain rainfall variables, including some at daily temporal resolution, such as the daily CI, the annual D, the annual CV, and seasonality. The area with the highest CI values coincides with the region where the WeMOi shows the strongest (negative) correlation with precipitation. Thus, it can be stated that the negative phase of WeMO, with humid eastern winds, occasionally produces intense rainfall, which accounts for a large part of the annual total in the eastern IP (Martín-Vide and López-Bustins, 2006; Sánchez-Almodóvar et al., 2025). The highest D values coincide with the area of maximum negative correlation between the NAOi and precipitation. Conversely, the area with the lowest disparity index corresponds to the area with the most positive correlation between the WeMOi and rainfall. This reinforces the explanatory and complementary capacity of these two teleconnection patterns in describing spatial precipitation variability.
The clear north-south pattern of CV reflects the increase in subtropicality, as indicated by the longer duration of dry spells from north to south, characteristic of the Mediterranean climate. Finally, the autumn maximum of precipitation in the eastern part of the IP differs from the typical winter maximum of the Mediterranean climate and coincides with the area where the WeMO has the greatest influence. In the SW, extending across the rest of the western part of PS and under the influence of the NAO, the precipitation maximum occurs in winter. Thus, there is a clear difference in precipitation seasonality between the eastern fringe and the SW, where the WeMO and the NAO exert their strongest influence on precipitation, respectively. As a hypothesis, the expansion of the autumn maximum in recent decades to many central plateau regions of the IP may be due to the increasing influence of progressively warmer Mediterranean waters (Pastor et al., 2020; López, 2021).
To contextualize the regional results, we have analyzed several studies on the influence of the NAO in the Mediterranean basin. Trigo et al. (2002) have already shown that a positive NAOi results in a negative rainfall anomaly over much of the western Mediterranean basin, extending from the study area to the Italian Peninsula, whereas the opposite occurs with a negative NAOi. For Morocco, Hakam et al (2025) have recently shown that in the winter/wet season, the WeMO has a significant influence on precipitation associated with negative regression coefficients. Similarly, the NAO is observed in many stations, also displaying a negative influence on precipitation. Using an artificial neural network, Velichkova et al. (2025) show that the impact of moderately negative NAO values is small in the Balkan region; however, NAO values below the 2σ level have a significant impact on the Balkan Peninsula, due to the activation of Mediterranean cyclones. Benzouaï et al (2024) indicate that there is a seasonal and annual negative correlation between sea surface temperature in the Algerian Sea and WeMOi and NAOi modes, among others. Using principal component analysis, Platikanov et al. (2024) highlighted the influence of the NAO and the WeMO on the precipitation of PS, the latter at local spatial resolutions. The results obtained for mainland Spain are consistent with all these references.

