Articles
Surface water assessment availability and potential impacts on
Mexico’s 757 hydrographic basins for future hydroelectric
development
José Avidán Bravo-Jácome1
*
Margarita Elizabeth Preciado-Jiménez1
José Alberto Báez-Durán1
Eduardo Alexis Cervantes-Carretero1
Roel Simuta-Champo1
Rodrigo Roblero-Hidalgo1
Héctor Giovanni Rodríguez-Vázquez1
Ana Palacios-Fonseca1
Yolanda Solís-Alvarado1
Maritza Arganis-Juárez2
Héctor Alonso Ballinas-González1
1Instituto Mexicano de Tecnología del Agua,
62550 Jiutepec, Morelos, México.
2Instituto de Ingeniería, Universidad Nacional
Autónoma de México, Ciudad Universitaria, 04510 Ciudad de México,
México.
ABSTRACT
This study evaluates Mexico’s surface water availability across 757 hydrographic
basins, organized into 37 hydrological regions, projecting scenarios for 2034.
Using NOM-011-CONAGUA-2015 methodology, availability was determined by
subtracting downstream commitments from runoff volume, analyzing historical
climate (1976-2018) and water use trends. Significant regional disparities
exist. Northern basins, like those in HR 8 (Sonora Norte) and 24 (Río Bravo
Conchos), face severe water stress, with availability as low as 050
Hm3/year. Southern regions, such as HR 30 (Grijalva-Usumacinta),
have higher availability, exceeding 10 000 Hm3 . Projected scenarios
for 2034, using Turc’s formula and the runoff coefficient (Rc), indicate 154
(Turc) and 103 (Rc) basins will face water scarcity. Northwest basins, including
HR 9 (Sonora South) and 25 (San Fernando Soto la Marina), are projected to have
availability below 100 Hm3 , exacerbating stress. South-central
basins, like HR 18 (Balsas) and HR 30 are expected to maintain high
availability, exceeding 500 Hm3 . The study also identified basins
suitable for hydroelectric development, focusing on flows above 2 m3
s-1 and slopes over 2%. However, ecological and legal
constraints, like protected areas and environmental flow requirements, limit
development, especially in HR 30. These findings underscore the need for
integrated water management to address regional disparities, promote
sustainability, and mitigate the impacts of climate variability on Mexico’s
water resources.
Keywords: water uses; precipitation; surface water availability; temperature; Turc’s method
RESUMEN
Este artículo evalúa la disponibilidad de agua superficial en México en 757
cuencas hidrográficas, organizadas en 37 regiones hidrológicas, proyectando
escenarios para 2034. Utilizando la metodología NOM-011-CONAGUA-2015, la
disponibilidad se determinó restando el volumen de agua para uso agrícola,
urbano o industrial aguas abajo, del volumen de escurrimiento, analizando el
clima histórico (1976-2018) y las tendencias de uso del agua. Se encontraron
disparidades regionales significativas. Las cuencas del norte, como la HR 8
(Sonora Norte) y 24 (Río Bravo Conchos), enfrentan un estrés hídrico severo, con
una disponibilidad tan baja como 0-50 Hm3 año-1. Las
regiones del sur, como HR 30 (Grijalva-Usumacinta), tienen una disponibilidad
mayor, superior a los 10 000 Hm3 año-1. Las proyecciones
para 2034, utilizando la fórmula de Turc y el coeficiente de escurrimiento (Ce),
indican que 154 (Turc) y 103 (Ce) cuencas enfrentarán escasez de agua. Se
proyecta que las cuencas del noroeste, incluidas HR 9 (Sonora Sur) y HR 25 (San
Fernando Soto la Marina), tendrán una disponibilidad inferior a 100
Hm3 año-1, lo que exacerbará el estrés. Se espera que
las cuencas del centro-sur, como RH 18 (Balsas) y RH 30, mantengan una alta
disponibilidad, superior a 500 Hm3 año-1. El estudio
también identificó cuencas adecuadas para el desarrollo hidroeléctrico,
centrándose en flujos superiores a 2 m3 s-1 y pendientes
superiores al 2%. Sin embargo, las limitaciones ecológicas y legales, como las
áreas protegidas y los requisitos de caudal ambiental, limitan el desarrollo,
especialmente en RH 30. Estos hallazgos resaltan la necesidad de una gestión
integrada del agua para abordar las disparidades regionales, promover la
sostenibilidad y mitigar los impactos de la variabilidad climática en los
recursos hídricos de México.
1. Introduction
Population growth worldwide will bring with it an increasing number of problems
regarding drinking water demand and its relationship with availability. According to
the water statistics for Mexico in 2019, published by the Comisión Nacional del Agua
(National Water Commission, Conagua [2019]),
Mexico receives approximately 1 449 471 million cubic meters of water annually
through precipitation. Of this total, approximately 72.1% returns to the atmosphere
through evapotranspiration, 21.4% flows through rivers and streams, and the
remaining 6.4% infiltrates into the subsoil, naturally recharging aquifers. When
accounting for cross-border outflows and inflows, Mexico has a 451 584.7
Hm3 annual renewable freshwater availability (Conagua, 2019).
Surface water availability in Mexico is a critical issue influenced by climatic
variability, population growth, and unsustainable water management practices.
Studies such as those by Mekonnen and Hoekstra
(2016) highlight the global and regional water scarcity challenges, with
Mexico facing significant stress due to uneven distribution and overexploitation of
surface water resources. López-Morales (2017)
provides a comprehensive overview of Mexico’s water resources, highlighting that
surface water availability is highly seasonal and spatially uneven, with most
resources concentrated in the southern regions, while the north of the country faces
severe water scarcity. Climate change further complicates this scenario, as
highlighted by Magaña et al. (1997), who
projected reduced precipitation and increased evaporation rates, thereby threatening
the long-term sustainability of surface water. Additionally, Hernández-Espriú et al. (2014) discussed the interplay between
surface and groundwater systems, noting that over-reliance on groundwater in regions
like Mexico City indirectly impacts surface water availability. Collectively, these
studies underscore the urgent need for integrated water management strategies to
address Mexico’s surface water challenges in the face of the growing demand and
climate variability.
Despite these substantial resources, Mexico faces a complex water challenge,
including regional imbalances in water availability, basin overexploitation, and
increasing demand. The 2030 water agenda (Conagua,
2012) emphasizes these disparities, particularly in critical basins.
While regions such as Grijalva-Usumacinta (HR 30) use only a small fraction of their
available water, others, like the Lerma and Bravo basins, exceed 100% of their
natural surface water availability. This overuse threatens ecosystems and undermines
sustainable economic development. Currently, Mexico’s national water demand stands
at 78 400 Hm3 annually, of which 11 500 Hm3 are unsustainably
sourced. Projections suggest that, without intervention, this gap could double
within the next 20 years. Addressing these challenges requires an integrated water
management strategy that not only tackles water scarcity but also considers issues
of water quality, governance, and sustainability. These efforts must integrate the
interconnected social, economic, and environmental dimensions of water resources.
Collaborative action among government agencies, stakeholders, and communities is
essential to ensure equitable access to clean water, promote environmental
sustainability, and build resilience to future water-related challenges.
This paper examines surface water availability in Mexico across 757 basins, organized
into 37 hydrological regions, using the methodology outlined in the Official Mexican
Standard NOM-011-CONAGUA-2015 (Semarnat,
2015). It is essential to note that while numerous manuals are available for
estimating water availability in a basin, these primarily focus on natural
availability or natural runoff. This is distinct from water availability for
administrative or legal purposes, as outlined in Silva-Hidalgo et al. (2013). For instance, López-García et al. (2017) conducted a water balance to
determine natural availability under climate change scenarios for the Galeana Valley
aquifer in the state of Nuevo León, Mexico. Similarly, Loor (2017) performed a watershed balance in Ecuador, and Ordóñez-Gálvez (2011) presented a methodology
to estimate the natural surface water balance in Peru. The United Nations
Educational, Scientific and Cultural Organization (UNESCO) incorporated the
consumptive use variable (Uc) into the surface water balance of the Valley of Mexico
basin, and calculated its water balance variability and uncertainty components
(Aparicio-Mijares et al., 2006),
Although most publications focus on the natural water balance, countries such as
Chile, Spain, Mexico, and the USA have normative documents for water resource
management. These documents are based on the fundamental equation
(dV)(dt)-1 = E -
S, which states that the volume change (V) is
equal to the inputs (E) minus the outputs (S) of
water over a specific period (t) (Aparicio-Mijares et al., 2006). The primary difference lies in the
methodology used to estimate the data in the balance equation. Unlike the natural
water balance, in the administrative or regulatory balance, consumptive use (Uc) is
considered an output (S).
This paper uses a robust methodology to assess average annual surface water
availability, quantifying the delta between runoff volume and existing downstream
water commitments. Crucially, it extends beyond mere quantification to pinpoint
basins exhibiting optimal potential for hydroelectric development by 2034. This is
achieved through a meticulous evaluation of topographic characteristics, interwoven
with a comprehensive consideration of ecological, social, and infrastructural
constraints. By dissecting these multifaceted dynamics, this paper aims to make a
significant contribution to a sustainable and resilient water management strategy
for Mexico. It seeks to ensure responsible and equitable stewardship of natural
resources, while simultaneously illuminating viable pathways for sustainable energy
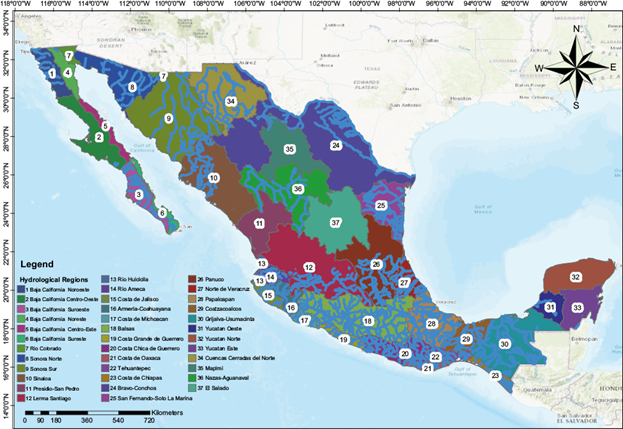
production. Figure 1 illustrates Mexico’s
division into 37 hydrological regions, representing the country’s primary watersheds
or basins. These regions define water flow dynamics, availability, and catchment
boundaries, serving as a critical framework for water resource management,
conservation, and infrastructure planning.
2. Methods
As outlined in the Official Mexican Standard NOM-011-CONAGUA-2015 (Semarnat, 2015), which provides specifications
and methodology for determining the average annual availability of national waters
in Mexico, average surface water availability is estimated using the following
equation:
D=Ab-Rxy
(1)
where: D is the average annual surface water availability in
Hm3, A
b
is the average annual runoff volume downstream in Hm3, and
R
xy
is the average annual volume committed downstream in Hm3.
The average runoff volume downstream (A
b
) is further calculated using Eq. (2):
Ab=Ar+Cp+Re+Im-Ex-Uc-Ev-Av
(2)
where A
r
is the average annual runoff volume from upstream basin; C
p
is the average annual natural runoff volume; R
e
is the annual returns volume; I
m
is the annual import volume; E
x
is the annual export volume; U
c
is the annual surface water volume extraction (U
ca
: annual surface water volume extraction through titles currently
registered/assigned in the Water Rights Public Registry [REPDA, for its Spanish
acronym], U
cb
: annual surface water volume extraction from titles in the registration
process at REPDA, and U
cc
: annual volume corresponding to reserves and regulated areas);
E
v
is the average annual evaporation volume in reservoirs and water bodies; and
A
v
is the average annual storage volume variation in reservoirs (all variables
are reported in Hm3).
Eq. (2) defines A
b
as water balance inflows and outflows within a basin. Positive variables
represent the water volume entering the basin, while negative variables indicate the
water volume leaving it. To calculate water availability, both natural and
anthropogenic factors that influence these variables are considered. The behavior of
these variables over time was analyzed, and projected values were compared to
historical records. The percentage change for each variable was then applied to the
latest values published in a 2020 availability study (SINA, 2020).
Hydrological regions in Mexico are composed of multiple hydrological basins, and
water availability was calculated both by basin and by hydrological region using Eq.
(1). The D value in Eq. (1) was calculated for each hydrological
basin. However, the methodology established in NOM-011-CONAGUA-2015 specifies that
this calculation must be applied to the entire hydrological region, as it is
performed from the downstream basin to the upstream basin. It is important to note
that NOM-011-CONAGUA-2015 was designed for its application to a single hydrological
basin, which must have a single outlet. In contrast, a hydrological region comprises
multiple hydrological basins, and not all hydrological regions in Mexico drain into
a single outlet. Many hydrological regions in Mexico have multiple outlets draining
into the sea, which does not align with the requirements of
NOM-011-CONAGUA-2015.
In this analysis, natural variables include precipitation and temperature, and
anthropogenic variables include water usage or consumptive uses (U
c
). These inputs are essential for calculating the water balance within a
basin (Cp). The methodology to estimate consumptive water uses and the
climatological variables required for assessing water availability in Mexico for
2020 and 2034 are detailed below.
2.1 Water use projection
Bonsal et al. (2020) conducted a review
analyzing freshwater supply and demand in the Canadian Cordillera, highlighting
both historical and future changes in water availability resulting from glacial
melt. They found that projected impacts are greater on the seasonality of water
flow, with increases in winter and decreases in summer, especially under
high-emission scenarios. Southern regions, such as Saskatchewan and Okanagan,
will face greater vulnerabilities due to summer water scarcity and growing
economic demands. In the north, changes in the landscape, such as permafrost
thaw, will impact water quantity and quality. To project future water use to
2034, we analyzed primary sector water demands like agricultural, industrial,
and urban public uses. Trends in production systems, population growth, and
economic activity were taken into consideration. Regression analysis was used to
obtain these trends and extrapolate them to 2034. The projection used to
estimate the value by 2034 is based on historical data from 1976 to 2020.
However, it is important to acknowledge that long-term projections are subject
to uncertainty due to external factors that may impact the results. Therefore,
the presented results should be interpreted as a projection or scenario based on
a trend, rather than an exact prediction.
2.1.1 Agricultural sector
Data on planted areas for various crops in irrigation districts and units was
sourced from Conagua and the Servicio de Información Agroalimentaria y
Pesquera (Agri-Food and Fisheries Information Server, SIAP). Analyzing
trends in planted areas by crop type is essential for projecting future
water demands.
2.1.2 Urban public sector
Population growth data was obtained from the Instituto Nacional de
Estadística y Geografía (National Institute of Statistics and Geography)
(INEGI, 2020) and the Consejo
Nacional de Población (National Population Council, Conapo). Trends in
population growth were used to project future water demands.
2.1.3 Industrial sector
Data on gross domestic product and production was sourced from INEGI. Trends
in economic activity were used to project future water demands.
After calculating water volumes by use and by basin for the years 2020 and
2034, the growth rate between these years was estimated by dividing the
volume in 2034 by the volume in 2020 and subtracting
1[(Vol2034)(Vol2020)-1] - 1. This
growth rate (see Table SI in the
supplementary material) of the consumptive use is then applied to the uses
included in the 2020 surface water availability studies. It is important to
note that the water volume for consumptive uses does not differentiate
between surface water and groundwater sources; the primary interest is to
estimate the percentage increase or decrease in consumptive uses.
2.2 Historical climate data and projection
2.2.1 Precipitation and temperature
Boulanger et al. (2005) analyzed
long-term trends in precipitation within the Paraná-Plata basin. They
highlighted a positive increase in the precipitation total index (PTI) from
the late 1960s to the early 1980s. They observed a significant increase in
precipitation from November to May in southern Brazil and Argentina. Changes
in the El Niño-Southern Oscillation (ENSO) characteristics have influenced
the variability of precipitation, making it difficult to define robust
statistical relationships between ENSO and precipitation in the basin.
Additionally, they emphasized the limited usefulness of linear statistical
forecast systems for predicting impacts at the local or regional scale.
To analyze the climatic variables of the 757 basins, this work utilized the
results of Ramírez-Villa et al.
(2022), who obtained precipitation and temperature records from
the CLImate COMputing project (Clicom). This database, encompassing 5442
meteorological stations across Mexico, provided the foundational data. They
obtained historical precipitation (1976-2018) and temperature data
(1976-2015). To ensure data integrity, they implemented a rigorous quality
control process, leveraging the CLIMATOL software (v. 3.1) within the R
environment. This process incorporated the Paulhus and Kohler (1952) method, addressing anomalous values to
facilitate data homogenization and rectify missing data. To address the
temporal variability in station operation, Ramírez-Villa et al. (2022) implemented a rigorous data
selection process, adhering to World Meteorological Organization guidelines
(WMO, 2011) to identify stations
with data completeness of at least 80% from 1976 to 2018. Additionally, they
calculated the annual accumulated precipitation for each selected station
and Thiessen polygons, as stipulated by NOM-011-CONAGUA-2015, to estimate
the average rainfall distribution. Polygons corresponding to stations within
each basin were extracted, along with their influence areas, enabling the
calculation of cumulative annual precipitation per basin (Eq. [3]).
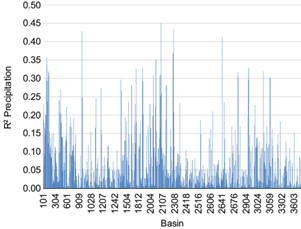
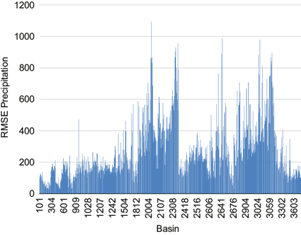
A linear regression model, trained on data from 1976 to 2018, was used by
Ramírez-Villa et al. (2022) to
project precipitation and temperatures to 2034, employing Excel-based
models. Acknowledging the inherent uncertainty of regression models, this
study includes the calculation and presentation of statistical metrics such
as R2 and root mean square error (RMSE), comparing observed
historical data with model-generated predictions (shown in Table SI in the supplementary
material). These predictions were taken as projections or scenarios due to
low R2 and RMSE values in some basins. For example, in basin 3708
(Sierra Madre), with an average annual rainfall of 461.7 mm, the
R2 value is 0.005. On the other hand, in basin 2305 (La
Punta), the R2 value is 0.435.
Cumulative annual precipitationbasin =∑i=1nPi∙Ai∑i=1nAi
(3)
where P
i
is the annual accumulated precipitation for each meteorological
station located within a basin, A
i
is the influencing area of the basin, and n is the
total polygons number associated with stations surrounding each basin.
To analyze the temperature parameter, a selection process identified 1512
meteorological stations with complete data spanning from 1976 to 2015. This
selection was necessary due to a significant reduction in available station
data after 2015. A comprehensive data quality assessment was conducted with
this robust dataset, followed by the calculation of annual average maximum
and minimum temperatures for each station. Subsequently, two interpolations
were carried out for each year (maximum and minimum annual temperature) from
1976 to 2015 using Kriging regression. This method generated a mesh with a
resolution of 0.05º for the entire Mexican territory. Additionally, an
elevation adjustment model was used to improve the quality of the results
due to the high correlation between these variables. The temperature average
value in each Mexican basin from 1976 to 2015 was obtained using Eq.
(4):
Temperaturebasin=∑i=1nTin
(4)
where T
i
represents the temperature grid points per year located within each
basin (in ºC), and n is the total number of polygons
located within the basin.
Similar to the procedure for obtaining precipitation projections, temperature
projections were obtained. A linear regression Excel model was used for each
of the 757 hydrographic basins, utilizing their historical records, to
estimate the maximum and minimum annual average temperature values (in ºC)
for 2034 (see Table SI in the
supplementary material).
2.3 Water volume per local basin (Cp)
Koshida et al. (2015) examined the impact
of climate variability and projected climate change on water availability in
Canada. This research, the first in a three-part series, reviewed and compared
different approaches to estimating water availability, categorized into three
types: climate-based, hydrological, and water supply/demand indicators.
Climate-based indicators use variables such as precipitation and
evapotranspiration to calculate water balances. Hydrological indicators focus on
river flow and runoff. Supply/demand indicators compare the volume of available
water with water use. The study provides insights into the current state of
water availability estimates in Canada. Water volume per local basin (Cp) is the
total water volume that originates within a specific hydrological basin and is
available for potential use. This volume is measured in cubic hectometers
(Hm3) and is calculated based on factors such as precipitation,
temperature, evaporation, and the basin's physical characteristics. To
estimate Cp, three sources were considered:
Historical Cp: values from the 2020 availability study (Semarnat, 2020).
Turc’s method: this method estimates Cp based on precipitation,
temperature, and basin area (Sánchez, 2022).
The runoff coefficient (Rc) method: this method estimates Cp based on
precipitation, basin area, and a runoff coefficient.
Both the Turc’s and Rc methods were applied to historical and projected climate
data to estimate Cp for the current scenario and the projected 2034
scenario.
2.3.1 Turc’s method
This method estimates Cp by calculating the difference between precipitation
and actual evapotranspiration (ETR). Eq. (5) demonstrates that ETR is
functionally dependent on both annual precipitation and average annual
temperature.
E = P – ETR
(5)
where E is the annual specific runoff, P
the annual precipitation, and ETR the actual ETR in the
basin (all in mm).
ETR is calculated with the following expression:
If P > 0.31 L then
ETR= P0.90+PL-12-12
(6)
where L is obtained as:
L = 300 + 25 T + 0.05 T3
(7)
where, in turn, P is the annual precipitation (in mm) and
T is the average temperature (in ºC).
If P < 0.31 L then
ETR = P
(8)
Natural runoff average annual volume (Cp, in m3), is obtained with
the expression:
Cp = EA
(9)
where A represents the basin area (in m2) and
E the specific annual runoff (in m).
The volume per basin was calculated with Turc’s method, where the most
important variables are precipitation and temperature, as well as the area
of each basin.
The Cp volume was based on the average precipitation data from 1976 to 2018
and temperature data from 1976 to 2015. Using the same methodology, Cp was
also estimated using precipitation and temperature projections for 2034. The
percentage change between these values was then determined using Eq.
(10):
% change=Cp2034-CpaverageCpaverage
(10)
where % change is the percentage of change between an
average annual value and that projected for 2034, C
p2034
is the volume per local basin estimated for 2034 by Turc’s method
(Hm3), and Cp average is the volume per
local basin estimated with average annual climatic values by the Turc’s
method (Hm3).
2.3.2 Runoff coefficient (Rc) method
As outlined in NOM-011-CONAGUA-2015, Eq. (11) estimates C
p
by the Rc method using a runoff coefficient that depends on land use
and soil type. Rc values were either obtained directly from the Conagua
database or estimated based on data from similar basins. In this study, land
use and soil type were assumed to remain unchanged through 2034.
Cp = P A Rc
(11)
where Cp is the volume per local basin (m3),
P is the average annual rainfall (m),
A is the basin area (m2), and
Rc is the runoff coefficient (dimensionless).
To maintain temporal consistency across our analysis, a percentage change
calculation, as defined by Eq. (10), was performed. However, this
calculation was specifically applied to the average annual precipitation
data spanning from 1976 to 2018. This deliberate restriction of the time
period was implemented to ensure uniformity with both the temperature
parameter dataset and the projected precipitation values for 2034.
2.4 Water availability by 2034
Three scenarios were considered for estimating surface water availability.
2020 availability: Values from the 2020 availability study (Semarnat, 2020).
2034 availability (%change using Turc’s method): The percentage
change calculated using Turc’s method was applied to the 2020 Cp
value to estimate the corresponding Cp for 2034. Consumptive use (Uc
for 2020) was adjusted based on its projected growth rate for 2034.
Other variables in Eq. (2), such as R
e
, I
m
, E
x
, E
v
, and A
v
, were assumed to remain constant.
2034 availability (%change using the Rc method): Similarly, the
percentage change derived using the Rc method was applied to the
2020 Cp value to calculate the corresponding Cp for 2034.
Consumptive use (Uc for 2020) was adjusted based on its projected
growth rate for 2034. Other variables in Eq. (2), such as
R
e
, I
m
, E
x
, E
v
, and A
v
, were assumed to remain constant.
Using the values obtained from the availability water document from Semarnat (2020) and the percentage changes
from the Turc’s and Rc methods, the availability of surface water for 2034 was
estimated. Eqs. 1 and 2 were applied to compute the two scenarios for 2034 based
on the percentage changes from Turc’s and Rc. The same growth rate for Uc was
used in both methods.
2.5 Identifying sites with hydroelectric potential
Basins characterized by surface water flows greater than or equal to 2
m3 s-1 and slopes exceeding 2% were identified as
potential sites for hydroelectric development. Legal and ecological constraints,
including protected areas and environmental flow requirements, were considered.
The average annual available water volume was converted to flow rate in cubic
meters per second (m2 s-1). Basins with slopes greater
than 2% were derived from the slope map at a scale of 1:250000, published by the
Instituto Nacional de Ecología (National Institute of Ecology) (INEGI, n.d.).
3. Results and discussion
3.1 Water use
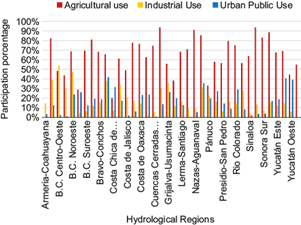
The agricultural sector is the primary water consumer in Mexico. To ensure
sustainable water use, it is crucial to improve water efficiency and adopt
sustainable agricultural practices. Water use patterns vary across hydrological
regions, requiring region-specific water management strategies. Figure 2 illustrates the significant
increases in agricultural water consumption projected for the Balsas, Bravo,
Sinaloa, and Nazas-Aguanaval regions. Industrial water use will remain
concentrated along the central axis, with increasing demand in northwestern
states such as Chihuahua, Sonora, Sinaloa, and Durango. Urban public water use
will continue to be highest in basins with large cities. By 2034, the Bajo
Atoyac River basin in the Balsas region and the Río Blanco in the Papaloapan
region will have the highest extraction volumes, while the Valley of Mexico
basin will remain the primary basin for urban public water use. Given the large
number of hydrological basins, the results are presented by hydrological
regions, which group multiple basins into broader, more manageable categories
for analysis.
3.2 Climate change impacts
Climate change is expected to have a significant impact on Mexico’s water
resources. Studies by Boulanger et al.
(2005) and Koshida et al.
(2015) highlighted the potential consequences of shifting climate
patterns on water availability. While long-term climate forecasts inherently
carry uncertainty, it is crucial to recognize the potential impacts of climate
change on Mexico’s water resources. Factors such as altered rainfall patterns,
rising temperatures, and increased frequency of extreme weather events could
exacerbate water scarcity and disrupt hydrological cycles. Our climatic variable
findings are detailed in the following sections.
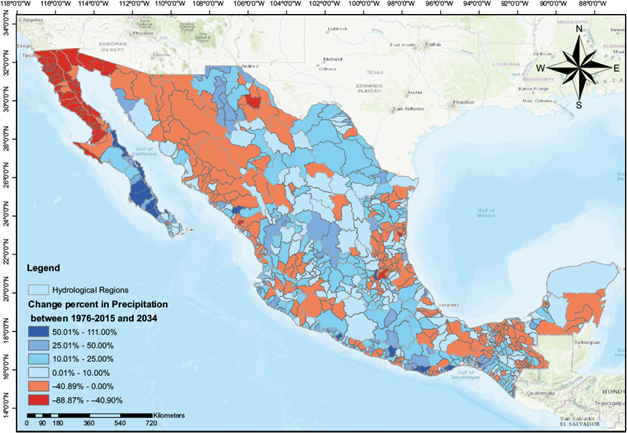
3.2.1 Precipitation
Precipitation patterns across Mexico exhibit significant regional
variability, with the Baja California Peninsula, along with the northwest
and north-central regions, experiencing the lowest rainfall, while the
southeast region, including Veracruz, Oaxaca, Tabasco, Chiapas, and
Campeche, receives the highest precipitation. The projected precipitation
for 2034 shows significant regional variability, with some areas projected
to experience substantial increases (e.g., Rh 30: +41%) and others facing
decreases (e.g., Rh 1, Rh 4, Rh 7: -48%). These changes underscore the need
for region-specific water management strategies to address the challenges of
water scarcity and flooding. These changes underscore the increasing
variability in precipitation patterns, with some regions facing heightened
water stress while others experience higher rainfall. Figure 5 illustrates the percentage change in
precipitation between the 1976-2018 average and the projected values for
2034, emphasizing the need for region-specific water management strategies
to address these shifts. Additionally, the linear regression model’s
performance across 757 basins reveals significant disparities, with basins
like 1804 (Río Nexapa) showing relatively strong predictive accuracy
(R2 = 0.33 and RMSE = 78.55), while others, such as 2302
(Tepanatepec), 2321 (Coatán), and 3030 (Paredón), exhibit poor performance
(R2 < 0.05, RMSE > 500). These values reinforce what is
described in the methodology; the precipitation and temperature values
projected for 2034 have a high level of uncertainty, so they are only
considered as a scenario (Figs. 3 and
4).
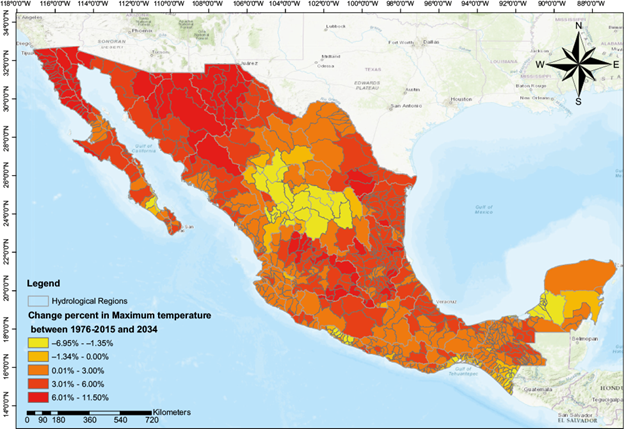
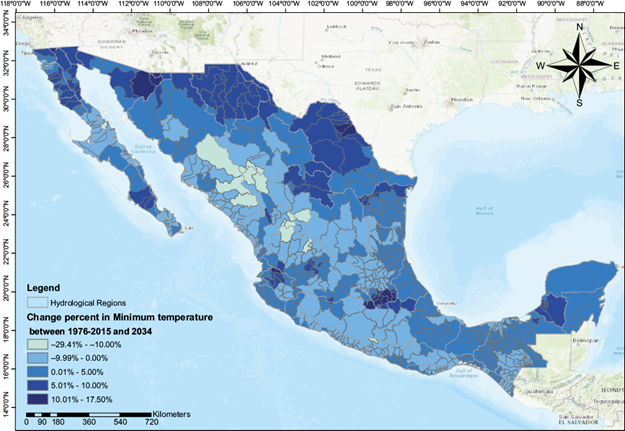
3.2.2 Temperature
In 101 basins, maximum temperatures are projected to decrease
slightly by 1% (0.5 ºC).
In 656 basins, maximum temperatures are projected to increase by
3% (almost 1 ºC).
Decreases in maximum temperature are concentrated in northern
Mexico, Michoacán, coastal Oaxaca, and Campeche, and the
southern border with Guatemala.
Historical minimum temperatures are concentrated in the areas
between the Sierra Madre Occidental and the Sierra Madre
Oriental, together with Baja California Norte.
In 299 basins, minimum temperatures are projected to decrease by
3% (-0.4 ºC), while in 458 basins, they are projected to
increase by 3% (0.4 ºC).
Decreases in minimum temperature are observed in northwestern
Mexico, particularly in the mountains of Sinaloa, Chihuahua, and
Durango.
Increases in minimum temperature are observed in the Valley of
Mexico basin and parts of Campeche.
Similarly, Figures 6 and 7 show the percentage changes in maximum
and minimum temperatures, respectively, over the same period.
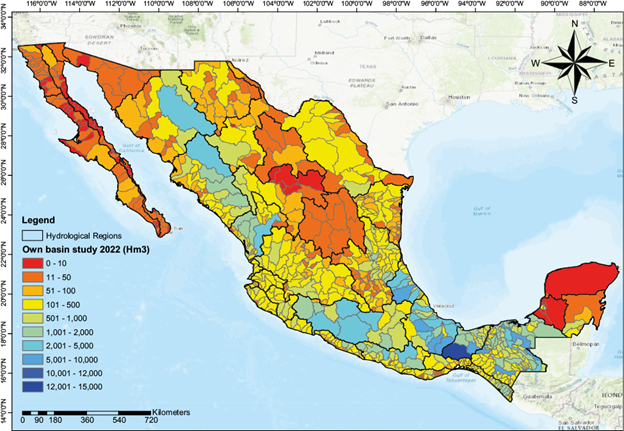
3.3 Water volume per local basin (Cp
)
Turc’s and Rc methods were employed to estimate Cp under both historical and
projected climate conditions, as well as to calculate the corresponding
percentage changes. Turc’s method typically results in larger changes in Cp
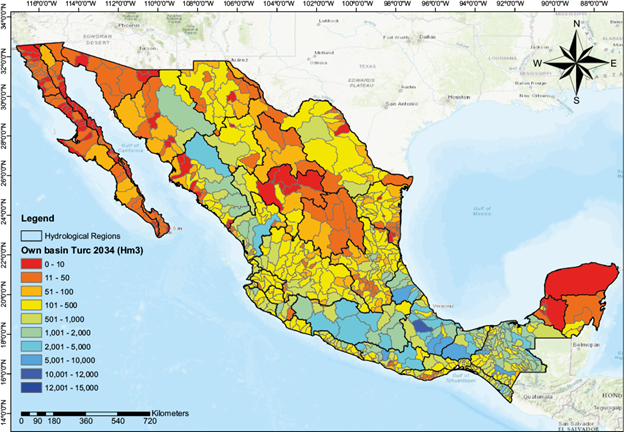
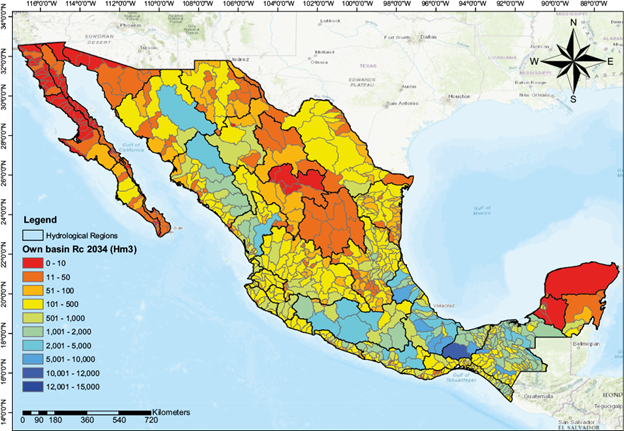
compared to Rc, which accounts solely for variations in precipitation. Figure 8 illustrates the water volume per
local basin (Cp), as reported in the study published by Semarnat (2020).
Figure 8 also shows that in 2020, most
basins generated a runoff lower than 500 Hm3 per year, except for the
Tarahumara mountains, the Balsas River, and the eastern slopes of the Sierra
Madre. The change percentage predicts a decrease in Cp in Baja California
Peninsula and northwestern territories, and an increase in the south-central
region (Fig. 9). The Rc method shows a less
significant change, but also indicates a decrease in Cp in the northwest (Fig. 10).
3.4 Water availability
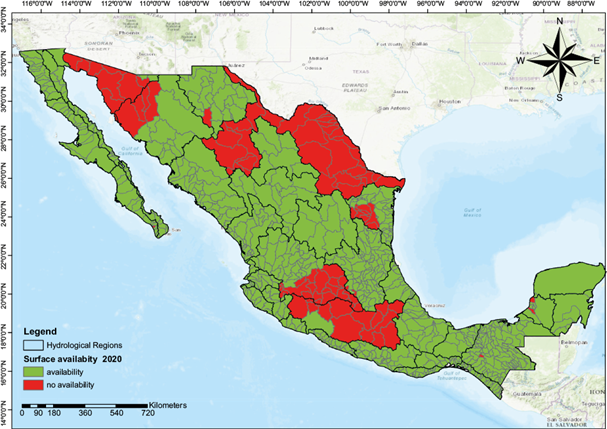
For 2020, basins without water availability were primarily concentrated in the
following hydrological regions: 8 Sonora Norte, 9 Sonora Sur, 24 Río Bravo
Conchos, 12 Lerma, and 18 Balsas, as well as basin 3405 Río Santa María 1
together with several basins in the southwestern area of hydrological region 25
San Fernando Soto la Marina. Figure 11
shows surface water availability for 2020, as published by Semarnat (2020).
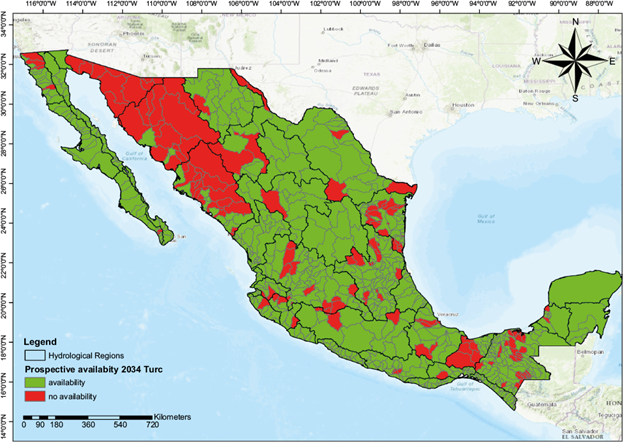
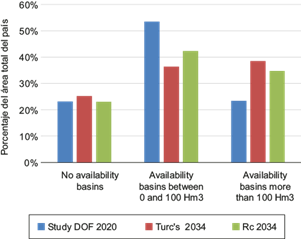
In the 2034 scenario, using Turc’s method, projections show 154 basins (25%)
without availability, 266 basins (36%) with availability (but less than 100
Hm3), and 337 basins (38%) with more than 100 Hm3. For
the 2034 projection, using the percentage change calculated by Turc’s method
(Fig. 12), basins without availability
are expected to be concentrated in the northwest of the country and Rh 29
Coatzacoalcos, with additional scattered basins without availability distributed
throughout the national territory. Figure
12 displays the surface water availability projected for 2034,
calculated using Turc’s method.
Figure 13 shows the surface water
availability for 2034, calculated using the Rc method. Additionally, Figure 14 illustrates the comparative
behavior of water availability between 2020 and the projected scenarios for
2034. These figures collectively provide a comprehensive comparison of the
results obtained in this study with the official water availability data
published by the Mexican government, as well as the projected scenarios based on
the applied methodologies. Similarly, projections with the runoff coefficient
method (Fig. 13) show that basins without
availability will also be concentrated in the northwest of the country, though
to a lesser extent. Additional affected areas include Rh 30 Grijalva-Usumacinta,
18 Balsas, and 35 Mapimí. With the Rc method, in the 2034 scenario, there are
103 basins without availability (23%), 334 basins (42%) with availability (but
less than 100 Hm3) and 320 basins (35%) with more than 100
Hm3.
Figure 14 graphically contrasts the
calculated results with the 2020 water availability data published by Semarnat (2020), providing a clearer
understanding of trends and variations. The basins without availability, as
reported in the 2020 study, increase slightly when the estimated percentage
changes derived from the Turc’s and Rc methods are applied. In both scenarios,
the number of basins with availability of less than 100 Hm3
decreases, while the number of basins with availability exceeding 100
Hm3 increases. Nationwide, the total number of basins without
availability rose significantly from 91 in 2020 to 154 when applying the
percentage change from Turc’s method and to 103 when using the Rc method.
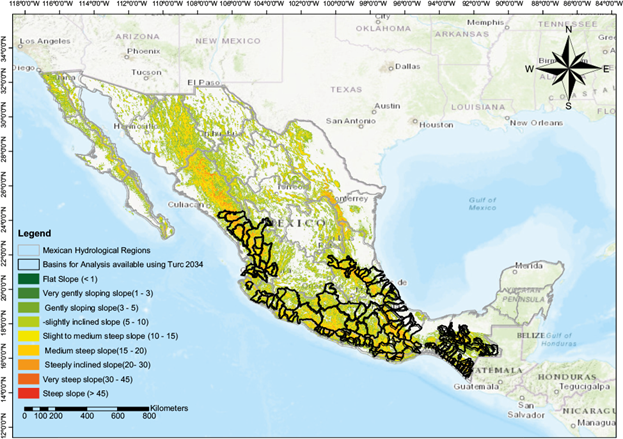
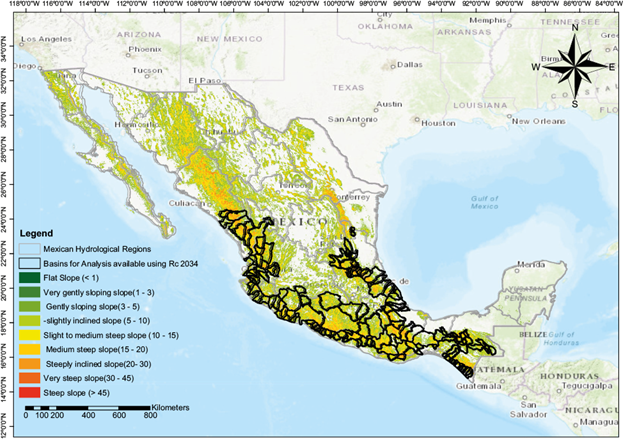
3.6 Hydropower potential
To identify potential sites for hydropower development, basins with surface water
availability (D) exceeding 2 m3 s-1 and
slopes greater than 2% were considered. Additionally, downstream flow
(AB), as defined in NOM-011-CONAGUA-2015, was utilized to
pinpoint basins suitable for further analysis. This approach enables the
identification of sites with hydroelectric potential, which can accommodate
either large dams or smaller infrastructure, such as pipelines running parallel
to the riverbeds. Figures 15 and 16 present the results of the calculations,
employing each previously mentioned method, based on the scenery’s water
availability for 2034.
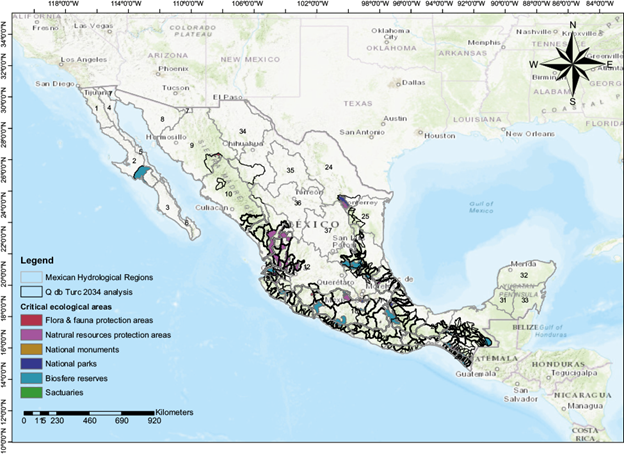
Figure 17 offers a comprehensive visual
representation of the intricate relationships between hydrological regions,
projected water availability for 2034, and ecologically critical areas. To
assess the potential impacts of water availability on sensitive ecosystems, this
study incorporated existing designations of ecologically critical areas,
including Protected National Areas (ANPs, for their acronym in Spanish), Ramsar
wetlands, and Important Bird Conservation Areas (AICAs, for their acronym in
Spanish). The AB 2034 analysis, utilizing Turc’s method (as depicted in Fig. 12), identified basins with sufficient
water flow to meet future demands, while also revealing the highest number of
basins projected to experience water scarcity by 2034. These results were then
overlaid with a map of protected areas, encompassing NPAs, Ramsar wetlands, and
AICAs, emphasizing the imperative need for sustainable infrastructure planning.
This integrated approach, facilitated by the calculations and development shown
in Figure 17, provides a crucial tool for
understanding the intersection of water resources and ecological
preservation.
3.7 Key recommendations
Infrastructure prioritization: Focusing on regions with projected
water availability exceeding 2 m3 s-1,
especially in hydrological regions such as HR 12, HR 25, HR 26, HR
30, and HR 31.
Protecting critical ecosystems: Avoiding or minimizing the impact of
infrastructure projects on Ramsar wetlands, ANPs, and AICAs to
safeguard biodiversity.
Adaptive water management: Implementing strategies to address
challenges posed by climate variability and anthropogenic pressures,
ensuring resilience in water resource management.
Reconciling the potential and restrictions in HR 30: Apparent abundant water
resources in Hydrological Region 30 (HR 30), encompassing the
Grijalva-Usumacinta basin, coupled with the strict limitations on hydroelectric
development along the Santo Domingo River, highlight the intricate equilibrium
required in water resource management. This scenario vividly illustrates the
dual mandates of energy generation and ecological preservation. While HR 30
exhibits the volumetric capacity to meet projected future water demands, it
simultaneously represents one of Mexico’s most ecologically sensitive and
significant areas. Consequently, a nuanced strategy that prioritizes both
sustainable energy solutions and the protection of critical ecosystems, is
essential. The proposed Santo Domingo hydroelectric project within HR 30 was
halted by the Secretaría de Medio Ambiente y Recursos Naturales (Secretariat of
Environment and Natural Resources, Semarnat) due to its potential ecological and
social repercussions, demonstrating the government’s commitment to prioritizing
ecological connectivity and biodiversity conservation over energy development.
This decision embodies a broader strategic framework aimed at:
Ensuring ecological flows: Maintaining sufficient water flow to sustain local
biodiversity and essential ecosystem services.
Mitigating social conflict: Respecting indigenous rights and addressing community
opposition to large-scale infrastructure projects.
Upholding conservation commitments: Adhering to national and international legal
frameworks that promote sustainable development.
By effectively balancing these imperatives, sustainable infrastructure planning
can unlock the potential of regions like HR 30 while safeguarding Mexico’s vital
ecosystems. This integrated approach fosters responsible resource management and
ensures the ecological integrity of the nation’s hydrological basins.
4. Conclusions
In this work, the results of the analysis of historical precipitation and
temperatures conducted by Ramírez-Villa et al. (2020) and their projection to 2034,
based on a linear behavior, were utilized. The growth rates of water volume in
agricultural, industrial, and urban public consumptive uses were analyzed. Using two
equations (Turc’s and Rc), the volume per local basin (Cp) was estimated and applied
in Eqs. 1 and 2, to calculate the available volume of surface water by 2034.
Subsequently, the basins with the possibility of developing hydroelectric projects
were identified.
R2 and RMSE values obtained from the linear regression applied to
historical precipitation and temperature data provide results with a low probability
of occurrence through 2034; however, they can be considered a scenario or an average
value. On the other hand, if these trends in rainfall and temperature behavior, as
well as water use behavior, continue, surface water availability scenarios can be
obtained through 2034.
The results of this work enable a first analysis of the surface water resources
available in 2020 and their scenarios by 2034. For example, according to the Semarnat (2020) study, 321 953.36
Hm3 of water are generated in Mexico by natural runoff (Cp), and 192
022.94 Hm3 are extracted for consumptive uses (60%). There is sufficient
water in the country, but the problem arises when the analysis is carried out by
hydrological region. In 2020, the natural runoff in the north was 81 095.08
Hm3, with a Uc of 78 830.86 Hm3 (97.2%). In the rest of
the regions (south), the natural runoff was 240 858.28 Hm3 and the Uc of
113 192.08 Hm3 (47%). That is, in the north, almost 100% of surface water
is consumed for different purposes, resulting in severe water stress.
The northern regions experience severe water stress, characterized by high local
basin (Cp) values and consumptive use (Uc). The substantial exploitation of
available surface water across various sectors intensifies pressure on already
scarce resources.
The southern regions, which face significant barriers to infrastructure development,
exhibit lower water utilization rates. These challenges include irregular
precipitation patterns, limited investment, environmental constraints, social
resistance, and the recognition of indigenous rights. Furthermore, limited
hydropower potential necessitates the exploration of alternative energy sources.
Developing hydropower infrastructure presents a significant challenge, demanding a
careful equilibrium between energy generation and ecological and social
considerations. Southeastern basins, like the Usumacinta and Grijalva, exhibit
substantial hydropower potential, yet they also face considerable hurdles.
Legal requirements for ecological flows, as demonstrated by the environmental flow
decrees for the Usumacinta River, frequently clash with hydropower operational
demands. Furthermore, indigenous rights and local opposition create additional
complexities for the implementation of infrastructure. Achieving sustainable
hydropower development requires a commitment to prioritizing biodiversity
conservation, respecting indigenous rights, and ensuring equitable distribution of
resources. This approach aims to harmonize energy needs with the preservation of
vital ecosystems and the well-being of local communities. This paper underscores the
urgent need for stronger regulatory interventions to combat illegal surface water
extraction and restore ecological balance. Strict enforcement of ecological flow
requirements in perennial channels is crucial for protecting ecosystems. The
remaining flows should be allocated for consumptive uses, prioritizing human
consumption and essential agriculture.
In conclusion, Mexico faces complex challenges in managing its water resources and
meeting its energy demands. However, proactive and integrated measures that
prioritize sustainability, equity, and resilience can overcome these obstacles. By
embracing innovative solutions and fostering the responsible use of natural
resources, Mexico can secure long-term environmental health and equitable access to
resources for all its regions.
Acknowledgments
This study was part of the “Proyecto conjunto de investigación México-China para la
planeación y desarrollo ambiental y socialmente sustentable del sector de las
pequeñas centrales hidroeléctricas. Etapa 1”, prepared by the Instituto Nacional de
Electricidad y Energías Limpias and the Instituto Mexicano de Tecnología del Agua,
with support from the Consejo Nacional de Ciencia y Tecnología (Conacyt) (currently
Secretaría de Ciencias, Humanidades, Tecnología e Innovación).
References
Aparicio-Mijares J, Lafragua-Contreras J, Gutiérrez-López A,
Mejía-Zarmeño R, Aguilar-Garduño E. 2006. Evaluación de los recursos hídricos.
Elaboración del balance hídrico integral por cuencas hidrográficas. Documento
Técnico del phi-LAC No. 4. United Nations Educational, Scientific and Cultural
Organization (UNESCO), Montevideo, Uruguay.
[ Links ]
Bonsal B, Shrestha RR, Dibike Y, Peters DL, Spence C, Mudryk L, Yang
D. 2020. Western Canadian freshwater availability: Current and future
vulnerabilities. Environmental Reviews 28: 528-545.
https://doi.org/10.1139/er-2020-0040
[ Links ]
Boulanger JP, Leloup J, Penalba O, Rusticucci M, Lafon F, Vargas W.
2005. Observed precipitation in the Paraná-Plata hydrological basin: Long-term
trends, extreme conditions and ENSO teleconnections. Climate Dynamics 24:
393-413. https://doi.org/10.1007/s00382-004-0514-x
[ Links ]
Conagua. 2012. Agenda del agua 2030. Avances y logros 2012. Comisión
Nacional del Agua, Secretaría de Medio Ambiente y Recursos Naturales,
Mexico.
[ Links ]
Conagua. 2019. Estadísticas del agua en México 2019. Comisión
Nacional del Agua, Secretaría de Medio Ambiente y Recursos Naturales,
Mexico.
[ Links ]
Hernández-Espriú A, Reyna-Gutiérrez JA, Sánchez-León E, Cabral-Cano
E, Carrera-Hernández J, Martínez-Santos P, Macías-Medrano S, Falorni G, Colombo
D. 2014. The DRASTIC-Sg model: An extension to the DRASTIC approach for mapping
groundwater vulnerability in aquifers subject to differential land subsidence,
with application to Mexico City. Hydrogeology Journal 22: 1469-1485.
https://doi.org/10.1007/s10040-014-1130-4
[ Links ]
INEGI. n.d. Espacio y datos de México. Mapas. Pendientes del terreno
1:250:000. Instituto Nacional de Estadística y Geografía, Mexico. Available at:
https://www.inegi.org.mx/app/mapa/espacioydatos/default.aspx
[ Links ]
INEGI. 2020. Censo de población y vivienda 2020. Instituto Nacional
de Estadística y Geografía, Mexico. Available at: Available at:
https://inegi.org.mx/programas/cObv/2020/
(accessed September 2021).
[ Links ]
Koshida G, Cohen S, Mortsch L. 2015. Climate and water availability
indicators in Canada: Challenges and a way forward. Part I. Indicators. Canadian
Water Resources Journal/Revue Canadienne des Resources Hydriques 40: 133-145.
https://doi.org/10.1080/07011784.2015.1006023
[ Links ]
Loor YS. 2017. Estudio del balance hídrico superficial de las
cuencas hidrográficas sector San Juan y San Bartolomé en el área de intercepción
con el bosque y vegetación protector Aguarongo. B.Sc. thesis. Universidad
Politécnica Salesiana, Ecuador.
[ Links ]
López-García TG, Manzano MG, Ramírez AI. 2017. Disponibilidad
hídrica bajo escenarios de cambio climático en el Valle de Galeana, Nuevo León,
México. Tecnología y Ciencias del Agua 8: 105-114.
[ Links ]
López-Morales CA. 2017. El estado del agua en México: retos,
oportunidades y perspectivas. In: El agua en México: actores, sectores y
paradigmas para una transformación social-ecológica (Denzin C, Taboada F,
Pacheco-Vega R, Eds.). Fundación Friedrich Ebert, Mexico City.
[ Links ]
Magaña V, Conde C, Sánchez O, Gay C. 1997. Assessment of current and
future regional climate scenarios for Mexico. Climate Research 9: 107-114.
https://doi.org/10.3354/cr009107
[ Links ]
Mekonnen MM, Hoekstra AY. 2016. Four billion people facing severe
water scarcity. Science Advances 2: e1500323.
https://doi.org/10.1126/sciadv.1500323
[ Links ]
Ordóñez-Gálvez JJ. 2011. Balance hídrico superficial. Contribuyendo
al desarrollo de una cultura del agua y la gestión integral de recurso hídrico.
Cartilla técnica. Sociedad Geográfica de Lima, Lima, Peru.
[ Links ]
Paulhus JLH, Kohler MA. 1952. Interpolation of missing precipitation
records. Monthly Weather Review 80: 129-133.
https://doi.org/10.1175/1520-0493(1952)080%3C0129:IOMPR%3E2.0.CO;2
[ Links ]
Ramírez-Villa R, Contreras-Tereza VK, Mejía-Estrada PI, Pita-Díaz O,
Palacios-Fonseca AA, Bravo-Jácome JA. 2022. Conformación y análisis de
climatologías de precipitación y temperaturas para las cuencas hidrológicas de
México. In: XXVI Congreso Nacional de Hidráulica. Asociación Mexicana de
Hidráulica, November 14-18.
[ Links ]
Sánchez San Román FJ. 2022. Evapotransporación. Hidrología,
hidrogeología. Universidad de Salamanca. Available at: Available at:
https://hidrologia.usal.es/temas/Evapotransp.pdf
(accessed February 2022).
[ Links ]
Semarnat. 2015. Norma Oficial Mexicana NOM-011-CONAGUA-2015.
Conservación del recurso agua. Que establece las especificaciones y el método
para determinar la disponibilidad media anual de las aguas nacionales.
Secretaría de Medio Ambiente y Recursos Naturales, Mexico. Diario Oficial de la
Federación, March 27.
[ Links ]
Semarnat. 2020. Acuerdo por el que se actualiza la disponibilidad
media anual de las aguas nacionales superficiales de las 757 cuencas
hidrológicas que comprenden las 37 regiones hidrológicas en que se encuentra
dividido los Estados Unidos Mexicanos. Secretaría de Medio Ambiente y Recursos
Naturales, Mexico. Diario Oficial de la Federación, September
21.
[ Links ]
Silva-Hidalgo H, Aldama ÁA, Martín-Domínguez IR, Alarcón-Herrera MT.
2013. Metodología para la determinación de disponibilidad y déficit de agua
superficial en cuencas hidrológicas: aplicación al caso de la normativa
mexicana. Tecnología y Ciencias del Agua 4: 27-50.
[ Links ]
SINA. 2020. Detalle de las cuencas hidrológicas en México (2020).
Sistema Nacional de Información del Agua 3.0. Available at: https://sinav30.conagua.gob.mx:8080/SINA/?opcion=cuencas
[ Links ]
WMO 2011. Guide to climatological practices. WMO No. 100. World
Meteorological Organization, Geneva. Available at: Available at:
https://community.wmo.int/en/activity-areas/climate/draft-fourth-edition-guide-climatological-practices-wmo-no-100
(accessed March 2022).
[ Links ]
Supplementary material
Table SI.
| Basin |
R2 for precipitation |
RMSE for precipitation |
R2 for maximum temperature |
RMSE for maximum temperature |
R2 for minimum temperature |
RMSE for minimum temperature |
2020-2034 growth rate of consumptive
uses |
| 101 |
0.19 |
113.99 |
0.54 |
0.76 |
0.03 |
0.67 |
0.117 |
| 102 |
0.06 |
97.71 |
0.55 |
0.79 |
0.01 |
0.74 |
0.050 |
| 103 |
0.23 |
128.80 |
0.47 |
0.70 |
0.00 |
0.68 |
0.196 |
| 104 |
0.09 |
117.45 |
0.44 |
0.71 |
0.01 |
0.61 |
0.133 |
| 105 |
0.18 |
110.18 |
0.51 |
0.62 |
0.00 |
0.58 |
0.199 |
| 106 |
0.16 |
118.61 |
0.46 |
0.66 |
0.00 |
0.59 |
0.174 |
| 107 |
0.15 |
86.69 |
0.46 |
0.66 |
0.00 |
0.62 |
0.201 |
| 108 |
0.20 |
106.79 |
0.42 |
0.66 |
0.02 |
0.67 |
0.200 |
| 109 |
0.20 |
136.65 |
0.36 |
0.71 |
0.04 |
0.65 |
0.201 |
| 110 |
0.29 |
78.08 |
0.42 |
0.62 |
0.05 |
0.63 |
0.200 |
| 111 |
0.34 |
76.14 |
0.50 |
0.59 |
0.07 |
0.63 |
0.186 |
| 112 |
0.36 |
80.51 |
0.54 |
0.48 |
0.02 |
0.53 |
0.188 |
| 113 |
0.24 |
60.28 |
0.59 |
0.64 |
0.08 |
0.58 |
0.174 |
| 114 |
0.29 |
62.09 |
0.56 |
0.49 |
0.05 |
0.56 |
0.200 |
| 115 |
0.12 |
68.44 |
0.60 |
0.59 |
0.06 |
0.62 |
0.202 |
| 116 |
0.32 |
80.12 |
0.51 |
0.81 |
0.08 |
0.58 |
0.202 |
| 201 |
0.31 |
43.73 |
0.48 |
0.95 |
0.08 |
0.67 |
0.203 |
| 202 |
0.32 |
44.97 |
0.50 |
1.19 |
0.06 |
0.66 |
0.203 |
| 203 |
0.15 |
50.70 |
0.49 |
1.03 |
0.02 |
0.59 |
0.203 |
| 204 |
0.09 |
63.75 |
0.46 |
0.97 |
0.01 |
0.54 |
0.203 |
| 205 |
0.11 |
56.75 |
0.42 |
0.90 |
0.00 |
0.48 |
0.203 |
| 206 |
0.14 |
31.78 |
0.44 |
0.88 |
0.00 |
0.60 |
0.203 |
| 207 |
0.12 |
33.50 |
0.35 |
0.65 |
0.03 |
0.62 |
0.203 |
| 208 |
0.09 |
35.64 |
0.16 |
0.64 |
0.01 |
0.63 |
0.203 |
| 209 |
0.08 |
38.01 |
0.04 |
0.66 |
0.12 |
0.48 |
0.203 |
| 210 |
0.15 |
73.93 |
0.06 |
0.65 |
0.16 |
0.51 |
0.203 |
| 211 |
0.11 |
26.61 |
0.08 |
0.64 |
0.16 |
0.67 |
0.203 |
| 212 |
0.06 |
32.05 |
0.06 |
0.55 |
0.07 |
0.66 |
0.236 |
| 213 |
0.01 |
74.21 |
0.03 |
0.63 |
0.03 |
0.67 |
0.175 |
| 214 |
0.02 |
66.38 |
0.33 |
0.56 |
0.01 |
0.64 |
0.195 |
| 215 |
0.15 |
50.62 |
0.51 |
0.59 |
0.04 |
0.69 |
0.169 |
| 216 |
0.01 |
58.70 |
0.51 |
0.58 |
0.00 |
0.56 |
0.404 |
| 301 |
0.02 |
104.90 |
0.37 |
0.59 |
0.00 |
0.73 |
0.656 |
| 302 |
0.05 |
141.39 |
0.36 |
0.73 |
0.06 |
0.83 |
0.657 |
| 303 |
0.10 |
150.00 |
0.23 |
0.62 |
0.08 |
0.80 |
0.318 |
| 304 |
0.11 |
166.04 |
0.33 |
0.52 |
0.17 |
0.83 |
0.268 |
| 305 |
0.08 |
170.55 |
0.03 |
0.58 |
0.16 |
0.70 |
0.283 |
| 306 |
0.11 |
170.52 |
0.06 |
0.63 |
0.14 |
0.67 |
0.227 |
| 307 |
0.07 |
190.32 |
0.02 |
0.55 |
0.07 |
0.67 |
0.223 |
| 308 |
0.06 |
160.42 |
0.29 |
0.49 |
0.00 |
0.63 |
0.258 |
| 309 |
0.00 |
156.44 |
0.40 |
0.44 |
0.13 |
0.65 |
0.222 |
| 310 |
0.03 |
139.17 |
0.33 |
0.56 |
0.03 |
0.72 |
0.225 |
| 311 |
0.02 |
144.76 |
0.33 |
0.44 |
0.06 |
0.69 |
0.401 |
| 312 |
0.03 |
174.63 |
0.27 |
0.34 |
0.10 |
0.62 |
0.330 |
| 313 |
0.02 |
174.52 |
0.09 |
0.37 |
0.04 |
0.62 |
0.222 |
| 314 |
0.02 |
212.99 |
0.36 |
0.43 |
0.01 |
0.69 |
0.180 |
| 315 |
0.10 |
163.26 |
0.36 |
0.43 |
0.03 |
0.65 |
0.257 |
| 401 |
0.24 |
67.71 |
0.43 |
0.89 |
0.14 |
0.65 |
0.663 |
| 402 |
0.02 |
76.26 |
0.37 |
0.76 |
0.12 |
0.55 |
0.668 |
| 403 |
0.21 |
58.75 |
0.33 |
0.89 |
0.04 |
0.58 |
0.654 |
| 404 |
0.10 |
65.23 |
0.33 |
0.59 |
0.08 |
0.41 |
0.628 |
| 405 |
0.27 |
61.28 |
0.42 |
0.58 |
0.07 |
0.46 |
0.441 |
| 406 |
0.20 |
52.96 |
0.39 |
0.61 |
0.13 |
0.46 |
0.203 |
| 407 |
0.18 |
65.96 |
0.40 |
0.90 |
0.12 |
0.44 |
0.203 |
| 408 |
0.14 |
106.05 |
0.53 |
0.59 |
0.09 |
0.78 |
0.202 |
| 501 |
0.12 |
59.71 |
0.38 |
1.03 |
0.03 |
0.47 |
0.203 |
| 502 |
0.14 |
45.82 |
0.36 |
0.80 |
0.00 |
0.54 |
0.203 |
| 503 |
0.14 |
34.47 |
0.35 |
0.70 |
0.01 |
0.53 |
0.203 |
| 504 |
0.05 |
34.15 |
0.16 |
0.58 |
0.15 |
0.45 |
0.203 |
| 505 |
0.01 |
28.14 |
0.14 |
0.46 |
0.31 |
0.50 |
0.203 |
| 506 |
0.06 |
69.06 |
0.23 |
0.46 |
0.25 |
0.63 |
0.203 |
| 507 |
0.11 |
79.43 |
0.31 |
0.53 |
0.18 |
0.62 |
0.203 |
| 508 |
0.07 |
89.67 |
0.33 |
0.80 |
0.04 |
0.60 |
0.320 |
| 509 |
0.05 |
155.57 |
0.31 |
0.73 |
0.08 |
0.55 |
0.088 |
| 510 |
0.00 |
98.54 |
0.32 |
0.43 |
0.08 |
0.53 |
0.321 |
| 511 |
0.13 |
132.03 |
0.36 |
0.45 |
0.13 |
0.56 |
0.326 |
| 512 |
0.12 |
128.01 |
0.41 |
0.51 |
0.11 |
0.53 |
0.645 |
| 513 |
0.14 |
117.05 |
0.43 |
0.51 |
0.14 |
0.55 |
0.053 |
| 514 |
0.13 |
154.57 |
0.46 |
0.55 |
0.04 |
0.55 |
0.056 |
| 515 |
0.22 |
224.00 |
0.32 |
0.51 |
0.03 |
0.61 |
0.089 |
| 601 |
0.01 |
189.34 |
0.53 |
0.58 |
0.00 |
0.70 |
0.447 |
| 602 |
0.01 |
182.49 |
0.40 |
0.50 |
0.00 |
0.62 |
0.378 |
| 603 |
0.01 |
152.03 |
0.56 |
0.39 |
0.00 |
0.64 |
0.171 |
| 604 |
0.01 |
175.47 |
0.22 |
0.35 |
0.04 |
0.62 |
0.213 |
| 605 |
0.03 |
207.01 |
0.43 |
0.35 |
0.27 |
0.61 |
0.281 |
| 606 |
0.01 |
136.81 |
0.32 |
0.52 |
0.13 |
0.54 |
0.285 |
| 607 |
0.00 |
131.74 |
0.20 |
0.54 |
0.01 |
0.58 |
0.438 |
| 608 |
0.09 |
152.31 |
0.00 |
0.90 |
0.00 |
0.55 |
0.229 |
| 609 |
0.17 |
179.07 |
0.09 |
0.65 |
0.05 |
0.65 |
0.262 |
| 610 |
0.05 |
205.02 |
0.01 |
1.15 |
0.21 |
0.63 |
0.661 |
| 611 |
0.19 |
190.41 |
0.30 |
0.53 |
0.09 |
0.66 |
0.692 |
| 612 |
0.18 |
159.22 |
0.10 |
0.51 |
0.05 |
0.65 |
0.660 |
| 613 |
0.09 |
112.22 |
0.10 |
0.61 |
0.00 |
0.65 |
0.661 |
| 614 |
0.09 |
96.70 |
0.27 |
0.63 |
0.01 |
0.61 |
0.483 |
| 701 |
0.17 |
39.20 |
0.45 |
0.86 |
0.12 |
0.59 |
0.280 |
| 702 |
0.10 |
169.26 |
0.49 |
0.77 |
0.20 |
0.77 |
0.300 |
| 703 |
0.05 |
113.97 |
0.57 |
1.03 |
0.14 |
0.67 |
0.905 |
| 704 |
0.10 |
241.85 |
0.56 |
0.62 |
0.36 |
0.51 |
0.174 |
| 801 |
0.12 |
91.45 |
0.43 |
0.53 |
0.13 |
0.35 |
0.017 |
| 802 |
0.19 |
59.57 |
0.38 |
0.54 |
0.09 |
0.35 |
0.072 |
| 803 |
0.09 |
129.35 |
0.57 |
0.61 |
0.39 |
0.39 |
0.339 |
| 804 |
0.01 |
92.64 |
0.58 |
0.50 |
0.39 |
0.46 |
-0.102 |
| 805 |
0.02 |
68.13 |
0.35 |
0.51 |
0.19 |
0.37 |
-0.243 |
| 806 |
0.08 |
30.95 |
0.48 |
0.63 |
0.16 |
0.53 |
0.510 |
| 807 |
0.12 |
36.15 |
0.43 |
0.60 |
0.13 |
0.37 |
0.408 |
| 808 |
0.15 |
65.07 |
0.44 |
0.56 |
0.10 |
0.36 |
0.300 |
| 809 |
0.05 |
77.81 |
0.39 |
0.55 |
0.12 |
0.41 |
0.072 |
| 901 |
0.03 |
104.53 |
0.56 |
0.57 |
0.09 |
0.38 |
0.601 |
| 902 |
0.02 |
122.08 |
0.47 |
0.73 |
0.13 |
0.41 |
0.458 |
| 903 |
0.01 |
100.77 |
0.53 |
0.68 |
0.12 |
0.41 |
0.379 |
| 904 |
0.00 |
109.34 |
0.44 |
0.55 |
0.14 |
0.44 |
0.019 |
| 905 |
0.00 |
81.66 |
0.49 |
0.40 |
0.00 |
0.45 |
0.481 |
| 906 |
0.00 |
104.44 |
0.30 |
0.59 |
0.00 |
0.49 |
0.590 |
| 907 |
0.04 |
107.27 |
0.59 |
0.76 |
0.09 |
0.46 |
0.421 |
| 908 |
0.02 |
146.05 |
0.58 |
0.60 |
0.02 |
0.49 |
0.059 |
| 909 |
0.04 |
126.68 |
0.47 |
0.55 |
0.00 |
0.40 |
0.449 |
| 910 |
0.00 |
98.40 |
0.31 |
0.52 |
0.02 |
0.52 |
0.060 |
| 911 |
0.00 |
162.45 |
0.36 |
0.60 |
0.08 |
0.42 |
0.449 |
| 912 |
0.00 |
188.91 |
0.48 |
0.63 |
0.13 |
0.52 |
-0.046 |
| 913 |
0.01 |
233.12 |
0.44 |
0.68 |
0.01 |
0.39 |
0.492 |
| 914 |
0.09 |
124.05 |
0.36 |
0.60 |
0.09 |
0.34 |
0.449 |
| 915 |
0.00 |
185.58 |
0.37 |
0.72 |
0.00 |
0.37 |
0.495 |
| 916 |
0.03 |
158.70 |
0.54 |
0.54 |
0.06 |
0.47 |
-0.063 |
| 1001 |
0.43 |
471.47 |
0.16 |
0.27 |
0.28 |
0.61 |
0.150 |
| 1002 |
0.01 |
122.72 |
0.36 |
0.54 |
0.18 |
0.66 |
-0.117 |
| 1003 |
0.25 |
184.87 |
0.25 |
0.41 |
0.15 |
0.68 |
0.358 |
| 1004 |
0.05 |
134.36 |
0.17 |
0.49 |
0.14 |
0.71 |
0.626 |
| 1005 |
0.00 |
204.94 |
0.09 |
0.38 |
0.00 |
0.51 |
0.017 |
| 1006 |
0.00 |
152.16 |
0.08 |
0.43 |
0.02 |
0.52 |
-0.131 |
| 1007 |
0.05 |
164.48 |
0.06 |
0.45 |
0.30 |
0.51 |
0.013 |
| 1008 |
0.00 |
174.42 |
0.25 |
0.41 |
0.22 |
0.63 |
-0.235 |
| 1009 |
0.03 |
129.33 |
0.33 |
0.46 |
0.51 |
0.43 |
0.210 |
| 1010 |
0.03 |
198.63 |
0.38 |
0.41 |
0.36 |
0.52 |
0.209 |
| 1011 |
0.00 |
142.55 |
0.42 |
0.36 |
0.13 |
0.58 |
0.038 |
| 1012 |
0.05 |
217.49 |
0.45 |
0.54 |
0.28 |
0.43 |
0.131 |
| 1013 |
0.04 |
248.35 |
0.49 |
0.41 |
0.20 |
0.35 |
-0.013 |
| 1014 |
0.04 |
177.45 |
0.60 |
0.43 |
0.14 |
0.41 |
0.551 |
| 1015 |
0.02 |
142.62 |
0.43 |
0.51 |
0.12 |
0.39 |
-0.094 |
| 1016 |
0.07 |
209.44 |
0.17 |
0.36 |
0.14 |
0.60 |
0.154 |
| 1017 |
0.00 |
117.48 |
0.36 |
0.50 |
0.17 |
0.67 |
0.106 |
| 1018 |
0.02 |
237.25 |
0.33 |
0.39 |
0.30 |
0.43 |
0.342 |
| 1019 |
0.05 |
145.11 |
0.34 |
0.47 |
0.12 |
0.38 |
0.125 |
| 1020 |
0.12 |
152.67 |
0.16 |
0.47 |
0.01 |
0.52 |
0.282 |
| 1021 |
0.04 |
147.42 |
0.13 |
0.43 |
0.00 |
0.50 |
-0.049 |
| 1022 |
0.01 |
198.27 |
0.21 |
0.39 |
0.06 |
0.51 |
0.213 |
| 1023 |
0.01 |
218.90 |
0.30 |
0.51 |
0.03 |
0.56 |
-0.012 |
| 1024 |
0.00 |
152.07 |
0.46 |
0.52 |
0.03 |
0.48 |
-0.149 |
| 1025 |
0.00 |
102.78 |
0.21 |
0.51 |
0.01 |
0.56 |
-0.128 |
| 1026 |
0.02 |
139.46 |
0.07 |
0.45 |
0.03 |
0.53 |
-0.271 |
| 1027 |
0.04 |
126.51 |
0.21 |
0.54 |
0.00 |
0.52 |
-0.045 |
| 1028 |
0.15 |
237.21 |
0.45 |
0.51 |
0.12 |
0.61 |
-0.113 |
| 1029 |
0.02 |
201.95 |
0.36 |
0.39 |
0.20 |
0.69 |
-0.331 |
| 1030 |
0.08 |
138.61 |
0.41 |
0.54 |
0.03 |
0.57 |
-0.012 |
| 1101 |
0.00 |
206.05 |
0.04 |
0.63 |
0.04 |
0.82 |
0.437 |
| 1102 |
0.00 |
181.65 |
0.10 |
0.64 |
0.03 |
0.83 |
0.145 |
| 1103 |
0.00 |
137.00 |
0.06 |
1.41 |
0.02 |
0.60 |
0.158 |
| 1104 |
0.01 |
131.21 |
0.20 |
0.93 |
0.06 |
0.60 |
-0.191 |
| 1105 |
0.05 |
162.48 |
0.01 |
0.87 |
0.02 |
0.62 |
0.164 |
| 1106 |
0.00 |
140.52 |
0.10 |
0.75 |
0.02 |
0.66 |
0.177 |
| 1107 |
0.00 |
160.23 |
0.30 |
0.80 |
0.03 |
0.63 |
-0.186 |
| 1108 |
0.05 |
147.11 |
0.24 |
1.00 |
0.03 |
0.62 |
-0.034 |
| 1109 |
0.02 |
164.88 |
0.16 |
0.44 |
0.32 |
0.58 |
-0.178 |
| 1110 |
0.02 |
145.02 |
0.03 |
0.55 |
0.29 |
0.55 |
-0.096 |
| 1111 |
0.17 |
171.18 |
0.02 |
0.57 |
0.21 |
0.55 |
0.173 |
| 1112 |
0.25 |
264.09 |
0.00 |
0.50 |
0.09 |
0.67 |
0.142 |
| 1113 |
0.03 |
186.84 |
0.45 |
0.44 |
0.01 |
0.64 |
0.240 |
| 1114 |
0.01 |
203.03 |
0.05 |
0.60 |
0.08 |
0.71 |
0.612 |
| 1115 |
0.06 |
207.17 |
0.00 |
0.72 |
0.06 |
0.80 |
0.540 |
| 1116 |
0.01 |
182.03 |
0.12 |
0.45 |
0.03 |
0.65 |
0.452 |
| 1117 |
0.07 |
170.06 |
0.02 |
0.55 |
0.13 |
0.73 |
0.182 |
| 1118 |
0.08 |
228.94 |
0.04 |
0.44 |
0.00 |
0.71 |
0.126 |
| 1119 |
0.00 |
207.05 |
0.20 |
0.56 |
0.01 |
0.83 |
0.191 |
| 1120 |
0.01 |
201.93 |
0.26 |
0.41 |
0.00 |
0.58 |
0.416 |
| 1121 |
0.01 |
211.26 |
0.30 |
0.45 |
0.00 |
0.58 |
0.417 |
| 1122 |
0.03 |
178.50 |
0.25 |
0.43 |
0.00 |
0.55 |
0.425 |
| 1123 |
0.01 |
179.54 |
0.40 |
0.45 |
0.01 |
0.63 |
0.216 |
| 1124 |
0.04 |
254.38 |
0.06 |
0.57 |
0.13 |
0.73 |
0.133 |
| 1125 |
0.02 |
254.47 |
0.01 |
0.70 |
0.08 |
0.83 |
0.162 |
| 1126 |
0.00 |
171.52 |
0.20 |
0.55 |
0.01 |
0.80 |
0.405 |
| 1201 |
0.27 |
106.13 |
0.53 |
0.45 |
0.40 |
0.36 |
0.064 |
| 1202 |
0.16 |
190.93 |
0.47 |
0.56 |
0.18 |
0.38 |
-0.057 |
| 1203 |
0.02 |
131.57 |
0.22 |
0.45 |
0.00 |
0.31 |
-0.085 |
| 1204 |
0.15 |
133.69 |
0.26 |
0.37 |
0.00 |
0.41 |
-0.026 |
| 1205 |
0.00 |
147.93 |
0.44 |
0.42 |
0.02 |
0.37 |
-0.053 |
| 1206 |
0.02 |
145.44 |
0.51 |
0.45 |
0.01 |
0.46 |
-0.230 |
| 1207 |
0.06 |
151.61 |
0.51 |
0.51 |
0.00 |
0.37 |
0.263 |
| 1208 |
0.00 |
94.53 |
0.41 |
0.49 |
0.00 |
0.39 |
0.188 |
| 1209 |
0.03 |
185.38 |
0.32 |
0.50 |
0.01 |
0.38 |
-0.028 |
| 1210 |
0.03 |
203.22 |
0.56 |
0.47 |
0.02 |
0.48 |
-0.235 |
| 1211 |
0.09 |
173.65 |
0.11 |
0.50 |
0.03 |
0.53 |
-0.045 |
| 1212 |
0.00 |
150.24 |
0.51 |
0.37 |
0.07 |
0.41 |
0.375 |
| 1213 |
0.06 |
159.23 |
0.23 |
0.39 |
0.01 |
0.41 |
-0.143 |
| 1214 |
0.01 |
171.84 |
0.01 |
0.40 |
0.05 |
0.60 |
-0.010 |
| 1215 |
0.02 |
235.95 |
0.33 |
0.38 |
0.01 |
0.52 |
0.042 |
| 1216 |
0.00 |
142.10 |
0.38 |
0.38 |
0.05 |
0.50 |
0.670 |
| 1217 |
0.00 |
147.45 |
0.43 |
0.39 |
0.00 |
0.54 |
0.157 |
| 1218 |
0.00 |
96.33 |
0.57 |
0.41 |
0.16 |
0.38 |
0.534 |
| 1219 |
0.03 |
124.69 |
0.68 |
0.50 |
0.05 |
0.42 |
0.121 |
| 1220 |
0.08 |
162.28 |
0.27 |
0.52 |
0.14 |
0.52 |
0.067 |
| 1221 |
0.07 |
200.89 |
0.43 |
0.49 |
0.09 |
0.49 |
0.202 |
| 1222 |
0.11 |
151.27 |
0.36 |
0.57 |
0.00 |
0.47 |
0.145 |
| 1223 |
0.12 |
214.76 |
0.34 |
0.56 |
0.04 |
0.47 |
0.248 |
| 1224 |
0.05 |
183.06 |
0.32 |
0.56 |
0.11 |
0.53 |
0.089 |
| 1225 |
0.05 |
178.21 |
0.39 |
0.72 |
0.04 |
0.58 |
0.133 |
| 1226 |
0.03 |
147.50 |
0.35 |
0.78 |
0.13 |
0.58 |
0.042 |
| 1227 |
0.06 |
178.00 |
0.40 |
0.79 |
0.03 |
0.51 |
0.075 |
| 1228 |
0.00 |
177.62 |
0.44 |
0.83 |
0.20 |
0.61 |
0.085 |
| 1229 |
0.03 |
192.43 |
0.11 |
0.55 |
0.10 |
0.54 |
0.058 |
| 1230 |
0.01 |
157.89 |
0.13 |
0.51 |
0.01 |
0.52 |
0.043 |
| 1231 |
0.00 |
143.89 |
0.29 |
0.73 |
0.08 |
0.56 |
0.112 |
| 1232 |
0.02 |
157.39 |
0.27 |
0.46 |
0.01 |
0.53 |
0.159 |
| 1233 |
0.02 |
185.88 |
0.41 |
0.48 |
0.32 |
0.61 |
0.029 |
| 1234 |
0.02 |
181.88 |
0.36 |
0.52 |
0.28 |
0.62 |
-0.038 |
| 1235 |
0.05 |
161.54 |
0.32 |
0.58 |
0.05 |
0.59 |
0.456 |
| 1236 |
0.00 |
121.98 |
0.35 |
0.60 |
0.02 |
0.59 |
0.315 |
| 1237 |
0.07 |
136.75 |
0.23 |
0.44 |
0.00 |
0.49 |
0.233 |
| 1238 |
0.05 |
141.71 |
0.16 |
0.57 |
0.01 |
0.58 |
0.209 |
| 1239 |
0.02 |
129.69 |
0.17 |
0.59 |
0.00 |
0.56 |
0.355 |
| 1240 |
0.03 |
138.08 |
0.00 |
0.64 |
0.07 |
0.63 |
0.359 |
| 1241 |
0.02 |
158.19 |
0.38 |
0.60 |
0.18 |
0.70 |
-0.114 |
| 1242 |
0.05 |
134.18 |
0.48 |
0.62 |
0.05 |
0.67 |
0.979 |
| 1243 |
0.00 |
182.26 |
0.47 |
0.66 |
0.02 |
0.57 |
0.049 |
| 1244 |
0.00 |
165.12 |
0.48 |
0.61 |
0.14 |
0.63 |
-0.010 |
| 1245 |
0.00 |
132.52 |
0.36 |
0.63 |
0.00 |
0.61 |
0.269 |
| 1246 |
0.00 |
168.14 |
0.12 |
0.54 |
0.20 |
0.60 |
0.041 |
| 1247 |
0.05 |
168.90 |
0.24 |
0.58 |
0.09 |
0.54 |
0.194 |
| 1248 |
0.10 |
227.00 |
0.09 |
0.45 |
0.21 |
0.55 |
0.172 |
| 1249 |
0.00 |
243.75 |
0.19 |
0.44 |
0.13 |
0.51 |
0.322 |
| 1250 |
0.00 |
218.78 |
0.00 |
0.52 |
0.20 |
0.77 |
0.413 |
| 1251 |
0.05 |
300.90 |
0.07 |
0.46 |
0.02 |
0.54 |
0.373 |
| 1252 |
0.05 |
276.58 |
0.18 |
0.44 |
0.03 |
0.57 |
0.249 |
| 1253 |
0.03 |
133.78 |
0.06 |
0.59 |
0.07 |
0.50 |
0.365 |
| 1254 |
0.05 |
114.59 |
0.12 |
0.59 |
0.08 |
0.45 |
0.124 |
| 1255 |
0.05 |
163.12 |
0.22 |
0.48 |
0.04 |
0.56 |
0.342 |
| 1256 |
0.00 |
161.63 |
0.27 |
0.39 |
0.09 |
0.46 |
0.352 |
| 1257 |
0.04 |
138.25 |
0.33 |
0.37 |
0.09 |
0.46 |
0.289 |
| 1258 |
0.02 |
175.06 |
0.28 |
0.44 |
0.02 |
0.49 |
0.276 |
| 1301 |
0.03 |
379.58 |
0.08 |
0.47 |
0.04 |
0.58 |
0.244 |
| 1302 |
0.30 |
150.94 |
0.32 |
0.41 |
0.01 |
0.69 |
0.473 |
| 1303 |
0.27 |
248.28 |
0.29 |
0.43 |
0.00 |
0.65 |
0.259 |
| 1304 |
0.04 |
175.76 |
0.21 |
0.43 |
0.03 |
0.58 |
0.171 |
| 1305 |
0.08 |
147.64 |
0.03 |
0.49 |
0.05 |
0.60 |
0.094 |
| 1306 |
0.02 |
252.62 |
0.30 |
0.41 |
0.01 |
0.71 |
0.762 |
| 1401 |
0.09 |
121.05 |
0.01 |
0.54 |
0.13 |
0.56 |
0.618 |
| 1402 |
0.04 |
134.76 |
0.02 |
0.55 |
0.06 |
0.51 |
0.618 |
| 1403 |
0.08 |
324.52 |
0.01 |
0.50 |
0.44 |
0.72 |
0.231 |
| 1404 |
0.03 |
221.26 |
0.17 |
0.37 |
0.23 |
0.53 |
0.361 |
| 1405 |
0.09 |
153.00 |
0.01 |
0.44 |
0.44 |
0.62 |
0.395 |
| 1406 |
0.00 |
153.67 |
0.10 |
0.41 |
0.17 |
0.68 |
0.246 |
| 1407 |
0.13 |
204.46 |
0.21 |
0.36 |
0.04 |
0.61 |
0.361 |
| 1408 |
0.02 |
165.04 |
0.33 |
0.40 |
0.17 |
0.60 |
0.374 |
| 1409 |
0.19 |
146.75 |
0.15 |
0.40 |
0.03 |
0.65 |
0.235 |
| 1501 |
0.00 |
281.59 |
0.26 |
0.41 |
0.03 |
0.74 |
0.857 |
| 1502 |
0.13 |
403.74 |
0.16 |
0.41 |
0.07 |
0.76 |
0.858 |
| 1503 |
0.18 |
196.61 |
0.13 |
0.42 |
0.09 |
0.74 |
0.556 |
| 1504 |
0.07 |
189.38 |
0.02 |
0.41 |
0.01 |
0.65 |
0.545 |
| 1505 |
0.09 |
276.04 |
0.06 |
0.49 |
0.17 |
0.78 |
0.604 |
| 1506 |
0.02 |
247.79 |
0.05 |
0.44 |
0.09 |
0.64 |
0.758 |
| 1507 |
0.01 |
397.81 |
0.00 |
0.44 |
0.10 |
0.78 |
0.849 |
| 1508 |
0.08 |
463.66 |
0.01 |
0.51 |
0.05 |
0.67 |
0.857 |
| 1509 |
0.24 |
396.59 |
0.01 |
0.59 |
0.02 |
0.80 |
0.781 |
| 1510 |
0.06 |
231.39 |
0.07 |
0.57 |
0.01 |
0.86 |
0.177 |
| 1511 |
0.15 |
259.47 |
0.13 |
0.43 |
0.05 |
0.87 |
0.103 |
| 1601 |
0.01 |
213.40 |
0.05 |
0.45 |
0.00 |
0.51 |
0.325 |
| 1602 |
0.02 |
229.19 |
0.13 |
0.41 |
0.02 |
0.55 |
0.267 |
| 1603 |
0.02 |
187.72 |
0.12 |
0.43 |
0.09 |
0.53 |
0.338 |
| 1604 |
0.02 |
152.02 |
0.30 |
0.31 |
0.01 |
0.56 |
0.316 |
| 1605 |
0.00 |
161.22 |
0.14 |
0.42 |
0.00 |
0.70 |
0.218 |
| 1606 |
0.09 |
215.89 |
0.12 |
0.32 |
0.05 |
0.67 |
0.158 |
| 1607 |
0.15 |
130.94 |
0.18 |
0.48 |
0.02 |
0.48 |
0.341 |
| 1608 |
0.28 |
150.77 |
0.05 |
0.39 |
0.02 |
0.64 |
0.386 |
| 1609 |
0.00 |
158.02 |
0.12 |
0.38 |
0.07 |
0.62 |
0.181 |
| 1610 |
0.05 |
220.11 |
0.39 |
0.56 |
0.11 |
0.63 |
0.052 |
| 1701 |
0.01 |
213.09 |
0.40 |
0.44 |
0.04 |
0.58 |
0.491 |
| 1702 |
0.12 |
199.72 |
0.46 |
0.33 |
0.02 |
0.55 |
0.651 |
| 1703 |
0.02 |
299.68 |
0.33 |
0.43 |
0.00 |
0.54 |
0.554 |
| 1704 |
0.00 |
310.04 |
0.34 |
0.36 |
0.04 |
0.53 |
0.377 |
| 1705 |
0.05 |
509.45 |
0.26 |
0.39 |
0.01 |
0.53 |
0.165 |
| 1706 |
0.17 |
396.24 |
0.18 |
0.44 |
0.00 |
0.53 |
-0.102 |
| 1801 |
0.09 |
86.25 |
0.09 |
0.41 |
0.16 |
0.43 |
0.080 |
| 1802 |
0.23 |
187.14 |
0.44 |
0.39 |
0.07 |
0.49 |
0.118 |
| 1803 |
0.12 |
569.24 |
0.01 |
0.21 |
0.45 |
0.43 |
0.074 |
| 1804 |
0.33 |
78.55 |
0.11 |
0.30 |
0.07 |
0.49 |
0.249 |
| 1805 |
0.18 |
144.40 |
0.08 |
0.30 |
0.07 |
0.56 |
0.297 |
| 1806 |
0.18 |
69.42 |
0.02 |
0.44 |
0.22 |
0.39 |
0.379 |
| 1807 |
0.01 |
140.67 |
0.51 |
0.49 |
0.01 |
0.39 |
0.035 |
| 1808 |
0.00 |
110.73 |
0.35 |
0.33 |
0.45 |
0.51 |
0.213 |
| 1809 |
0.08 |
195.97 |
0.52 |
0.39 |
0.10 |
0.44 |
0.177 |
| 1810 |
0.00 |
187.83 |
0.53 |
0.55 |
0.00 |
0.53 |
0.661 |
| 1811 |
0.01 |
110.08 |
0.28 |
0.38 |
0.03 |
0.52 |
0.143 |
| 1812 |
0.12 |
146.11 |
0.07 |
0.35 |
0.05 |
0.46 |
0.094 |
| 1813 |
0.11 |
206.42 |
0.56 |
0.39 |
0.02 |
0.41 |
0.351 |
| 1814 |
0.01 |
126.44 |
0.66 |
0.42 |
0.13 |
0.38 |
0.697 |
| 1815 |
0.11 |
71.28 |
0.32 |
0.44 |
0.06 |
0.49 |
0.356 |
| 1901 |
0.15 |
194.27 |
0.10 |
0.41 |
0.00 |
0.49 |
-0.239 |
| 1902 |
0.19 |
589.09 |
0.00 |
0.42 |
0.12 |
0.55 |
-0.271 |
| 1903 |
0.03 |
289.55 |
0.05 |
0.42 |
0.00 |
0.46 |
-0.264 |
| 1904 |
0.02 |
205.72 |
0.00 |
0.39 |
0.08 |
0.41 |
-0.249 |
| 1905 |
0.03 |
555.66 |
0.10 |
0.39 |
0.29 |
0.50 |
-0.269 |
| 1906 |
0.01 |
249.44 |
0.00 |
0.40 |
0.03 |
0.42 |
-0.026 |
| 1907 |
0.03 |
405.05 |
0.01 |
0.38 |
0.08 |
0.40 |
-0.041 |
| 1908 |
0.33 |
404.51 |
0.12 |
0.39 |
0.35 |
0.41 |
-0.174 |
| 1909 |
0.29 |
361.23 |
0.06 |
0.36 |
0.38 |
0.42 |
-0.224 |
| 1910 |
0.20 |
281.98 |
0.01 |
0.38 |
0.12 |
0.43 |
-0.106 |
| 1911 |
0.01 |
236.69 |
0.01 |
0.39 |
0.09 |
0.42 |
-0.266 |
| 1912 |
0.01 |
390.10 |
0.03 |
0.45 |
0.37 |
0.40 |
-0.270 |
| 1913 |
0.00 |
226.82 |
0.02 |
0.58 |
0.05 |
0.38 |
-0.223 |
| 1914 |
0.03 |
240.67 |
0.00 |
0.58 |
0.07 |
0.35 |
-0.243 |
| 1915 |
0.03 |
445.79 |
0.10 |
0.66 |
0.31 |
0.37 |
-0.266 |
| 1916 |
0.00 |
546.82 |
0.03 |
0.58 |
0.02 |
0.38 |
-0.096 |
| 1917 |
0.03 |
517.59 |
0.09 |
0.67 |
0.02 |
0.35 |
-0.261 |
| 1918 |
0.01 |
321.57 |
0.20 |
0.91 |
0.24 |
0.34 |
-0.272 |
| 1919 |
0.06 |
367.68 |
0.09 |
0.61 |
0.01 |
0.38 |
-0.179 |
| 1920 |
0.14 |
262.09 |
0.01 |
0.52 |
0.00 |
0.40 |
-0.204 |
| 1921 |
0.04 |
565.18 |
0.00 |
0.49 |
0.34 |
0.19 |
-0.214 |
| 1922 |
0.05 |
333.83 |
0.00 |
0.53 |
0.00 |
0.41 |
-0.147 |
| 1923 |
0.03 |
239.66 |
0.09 |
0.48 |
0.04 |
0.36 |
-0.245 |
| 1924 |
0.04 |
440.98 |
0.20 |
0.37 |
0.36 |
0.19 |
-0.244 |
| 1925 |
0.16 |
395.93 |
0.33 |
0.51 |
0.03 |
0.24 |
-0.117 |
| 1926 |
0.17 |
287.78 |
0.36 |
0.45 |
0.23 |
0.25 |
0.094 |
| 1927 |
0.00 |
636.65 |
0.31 |
0.49 |
0.39 |
0.21 |
0.384 |
| 1928 |
0.01 |
271.79 |
0.53 |
0.31 |
0.27 |
0.29 |
0.389 |
| 2001 |
0.07 |
561.51 |
0.11 |
0.39 |
0.54 |
0.23 |
0.575 |
| 2002 |
0.23 |
336.09 |
0.16 |
0.33 |
0.64 |
0.28 |
0.114 |
| 2003 |
0.06 |
703.82 |
0.30 |
0.26 |
0.60 |
0.33 |
0.344 |
| 2004 |
0.03 |
389.57 |
0.10 |
0.68 |
0.41 |
0.24 |
0.417 |
| 2005 |
0.17 |
637.99 |
0.35 |
0.42 |
0.37 |
0.27 |
0.592 |
| 2006 |
0.08 |
468.86 |
0.52 |
0.36 |
0.28 |
0.36 |
0.467 |
| 2007 |
0.01 |
266.66 |
0.37 |
0.44 |
0.26 |
0.40 |
0.463 |
| 2008 |
0.01 |
446.10 |
0.39 |
0.49 |
0.39 |
0.35 |
0.514 |
| 2009 |
0.01 |
450.45 |
0.12 |
0.61 |
0.08 |
0.41 |
0.243 |
| 2010 |
0.06 |
596.09 |
0.05 |
0.69 |
0.05 |
0.42 |
0.516 |
| 2011 |
0.20 |
857.83 |
0.02 |
0.71 |
0.14 |
0.40 |
0.537 |
| 2012 |
0.23 |
590.80 |
0.00 |
1.24 |
0.01 |
0.43 |
0.491 |
| 2013 |
0.31 |
1092.96 |
0.04 |
0.65 |
0.20 |
0.42 |
0.372 |
| 2014 |
0.11 |
865.86 |
0.05 |
0.58 |
0.23 |
0.51 |
0.120 |
| 2015 |
0.01 |
833.98 |
0.00 |
0.64 |
0.00 |
0.46 |
-0.029 |
| 2016 |
0.01 |
686.05 |
0.01 |
0.62 |
0.04 |
0.44 |
0.514 |
| 2017 |
0.22 |
434.28 |
0.00 |
0.69 |
0.00 |
0.44 |
0.650 |
| 2018 |
0.10 |
327.73 |
0.00 |
0.70 |
0.02 |
0.45 |
0.565 |
| 2019 |
0.09 |
405.38 |
0.02 |
0.63 |
0.00 |
0.47 |
0.236 |
| 2020 |
0.35 |
431.94 |
0.00 |
0.67 |
0.00 |
0.45 |
0.438 |
| 2021 |
0.16 |
358.65 |
0.00 |
0.69 |
0.01 |
0.47 |
0.429 |
| 2022 |
0.01 |
388.46 |
0.00 |
0.71 |
0.02 |
0.46 |
0.469 |
| 2023 |
0.06 |
401.20 |
0.00 |
0.75 |
0.01 |
0.46 |
0.588 |
| 2024 |
0.07 |
347.38 |
0.03 |
0.65 |
0.01 |
0.42 |
0.332 |
| 2025 |
0.00 |
358.40 |
0.01 |
0.69 |
0.04 |
0.48 |
0.393 |
| 2026 |
0.11 |
243.00 |
0.01 |
0.77 |
0.02 |
0.47 |
0.472 |
| 2027 |
0.00 |
334.03 |
0.00 |
1.05 |
0.02 |
0.47 |
0.659 |
| 2028 |
0.11 |
241.66 |
0.20 |
0.37 |
0.00 |
0.41 |
-0.100 |
| 2029 |
0.07 |
157.53 |
0.18 |
0.47 |
0.01 |
0.45 |
-0.092 |
| 2030 |
0.14 |
248.38 |
0.13 |
0.48 |
0.01 |
0.41 |
-0.058 |
| 2031 |
0.31 |
336.05 |
0.21 |
0.52 |
0.00 |
0.44 |
-0.064 |
| 2032 |
0.25 |
506.88 |
0.08 |
0.59 |
0.01 |
0.43 |
0.276 |
| 2101 |
0.16 |
478.03 |
0.05 |
0.57 |
0.03 |
0.46 |
0.192 |
| 2102 |
0.31 |
366.21 |
0.16 |
0.53 |
0.00 |
0.44 |
0.376 |
| 2103 |
0.45 |
614.99 |
0.13 |
0.50 |
0.01 |
0.48 |
0.318 |
| 2104 |
0.26 |
578.84 |
0.18 |
0.49 |
0.00 |
0.43 |
0.210 |
| 2105 |
0.11 |
417.41 |
0.09 |
0.55 |
0.01 |
0.46 |
0.395 |
| 2106 |
0.05 |
445.65 |
0.19 |
0.49 |
0.00 |
0.48 |
0.313 |
| 2107 |
0.08 |
448.98 |
0.10 |
0.54 |
0.00 |
0.46 |
0.404 |
| 2108 |
0.09 |
348.51 |
0.17 |
0.49 |
0.00 |
0.49 |
0.303 |
| 2109 |
0.09 |
290.30 |
0.08 |
0.55 |
0.00 |
0.46 |
0.380 |
| 2110 |
0.05 |
391.39 |
0.31 |
0.42 |
0.10 |
0.57 |
0.040 |
| 2111 |
0.01 |
404.57 |
0.02 |
0.59 |
0.00 |
0.59 |
0.496 |
| 2112 |
0.06 |
303.19 |
0.08 |
0.55 |
0.00 |
0.55 |
0.271 |
| 2113 |
0.00 |
418.83 |
0.04 |
0.55 |
0.03 |
0.59 |
0.633 |
| 2114 |
0.09 |
577.16 |
0.01 |
0.61 |
0.02 |
0.60 |
0.714 |
| 2115 |
0.02 |
473.78 |
0.02 |
0.74 |
0.07 |
0.61 |
0.900 |
| 2116 |
0.03 |
310.53 |
0.00 |
0.66 |
0.02 |
0.60 |
0.797 |
| 2117 |
0.19 |
504.05 |
0.00 |
0.79 |
0.04 |
0.59 |
0.937 |
| 2118 |
0.28 |
398.66 |
0.00 |
0.75 |
0.06 |
0.59 |
0.803 |
| 2119 |
0.28 |
396.53 |
0.02 |
0.84 |
0.05 |
0.63 |
0.484 |
| 2201 |
0.05 |
184.54 |
0.00 |
0.57 |
0.02 |
0.40 |
0.015 |
| 2202 |
0.01 |
250.01 |
0.14 |
0.66 |
0.05 |
0.47 |
0.858 |
| 2203 |
0.03 |
265.27 |
0.42 |
0.50 |
0.01 |
0.39 |
1.661 |
| 2204 |
0.04 |
350.30 |
0.00 |
0.55 |
0.06 |
0.55 |
1.410 |
| 2205 |
0.03 |
409.36 |
0.35 |
0.58 |
0.02 |
0.58 |
0.648 |
| 2206 |
0.04 |
482.30 |
0.08 |
0.83 |
0.01 |
0.60 |
4.947 |
| 2207 |
0.03 |
487.33 |
0.00 |
0.61 |
0.01 |
0.82 |
5.147 |
| 2208 |
0.00 |
413.72 |
0.04 |
0.69 |
0.18 |
0.75 |
0.699 |
| 2209 |
0.03 |
401.64 |
0.00 |
0.86 |
0.06 |
1.07 |
4.612 |
| 2210 |
0.03 |
335.04 |
0.01 |
0.77 |
0.05 |
0.85 |
0.824 |
| 2211 |
0.16 |
410.40 |
0.01 |
0.65 |
0.13 |
0.68 |
0.696 |
| 2212 |
0.04 |
412.17 |
0.01 |
0.68 |
0.05 |
0.84 |
0.887 |
| 2213 |
0.11 |
439.93 |
0.04 |
0.58 |
0.06 |
0.57 |
0.926 |
| 2214 |
0.00 |
449.16 |
0.00 |
0.58 |
0.03 |
0.51 |
0.616 |
| 2215 |
0.07 |
377.51 |
0.02 |
0.65 |
0.02 |
0.56 |
0.695 |
| 2301 |
0.01 |
489.65 |
0.05 |
0.65 |
0.00 |
0.66 |
0.832 |
| 2302 |
0.02 |
527.38 |
0.02 |
0.57 |
0.01 |
0.65 |
0.400 |
| 2303 |
0.05 |
411.56 |
0.03 |
0.60 |
0.00 |
0.61 |
0.443 |
| 2304 |
0.37 |
391.79 |
0.01 |
0.54 |
0.02 |
0.53 |
-0.038 |
| 2305 |
0.44 |
556.10 |
0.00 |
0.55 |
0.02 |
0.36 |
0.067 |
| 2306 |
0.21 |
559.31 |
0.00 |
0.57 |
0.01 |
0.44 |
0.053 |
| 2307 |
0.11 |
618.41 |
0.02 |
0.49 |
0.00 |
0.33 |
0.037 |
| 2308 |
0.05 |
661.43 |
0.02 |
0.50 |
0.02 |
0.33 |
0.032 |
| 2309 |
0.03 |
572.28 |
0.01 |
0.49 |
0.00 |
0.31 |
0.030 |
| 2310 |
0.00 |
560.04 |
0.00 |
0.44 |
0.00 |
0.36 |
0.026 |
| 2311 |
0.01 |
530.72 |
0.00 |
0.42 |
0.00 |
0.35 |
0.030 |
| 2312 |
0.02 |
595.63 |
0.00 |
0.44 |
0.00 |
0.34 |
0.047 |
| 2313 |
0.06 |
619.86 |
0.02 |
0.46 |
0.02 |
0.36 |
0.101 |
| 2314 |
0.06 |
730.91 |
0.01 |
0.39 |
0.00 |
0.33 |
0.149 |
| 2315 |
0.03 |
866.27 |
0.00 |
0.44 |
0.00 |
0.26 |
0.149 |
| 2316 |
0.03 |
904.36 |
0.00 |
0.46 |
0.00 |
0.24 |
0.149 |
| 2317 |
0.07 |
929.52 |
0.02 |
0.43 |
0.05 |
0.26 |
0.144 |
| 2318 |
0.09 |
801.11 |
0.07 |
0.43 |
0.03 |
0.28 |
0.138 |
| 2319 |
0.09 |
656.21 |
0.34 |
0.37 |
0.16 |
0.33 |
0.141 |
| 2320 |
0.04 |
638.27 |
0.03 |
0.38 |
0.12 |
0.39 |
0.143 |
| 2321 |
0.01 |
716.56 |
0.08 |
0.35 |
0.15 |
0.38 |
0.113 |
| 2322 |
0.03 |
597.89 |
0.01 |
0.36 |
0.00 |
0.39 |
0.138 |
| 2323 |
0.09 |
954.73 |
0.31 |
0.35 |
0.08 |
0.43 |
0.136 |
| 2324 |
0.23 |
527.62 |
0.24 |
0.41 |
0.00 |
0.39 |
-0.140 |
| 2325 |
0.06 |
788.39 |
0.43 |
0.30 |
0.13 |
0.47 |
-0.086 |
| 2401 |
0.07 |
124.81 |
0.36 |
0.76 |
0.15 |
0.59 |
0.205 |
| 2402 |
0.01 |
121.04 |
0.23 |
0.82 |
0.13 |
0.48 |
0.352 |
| 2403 |
0.02 |
178.84 |
0.00 |
0.51 |
0.37 |
0.37 |
0.191 |
| 2404 |
0.01 |
152.45 |
0.20 |
0.65 |
0.47 |
0.41 |
-0.487 |
| 2405 |
0.00 |
159.86 |
0.01 |
0.48 |
0.24 |
0.44 |
-0.080 |
| 2406 |
0.03 |
170.48 |
0.02 |
0.52 |
0.14 |
0.44 |
0.264 |
| 2407 |
0.00 |
146.01 |
0.12 |
0.50 |
0.49 |
0.37 |
0.243 |
| 2408 |
0.02 |
220.53 |
0.23 |
0.51 |
0.13 |
0.49 |
0.349 |
| 2409 |
0.03 |
157.26 |
0.11 |
0.93 |
0.00 |
0.44 |
-0.273 |
| 2410 |
0.00 |
130.32 |
0.24 |
0.75 |
0.08 |
0.51 |
0.010 |
| 2411 |
0.02 |
102.90 |
0.17 |
0.80 |
0.09 |
0.63 |
0.419 |
| 2412 |
0.00 |
171.57 |
0.29 |
0.66 |
0.00 |
0.47 |
0.310 |
| 2413 |
0.01 |
141.59 |
0.30 |
0.70 |
0.03 |
0.43 |
0.331 |
| 2414 |
0.01 |
116.38 |
0.11 |
0.88 |
0.06 |
0.66 |
0.648 |
| 2415 |
0.04 |
111.69 |
0.07 |
1.03 |
0.08 |
0.66 |
0.556 |
| 2416 |
0.06 |
121.84 |
0.06 |
1.15 |
0.22 |
0.60 |
0.712 |
| 2417 |
0.11 |
197.32 |
0.03 |
1.18 |
0.32 |
0.58 |
0.710 |
| 2418 |
0.05 |
144.77 |
0.03 |
1.24 |
0.32 |
0.58 |
0.246 |
| 2419 |
0.01 |
125.55 |
0.02 |
1.27 |
0.32 |
0.58 |
2.062 |
| 2420 |
0.08 |
204.66 |
0.02 |
1.23 |
0.35 |
0.54 |
2.811 |
| 2421 |
0.00 |
143.66 |
0.01 |
1.34 |
0.36 |
0.55 |
0.710 |
| 2422 |
0.07 |
216.37 |
0.01 |
1.32 |
0.39 |
0.54 |
0.726 |
| 2423 |
0.00 |
265.27 |
0.00 |
1.48 |
0.41 |
0.54 |
0.646 |
| 2424 |
0.00 |
244.55 |
0.01 |
1.41 |
0.44 |
0.55 |
0.524 |
| 2425 |
0.01 |
213.61 |
0.16 |
1.34 |
0.33 |
0.55 |
0.506 |
| 2426 |
0.02 |
109.21 |
0.05 |
1.32 |
0.19 |
0.53 |
0.568 |
| 2427 |
0.03 |
138.11 |
0.05 |
1.22 |
0.21 |
0.44 |
0.308 |
| 2428 |
0.04 |
187.00 |
0.27 |
1.17 |
0.21 |
0.56 |
0.729 |
| 2429 |
0.02 |
197.67 |
0.28 |
1.13 |
0.13 |
0.66 |
0.281 |
| 2430 |
0.05 |
235.81 |
0.25 |
1.23 |
0.07 |
0.65 |
0.281 |
| 2431 |
0.00 |
174.97 |
0.16 |
0.80 |
0.10 |
0.41 |
0.180 |
| 2432 |
0.04 |
230.53 |
0.30 |
0.86 |
0.14 |
0.55 |
0.154 |
| 2433 |
0.02 |
308.17 |
0.39 |
0.65 |
0.11 |
0.45 |
0.265 |
| 2434 |
0.04 |
261.41 |
0.17 |
1.19 |
0.16 |
0.64 |
0.264 |
| 2435 |
0.08 |
206.06 |
0.19 |
1.12 |
0.15 |
0.66 |
0.571 |
| 2436 |
0.04 |
203.42 |
0.24 |
1.09 |
0.16 |
0.68 |
4.444 |
| 2437 |
0.00 |
228.74 |
0.27 |
1.02 |
0.20 |
0.66 |
0.556 |
| 2501 |
0.00 |
291.96 |
0.13 |
1.10 |
0.27 |
0.59 |
0.316 |
| 2502 |
0.03 |
249.36 |
0.12 |
1.01 |
0.11 |
0.60 |
0.263 |
| 2503 |
0.03 |
212.98 |
0.04 |
0.98 |
0.01 |
0.61 |
0.450 |
| 2504 |
0.00 |
276.52 |
0.14 |
1.09 |
0.14 |
0.55 |
0.410 |
| 2505 |
0.00 |
273.51 |
0.10 |
1.10 |
0.02 |
0.67 |
0.337 |
| 2506 |
0.08 |
261.33 |
0.20 |
1.06 |
0.08 |
0.62 |
0.223 |
| 2507 |
0.01 |
309.73 |
0.22 |
1.07 |
0.08 |
0.58 |
0.262 |
| 2508 |
0.01 |
209.48 |
0.32 |
1.06 |
0.12 |
0.61 |
0.260 |
| 2509 |
0.06 |
186.30 |
0.22 |
1.01 |
0.07 |
0.59 |
0.223 |
| 2510 |
0.01 |
211.08 |
0.20 |
1.06 |
0.03 |
0.67 |
0.293 |
| 2511 |
0.03 |
252.99 |
0.15 |
1.09 |
0.04 |
0.64 |
-0.433 |
| 2512 |
0.03 |
186.54 |
0.31 |
0.87 |
0.00 |
0.62 |
0.344 |
| 2513 |
0.00 |
293.81 |
0.39 |
0.88 |
0.01 |
0.62 |
-0.284 |
| 2514 |
0.02 |
290.00 |
0.42 |
0.81 |
0.01 |
0.58 |
0.365 |
| 2515 |
0.03 |
289.26 |
0.36 |
0.78 |
0.01 |
0.55 |
0.365 |
| 2516 |
0.04 |
315.61 |
0.34 |
0.76 |
0.01 |
0.70 |
0.383 |
| 2517 |
0.01 |
372.80 |
0.35 |
0.72 |
0.01 |
0.59 |
0.491 |
| 2518 |
0.01 |
385.80 |
0.37 |
0.69 |
0.02 |
0.56 |
0.508 |
| 2519 |
0.05 |
206.51 |
0.26 |
0.81 |
0.00 |
0.57 |
0.360 |
| 2520 |
0.05 |
231.10 |
0.21 |
0.77 |
0.00 |
0.55 |
0.493 |
| 2521 |
0.02 |
334.86 |
0.32 |
0.63 |
0.01 |
0.55 |
0.503 |
| 2522 |
0.19 |
263.60 |
0.07 |
0.69 |
0.00 |
0.52 |
0.408 |
| 2523 |
0.00 |
245.81 |
0.21 |
0.67 |
0.00 |
0.52 |
0.501 |
| 2524 |
0.15 |
242.87 |
0.08 |
0.87 |
0.00 |
0.52 |
0.470 |
| 2525 |
0.00 |
217.48 |
0.36 |
0.79 |
0.01 |
0.51 |
0.483 |
| 2526 |
0.01 |
294.70 |
0.34 |
0.62 |
0.02 |
0.55 |
0.515 |
| 2527 |
0.05 |
343.54 |
0.55 |
0.72 |
0.03 |
0.51 |
0.177 |
| 2528 |
0.03 |
255.65 |
0.26 |
0.84 |
0.14 |
0.46 |
0.396 |
| 2529 |
0.01 |
284.41 |
0.16 |
0.73 |
0.22 |
0.57 |
0.332 |
| 2530 |
0.06 |
296.41 |
0.18 |
0.91 |
0.24 |
0.57 |
0.327 |
| 2531 |
0.03 |
297.33 |
0.17 |
0.86 |
0.25 |
0.62 |
0.349 |
| 2532 |
0.01 |
240.67 |
0.09 |
1.06 |
0.23 |
0.59 |
0.300 |
| 2533 |
0.01 |
203.08 |
0.11 |
1.06 |
0.19 |
0.59 |
0.309 |
| 2534 |
0.04 |
218.90 |
0.13 |
1.16 |
0.23 |
0.60 |
0.328 |
| 2535 |
0.01 |
197.69 |
0.22 |
1.11 |
0.28 |
0.64 |
0.366 |
| 2536 |
0.05 |
220.99 |
0.12 |
1.32 |
0.15 |
0.53 |
0.101 |
| 2537 |
0.01 |
202.67 |
0.14 |
1.20 |
0.20 |
0.65 |
0.193 |
| 2538 |
0.00 |
220.06 |
0.11 |
0.97 |
0.09 |
0.59 |
0.205 |
| 2539 |
0.01 |
225.55 |
0.20 |
0.95 |
0.21 |
0.65 |
0.014 |
| 2540 |
0.00 |
216.08 |
0.25 |
1.03 |
0.23 |
0.70 |
0.056 |
| 2541 |
0.01 |
288.70 |
0.24 |
1.05 |
0.16 |
0.66 |
0.044 |
| 2542 |
0.01 |
218.04 |
0.19 |
0.89 |
0.10 |
0.70 |
0.248 |
| 2543 |
0.05 |
215.53 |
0.26 |
1.03 |
0.10 |
0.67 |
0.361 |
| 2544 |
0.05 |
253.20 |
0.22 |
0.84 |
0.06 |
0.69 |
0.364 |
| 2545 |
0.02 |
301.96 |
0.33 |
0.93 |
0.03 |
0.66 |
0.365 |
| 2601 |
0.03 |
158.69 |
0.09 |
0.29 |
0.03 |
0.47 |
-0.005 |
| 2602 |
0.02 |
143.92 |
0.17 |
0.46 |
0.09 |
0.45 |
0.092 |
| 2603 |
0.14 |
167.79 |
0.33 |
0.47 |
0.02 |
0.45 |
0.275 |
| 2604 |
0.03 |
120.23 |
0.33 |
0.45 |
0.00 |
0.50 |
0.240 |
| 2605 |
0.01 |
88.08 |
0.24 |
0.39 |
0.00 |
0.57 |
0.144 |
| 2606 |
0.01 |
140.82 |
0.26 |
0.37 |
0.02 |
0.49 |
0.330 |
| 2607 |
0.16 |
147.69 |
0.39 |
0.41 |
0.08 |
0.43 |
0.264 |
| 2608 |
0.02 |
102.55 |
0.46 |
0.47 |
0.02 |
0.42 |
0.198 |
| 2609 |
0.01 |
335.83 |
0.36 |
0.62 |
0.00 |
0.44 |
0.114 |
| 2610 |
0.11 |
120.14 |
0.18 |
0.65 |
0.03 |
0.48 |
0.166 |
| 2611 |
0.04 |
97.84 |
0.14 |
0.44 |
0.03 |
0.45 |
0.322 |
| 2612 |
0.01 |
500.32 |
0.26 |
0.65 |
0.07 |
0.40 |
0.307 |
| 2613 |
0.21 |
334.06 |
0.08 |
0.53 |
0.13 |
0.45 |
0.260 |
| 2614 |
0.01 |
271.39 |
0.45 |
0.67 |
0.01 |
0.32 |
0.305 |
| 2615 |
0.00 |
358.36 |
0.46 |
0.61 |
0.01 |
0.35 |
0.288 |
| 2616 |
0.01 |
207.07 |
0.47 |
0.68 |
0.04 |
0.40 |
0.426 |
| 2617 |
0.03 |
294.02 |
0.29 |
0.79 |
0.00 |
0.38 |
0.339 |
| 2618 |
0.07 |
230.01 |
0.37 |
0.90 |
0.03 |
0.37 |
0.419 |
| 2619 |
0.01 |
141.18 |
0.28 |
0.71 |
0.01 |
0.32 |
-0.074 |
| 2620 |
0.00 |
110.89 |
0.40 |
0.75 |
0.01 |
0.33 |
1.779 |
| 2621 |
0.00 |
175.01 |
0.34 |
0.78 |
0.04 |
0.38 |
0.882 |
| 2622 |
0.03 |
221.65 |
0.14 |
0.55 |
0.00 |
0.38 |
0.361 |
| 2623 |
0.06 |
206.38 |
0.11 |
0.68 |
0.00 |
0.39 |
0.218 |
| 2624 |
0.05 |
99.01 |
0.27 |
0.66 |
0.05 |
0.46 |
0.245 |
| 2625 |
0.04 |
105.01 |
0.41 |
0.60 |
0.14 |
0.38 |
0.178 |
| 2626 |
0.01 |
270.68 |
0.32 |
0.77 |
0.25 |
0.38 |
0.338 |
| 2627 |
0.06 |
395.09 |
0.26 |
0.81 |
0.06 |
0.36 |
0.233 |
| 2628 |
0.04 |
569.39 |
0.22 |
0.84 |
0.01 |
0.40 |
0.403 |
| 2629 |
0.07 |
398.59 |
0.21 |
0.91 |
0.01 |
0.39 |
0.443 |
| 2630 |
0.08 |
300.06 |
0.21 |
0.72 |
0.00 |
0.38 |
0.541 |
| 2631 |
0.03 |
302.67 |
0.17 |
0.79 |
0.04 |
0.47 |
0.688 |
| 2632 |
0.02 |
424.88 |
0.22 |
1.04 |
0.09 |
0.45 |
0.316 |
| 2633 |
0.01 |
283.22 |
0.31 |
0.97 |
0.12 |
0.46 |
2.575 |
| 2634 |
0.03 |
761.47 |
0.12 |
1.01 |
0.03 |
0.49 |
0.405 |
| 2635 |
0.01 |
381.35 |
0.13 |
1.05 |
0.07 |
0.46 |
1.066 |
| 2636 |
0.00 |
275.02 |
0.21 |
1.04 |
0.15 |
0.44 |
3.258 |
| 2637 |
0.02 |
231.83 |
0.34 |
0.61 |
0.20 |
0.50 |
0.256 |
| 2638 |
0.03 |
117.19 |
0.30 |
0.42 |
0.05 |
0.48 |
0.378 |
| 2639 |
0.04 |
220.11 |
0.20 |
0.41 |
0.27 |
0.44 |
0.392 |
| 2640 |
0.03 |
168.45 |
0.10 |
0.39 |
0.07 |
0.54 |
0.332 |
| 2641 |
0.41 |
229.98 |
0.05 |
0.36 |
0.14 |
0.48 |
0.242 |
| 2642 |
0.02 |
313.28 |
0.13 |
0.54 |
0.17 |
0.44 |
0.222 |
| 2643 |
0.04 |
889.29 |
0.21 |
0.79 |
0.09 |
0.40 |
0.328 |
| 2644 |
0.03 |
985.14 |
0.24 |
0.85 |
0.17 |
0.37 |
0.398 |
| 2645 |
0.05 |
397.82 |
0.15 |
1.03 |
0.02 |
0.40 |
0.589 |
| 2646 |
0.06 |
218.40 |
0.27 |
1.04 |
0.08 |
0.38 |
0.675 |
| 2647 |
0.24 |
209.94 |
0.12 |
0.84 |
0.00 |
0.45 |
0.731 |
| 2648 |
0.13 |
426.77 |
0.27 |
0.95 |
0.11 |
0.53 |
0.297 |
| 2649 |
0.07 |
246.36 |
0.23 |
0.93 |
0.01 |
0.58 |
0.282 |
| 2650 |
0.01 |
508.76 |
0.16 |
0.95 |
0.06 |
0.51 |
0.656 |
| 2651 |
0.04 |
364.88 |
0.24 |
0.79 |
0.00 |
0.46 |
0.783 |
| 2652 |
0.04 |
517.80 |
0.20 |
0.79 |
0.00 |
0.51 |
0.110 |
| 2653 |
0.00 |
577.68 |
0.25 |
0.77 |
0.02 |
0.51 |
0.228 |
| 2654 |
0.02 |
214.11 |
0.23 |
0.83 |
0.00 |
0.53 |
0.047 |
| 2655 |
0.05 |
235.56 |
0.13 |
0.97 |
0.04 |
0.52 |
1.033 |
| 2656 |
0.01 |
553.62 |
0.26 |
0.85 |
0.06 |
0.47 |
2.042 |
| 2657 |
0.00 |
321.82 |
0.21 |
0.86 |
0.00 |
0.53 |
1.291 |
| 2658 |
0.00 |
227.36 |
0.47 |
0.87 |
0.04 |
0.62 |
0.334 |
| 2659 |
0.01 |
248.37 |
0.23 |
0.95 |
0.12 |
0.47 |
3.332 |
| 2660 |
0.05 |
175.85 |
0.34 |
0.91 |
0.05 |
0.35 |
0.599 |
| 2661 |
0.00 |
301.53 |
0.30 |
1.13 |
0.05 |
0.41 |
0.499 |
| 2662 |
0.00 |
169.17 |
0.42 |
0.90 |
0.09 |
0.43 |
1.162 |
| 2663 |
0.09 |
270.14 |
0.25 |
1.24 |
0.05 |
0.41 |
0.622 |
| 2664 |
0.08 |
249.96 |
0.51 |
0.75 |
0.07 |
0.47 |
0.245 |
| 2665 |
0.06 |
201.71 |
0.05 |
0.64 |
0.08 |
0.40 |
-0.066 |
| 2666 |
0.01 |
112.94 |
0.00 |
0.61 |
0.21 |
0.42 |
0.048 |
| 2667 |
0.00 |
124.97 |
0.16 |
0.43 |
0.13 |
0.48 |
0.155 |
| 2668 |
0.02 |
84.03 |
0.30 |
0.50 |
0.21 |
0.41 |
0.001 |
| 2669 |
0.03 |
97.82 |
0.20 |
0.40 |
0.44 |
0.43 |
0.070 |
| 2670 |
0.17 |
127.48 |
0.32 |
0.39 |
0.42 |
0.40 |
0.046 |
| 2671 |
0.04 |
186.70 |
0.39 |
0.40 |
0.28 |
0.49 |
0.100 |
| 2672 |
0.09 |
175.15 |
0.19 |
0.34 |
0.11 |
0.53 |
0.086 |
| 2673 |
0.12 |
94.77 |
0.01 |
0.33 |
0.01 |
0.53 |
0.192 |
| 2674 |
0.10 |
50.72 |
0.37 |
0.43 |
0.10 |
0.45 |
0.246 |
| 2675 |
0.00 |
67.40 |
0.16 |
0.44 |
0.00 |
0.43 |
0.233 |
| 2676 |
0.00 |
115.07 |
0.10 |
0.55 |
0.00 |
0.53 |
-0.024 |
| 2677 |
0.06 |
32.11 |
0.19 |
0.45 |
0.00 |
0.52 |
0.130 |
| 2701 |
0.02 |
374.67 |
0.32 |
0.85 |
0.10 |
0.38 |
0.595 |
| 2702 |
0.00 |
351.95 |
0.28 |
0.83 |
0.09 |
0.34 |
0.464 |
| 2703 |
0.16 |
305.14 |
0.29 |
1.02 |
0.08 |
0.44 |
0.637 |
| 2704 |
0.08 |
273.72 |
0.29 |
0.86 |
0.11 |
0.37 |
0.619 |
| 2705 |
0.00 |
317.24 |
0.15 |
0.77 |
0.08 |
0.34 |
0.032 |
| 2706 |
0.00 |
176.94 |
0.23 |
0.64 |
0.05 |
0.33 |
0.190 |
| 2707 |
0.02 |
178.05 |
0.14 |
0.45 |
0.04 |
0.32 |
0.170 |
| 2708 |
0.12 |
204.85 |
0.27 |
0.34 |
0.04 |
0.43 |
0.277 |
| 2709 |
0.03 |
339.68 |
0.32 |
0.57 |
0.20 |
0.39 |
0.169 |
| 2710 |
0.32 |
504.09 |
0.32 |
0.74 |
0.09 |
0.40 |
0.104 |
| 2711 |
0.30 |
653.22 |
0.31 |
0.69 |
0.08 |
0.42 |
0.033 |
| 2712 |
0.00 |
231.27 |
0.16 |
0.69 |
0.03 |
0.39 |
0.086 |
| 2801 |
0.09 |
86.63 |
0.15 |
0.42 |
0.12 |
0.45 |
0.256 |
| 2802 |
0.01 |
277.87 |
0.15 |
0.47 |
0.00 |
0.57 |
-0.050 |
| 2803 |
0.00 |
563.27 |
0.24 |
0.47 |
0.02 |
0.32 |
-0.023 |
| 2804 |
0.17 |
562.86 |
0.22 |
0.43 |
0.02 |
0.48 |
0.418 |
| 2805 |
0.00 |
583.06 |
0.18 |
0.41 |
0.00 |
0.29 |
-0.086 |
| 2806 |
0.00 |
706.12 |
0.16 |
0.72 |
0.04 |
0.49 |
0.252 |
| 2807 |
0.03 |
646.43 |
0.12 |
0.86 |
0.07 |
0.49 |
0.125 |
| 2808 |
0.01 |
291.30 |
0.36 |
0.39 |
0.12 |
0.41 |
0.167 |
| 2809 |
0.01 |
256.42 |
0.42 |
0.55 |
0.02 |
0.30 |
-0.352 |
| 2810 |
0.05 |
245.57 |
0.19 |
0.55 |
0.00 |
0.39 |
-0.532 |
| 2811 |
0.00 |
338.94 |
0.27 |
0.77 |
0.02 |
0.43 |
0.112 |
| 2812 |
0.03 |
260.52 |
0.44 |
0.36 |
0.00 |
0.35 |
0.126 |
| 2813 |
0.01 |
210.01 |
0.26 |
0.47 |
0.00 |
0.36 |
0.179 |
| 2814 |
0.00 |
229.41 |
0.45 |
0.46 |
0.00 |
0.35 |
0.181 |
| 2815 |
0.05 |
203.20 |
0.38 |
0.41 |
0.02 |
0.37 |
0.396 |
| 2816 |
0.05 |
357.90 |
0.34 |
0.39 |
0.07 |
0.42 |
0.180 |
| 2817 |
0.03 |
462.22 |
0.21 |
0.43 |
0.00 |
0.38 |
0.455 |
| 2818 |
0.00 |
284.73 |
0.27 |
0.55 |
0.01 |
0.37 |
0.196 |
| 2901 |
0.00 |
557.89 |
0.06 |
0.66 |
0.08 |
0.26 |
0.417 |
| 2902 |
0.01 |
355.26 |
0.08 |
0.62 |
0.13 |
0.29 |
0.195 |
| 2903 |
0.05 |
413.68 |
0.08 |
0.57 |
0.15 |
0.28 |
-0.090 |
| 2904 |
0.00 |
394.02 |
0.08 |
0.77 |
0.06 |
0.26 |
0.338 |
| 2905 |
0.00 |
350.46 |
0.22 |
0.50 |
0.10 |
0.28 |
-0.055 |
| 2906 |
0.00 |
359.29 |
0.22 |
0.51 |
0.08 |
0.26 |
0.306 |
| 2907 |
0.03 |
359.20 |
0.05 |
0.59 |
0.00 |
0.27 |
0.350 |
| 2908 |
0.04 |
668.03 |
0.13 |
0.57 |
0.02 |
0.26 |
0.451 |
| 2909 |
0.00 |
426.31 |
0.09 |
0.58 |
0.00 |
0.31 |
0.233 |
| 2910 |
0.20 |
407.06 |
0.24 |
0.51 |
0.11 |
0.50 |
0.576 |
| 2911 |
0.30 |
215.15 |
0.21 |
0.39 |
0.22 |
0.25 |
-0.029 |
| 2912 |
0.33 |
440.38 |
0.10 |
0.41 |
0.24 |
0.39 |
0.128 |
| 2913 |
0.01 |
707.16 |
0.25 |
0.44 |
0.13 |
0.29 |
-0.045 |
| 2914 |
0.11 |
281.71 |
0.44 |
0.49 |
0.07 |
0.27 |
0.049 |
| 2915 |
0.15 |
314.34 |
0.48 |
0.50 |
0.03 |
0.23 |
0.127 |
| 3001 |
0.07 |
282.60 |
0.01 |
0.45 |
0.13 |
0.26 |
0.132 |
| 3002 |
0.03 |
563.40 |
0.01 |
0.33 |
0.11 |
0.31 |
0.086 |
| 3003 |
0.10 |
570.41 |
0.12 |
0.40 |
0.14 |
0.38 |
0.042 |
| 3004 |
0.00 |
341.02 |
0.16 |
0.48 |
0.16 |
0.36 |
0.063 |
| 3005 |
0.03 |
279.48 |
0.00 |
0.38 |
0.00 |
0.29 |
-0.038 |
| 3006 |
0.00 |
409.93 |
0.11 |
0.48 |
0.04 |
0.41 |
-0.021 |
| 3007 |
0.00 |
322.21 |
0.27 |
0.48 |
0.06 |
0.35 |
0.131 |
| 3008 |
0.12 |
233.70 |
0.01 |
0.35 |
0.02 |
0.37 |
1.746 |
| 3009 |
0.00 |
265.43 |
0.04 |
0.39 |
0.10 |
0.38 |
-0.105 |
| 3010 |
0.00 |
368.76 |
0.01 |
0.34 |
0.02 |
0.39 |
0.108 |
| 3011 |
0.00 |
255.33 |
0.07 |
0.39 |
0.00 |
0.35 |
-0.036 |
| 3012 |
0.01 |
524.23 |
0.00 |
0.36 |
0.00 |
0.35 |
-0.039 |
| 3013 |
0.06 |
273.23 |
0.01 |
0.34 |
0.01 |
0.36 |
0.057 |
| 3014 |
0.17 |
343.85 |
0.489 |
0.65 |
0.01 |
0.28 |
-0.070 |
| 3015 |
0.07 |
310.46 |
0.02 |
0.48 |
0.05 |
0.36 |
0.106 |
| 3016 |
0.23 |
260.01 |
0.14 |
0.45 |
0.02 |
0.37 |
-0.137 |
| 3017 |
0.11 |
319.44 |
0.18 |
0.41 |
0.00 |
0.36 |
-0.084 |
| 3018 |
0.00 |
277.64 |
0.10 |
0.38 |
0.02 |
0.33 |
-0.095 |
| 3019 |
0.11 |
432.19 |
0.10 |
0.44 |
0.03 |
0.25 |
-0.075 |
| 3020 |
0.14 |
362.55 |
0.07 |
0.55 |
0.11 |
0.37 |
-0.041 |
| 3021 |
0.12 |
329.95 |
0.00 |
0.60 |
0.19 |
0.34 |
-0.226 |
| 3022 |
0.14 |
428.39 |
0.01 |
0.56 |
0.13 |
0.43 |
-0.263 |
| 3023 |
0.11 |
455.81 |
0.01 |
0.46 |
0.00 |
0.24 |
-0.223 |
| 3024 |
0.02 |
329.52 |
0.00 |
0.45 |
0.20 |
0.36 |
-0.244 |
| 3025 |
0.03 |
312.48 |
0.00 |
0.44 |
0.09 |
0.27 |
-0.256 |
| 3026 |
0.00 |
372.78 |
0.01 |
0.47 |
0.08 |
0.28 |
-0.230 |
| 3027 |
0.02 |
570.39 |
0.05 |
0.55 |
0.01 |
0.25 |
-0.199 |
| 3028 |
0.13 |
881.12 |
0.08 |
0.55 |
0.01 |
0.24 |
0.011 |
| 3029 |
0.02 |
511.97 |
0.02 |
0.51 |
0.08 |
0.25 |
-0.181 |
| 3030 |
0.01 |
757.67 |
0.07 |
0.61 |
0.04 |
0.29 |
0.064 |
| 3031 |
0.08 |
979.38 |
0.08 |
0.57 |
0.06 |
0.24 |
0.019 |
| 3032 |
0.02 |
545.70 |
0.04 |
0.58 |
0.03 |
0.28 |
0.203 |
| 3033 |
0.09 |
335.56 |
0.08 |
0.58 |
0.01 |
0.28 |
0.134 |
| 3034 |
0.11 |
331.05 |
0.13 |
0.55 |
0.02 |
0.31 |
0.117 |
| 3035 |
0.00 |
492.91 |
0.03 |
0.55 |
0.01 |
0.29 |
0.202 |
| 3036 |
0.02 |
378.82 |
0.02 |
0.55 |
0.02 |
0.26 |
0.146 |
| 3037 |
0.00 |
393.41 |
0.06 |
0.60 |
0.02 |
0.30 |
0.162 |
| 3038 |
0.11 |
704.61 |
0.36 |
0.44 |
0.12 |
0.33 |
0.013 |
| 3039 |
0.01 |
812.35 |
0.41 |
0.51 |
0.01 |
0.25 |
-0.002 |
| 3040 |
0.32 |
414.05 |
0.38 |
0.47 |
0.03 |
0.25 |
-0.020 |
| 3041 |
0.07 |
409.05 |
0.23 |
0.62 |
0.21 |
0.26 |
0.039 |
| 3042 |
0.15 |
328.32 |
0.37 |
0.39 |
0.08 |
0.26 |
0.099 |
| 3043 |
0.07 |
360.45 |
0.37 |
0.46 |
0.05 |
0.29 |
0.088 |
| 3044 |
0.10 |
440.59 |
0.27 |
0.41 |
0.12 |
0.30 |
0.022 |
| 3045 |
0.00 |
591.36 |
0.15 |
0.42 |
0.14 |
0.30 |
0.057 |
| 3046 |
0.06 |
337.41 |
0.17 |
0.56 |
0.18 |
0.22 |
0.005 |
| 3047 |
0.05 |
461.35 |
0.19 |
0.48 |
0.03 |
0.33 |
0.129 |
| 3048 |
0.12 |
491.52 |
0.18 |
0.50 |
0.07 |
0.30 |
0.081 |
| 3049 |
0.01 |
570.27 |
0.10 |
0.52 |
0.02 |
0.47 |
0.094 |
| 3050 |
0.17 |
480.28 |
0.20 |
0.62 |
0.03 |
0.24 |
0.054 |
| 3051 |
0.00 |
597.60 |
0.13 |
0.62 |
0.02 |
0.29 |
0.076 |
| 3052 |
0.11 |
727.27 |
0.02 |
0.59 |
0.00 |
0.27 |
0.092 |
| 3053 |
0.01 |
305.56 |
0.28 |
0.53 |
0.00 |
0.32 |
0.099 |
| 3054 |
0.04 |
400.99 |
0.29 |
0.43 |
0.07 |
0.37 |
0.165 |
| 3055 |
0.11 |
601.75 |
0.23 |
0.54 |
0.03 |
0.24 |
0.024 |
| 3056 |
0.12 |
273.07 |
0.20 |
0.48 |
0.24 |
0.37 |
0.125 |
| 3057 |
0.02 |
448.64 |
0.30 |
0.56 |
0.21 |
0.39 |
0.142 |
| 3058 |
0.07 |
541.24 |
0.25 |
0.40 |
0.01 |
0.25 |
0.075 |
| 3059 |
0.30 |
747.97 |
0.00 |
0.46 |
0.00 |
0.43 |
0.035 |
| 3060 |
0.30 |
746.22 |
0.02 |
0.46 |
0.01 |
0.40 |
0.008 |
| 3061 |
0.00 |
447.23 |
0.29 |
0.46 |
0.00 |
0.25 |
0.019 |
| 3062 |
0.06 |
754.35 |
0.14 |
0.44 |
0.00 |
0.28 |
0.016 |
| 3063 |
0.00 |
868.58 |
0.07 |
0.39 |
0.00 |
0.36 |
0.118 |
| 3064 |
0.02 |
819.52 |
0.10 |
0.33 |
0.09 |
0.27 |
0.149 |
| 3065 |
0.14 |
843.12 |
0.07 |
0.33 |
0.11 |
0.29 |
0.149 |
| 3066 |
0.16 |
896.09 |
0.08 |
0.36 |
0.21 |
0.30 |
0.149 |
| 3067 |
0.08 |
710.15 |
0.12 |
0.45 |
0.24 |
0.31 |
0.147 |
| 3068 |
0.12 |
671.06 |
0.07 |
0.49 |
0.00 |
0.45 |
0.106 |
| 3069 |
0.00 |
564.61 |
0.43 |
0.66 |
0.20 |
0.27 |
0.329 |
| 3070 |
0.02 |
686.97 |
0.10 |
0.42 |
0.04 |
0.49 |
-0.006 |
| 3071 |
0.00 |
494.66 |
0.32 |
0.50 |
0.05 |
0.23 |
0.018 |
| 3072 |
0.04 |
576.78 |
0.38 |
0.39 |
0.16 |
0.41 |
0.038 |
| 3073 |
0.02 |
398.24 |
0.37 |
0.40 |
0.12 |
0.43 |
0.120 |
| 3074 |
0.07 |
359.30 |
0.15 |
0.44 |
0.00 |
0.31 |
0.107 |
| 3075 |
0.03 |
301.16 |
0.21 |
0.49 |
0.08 |
0.40 |
0.035 |
| 3076 |
0.00 |
396.16 |
0.13 |
0.57 |
0.00 |
0.35 |
0.160 |
| 3077 |
0.03 |
379.10 |
0.27 |
0.47 |
0.13 |
0.40 |
0.188 |
| 3078 |
0.00 |
177.51 |
0.11 |
0.39 |
0.40 |
0.32 |
1.164 |
| 3079 |
0.04 |
202.63 |
0.00 |
0.37 |
0.43 |
0.29 |
0.452 |
| 3080 |
0.02 |
365.33 |
0.39 |
0.41 |
0.27 |
0.33 |
0.349 |
| 3081 |
0.02 |
276.91 |
0.08 |
0.56 |
0.00 |
0.37 |
0.884 |
| 3082 |
0.12 |
188.65 |
0.11 |
0.44 |
0.43 |
0.26 |
-0.020 |
| 3083 |
0.15 |
284.60 |
0.25 |
0.44 |
0.37 |
0.27 |
0.323 |
| 3101 |
0.08 |
166.17 |
0.41 |
0.71 |
0.58 |
0.55 |
-0.045 |
| 3102 |
0.00 |
154.41 |
0.40 |
0.55 |
0.52 |
0.52 |
0.143 |
| 3103 |
0.01 |
144.49 |
0.31 |
0.50 |
0.23 |
0.62 |
0.189 |
| 3104 |
0.01 |
159.31 |
0.39 |
0.55 |
0.48 |
0.54 |
0.055 |
| 3105 |
0.00 |
196.64 |
0.19 |
0.50 |
0.44 |
0.51 |
0.270 |
| 3106 |
0.05 |
169.32 |
0.38 |
0.59 |
0.58 |
0.49 |
-0.016 |
| 3107 |
0.18 |
129.39 |
0.23 |
0.49 |
0.55 |
0.39 |
-0.020 |
| 3201 |
0.01 |
201.70 |
0.00 |
0.53 |
0.09 |
0.52 |
0.324 |
| 3202 |
0.00 |
258.86 |
0.18 |
0.57 |
0.05 |
0.67 |
0.325 |
| 3301 |
0.01 |
285.24 |
0.02 |
0.37 |
0.24 |
0.63 |
0.239 |
| 3302 |
0.00 |
357.73 |
0.20 |
0.46 |
0.20 |
0.37 |
-0.288 |
| 3303 |
0.02 |
239.61 |
0.09 |
0.33 |
0.28 |
0.31 |
0.464 |
| 3304 |
0.04 |
295.38 |
0.01 |
0.65 |
0.14 |
0.72 |
0.545 |
| 3305 |
0.00 |
190.83 |
0.02 |
0.59 |
0.16 |
0.45 |
0.682 |
| 3306 |
0.00 |
406.44 |
0.03 |
0.63 |
0.08 |
0.52 |
1.388 |
| 3401 |
0.04 |
168.56 |
0.54 |
0.74 |
0.04 |
0.51 |
0.140 |
| 3402 |
0.03 |
98.89 |
0.51 |
0.76 |
0.13 |
0.47 |
0.223 |
| 3403 |
0.05 |
138.91 |
0.50 |
0.76 |
0.16 |
0.52 |
0.224 |
| 3404 |
0.01 |
194.70 |
0.51 |
0.75 |
0.01 |
0.52 |
-0.092 |
| 3405 |
0.06 |
239.97 |
0.39 |
0.68 |
0.04 |
0.46 |
0.126 |
| 3406 |
0.08 |
143.65 |
0.46 |
0.72 |
0.12 |
0.50 |
0.446 |
| 3407 |
0.06 |
118.29 |
0.47 |
0.73 |
0.16 |
0.51 |
0.240 |
| 3408 |
0.03 |
115.73 |
0.41 |
0.73 |
0.18 |
0.56 |
0.140 |
| 3409 |
0.13 |
192.29 |
0.42 |
0.73 |
0.13 |
0.47 |
0.330 |
| 3410 |
0.09 |
305.71 |
0.38 |
0.71 |
0.05 |
0.46 |
0.195 |
| 3411 |
0.05 |
126.28 |
0.37 |
0.72 |
0.14 |
0.53 |
0.015 |
| 3412 |
0.00 |
100.03 |
0.34 |
0.77 |
0.14 |
0.59 |
0.077 |
| 3413 |
0.00 |
115.55 |
0.39 |
0.73 |
0.15 |
0.56 |
0.085 |
| 3414 |
0.01 |
69.23 |
0.30 |
0.77 |
0.12 |
0.46 |
0.165 |
| 3415 |
0.01 |
126.10 |
0.24 |
0.87 |
0.12 |
0.48 |
0.697 |
| 3416 |
0.07 |
81.71 |
0.26 |
0.78 |
0.12 |
0.56 |
0.363 |
| 3417 |
0.00 |
105.39 |
0.34 |
0.78 |
0.12 |
0.51 |
0.062 |
| 3418 |
0.00 |
114.11 |
0.25 |
0.78 |
0.12 |
0.51 |
0.344 |
| 3419 |
0.11 |
211.36 |
0.31 |
0.73 |
0.08 |
0.46 |
0.299 |
| 3420 |
0.02 |
165.27 |
0.28 |
0.73 |
0.09 |
0.48 |
0.358 |
| 3421 |
0.08 |
346.19 |
0.32 |
0.64 |
0.02 |
0.41 |
0.301 |
| 3422 |
0.01 |
211.38 |
0.36 |
0.61 |
0.01 |
0.46 |
0.317 |
| 3501 |
0.01 |
86.16 |
0.01 |
1.01 |
0.21 |
0.43 |
0.015 |
| 3502 |
0.01 |
110.29 |
0.00 |
0.89 |
0.01 |
0.46 |
0.103 |
| 3503 |
0.00 |
81.93 |
0.02 |
0.91 |
0.01 |
0.59 |
0.457 |
| 3504 |
0.06 |
98.87 |
0.10 |
0.92 |
0.00 |
0.57 |
0.246 |
| 3505 |
0.00 |
123.99 |
0.08 |
0.90 |
0.01 |
0.51 |
0.193 |
| 3506 |
0.07 |
100.61 |
0.11 |
0.52 |
0.10 |
0.41 |
0.127 |
| 3601 |
0.00 |
99.55 |
0.00 |
0.53 |
0.53 |
0.38 |
0.121 |
| 3602 |
0.01 |
110.68 |
0.06 |
0.59 |
0.09 |
0.47 |
0.057 |
| 3603 |
0.01 |
157.12 |
0.13 |
0.69 |
0.30 |
0.44 |
0.010 |
| 3604 |
0.15 |
118.59 |
0.04 |
0.85 |
0.00 |
0.68 |
-0.164 |
| 3605 |
0.01 |
94.28 |
0.08 |
0.94 |
0.02 |
0.60 |
-0.173 |
| 3606 |
0.01 |
108.69 |
0.04 |
1.08 |
0.04 |
0.53 |
0.053 |
| 3607 |
0.00 |
123.55 |
0.00 |
1.03 |
0.14 |
0.42 |
0.156 |
| 3608 |
0.01 |
156.70 |
0.14 |
0.87 |
0.01 |
0.43 |
-0.015 |
| 3609 |
0.00 |
90.33 |
0.00 |
1.02 |
0.31 |
0.49 |
0.093 |
| 3610 |
0.00 |
150.72 |
0.39 |
1.12 |
0.05 |
0.63 |
-0.133 |
| 3611 |
0.02 |
138.55 |
0.02 |
0.55 |
0.10 |
0.59 |
0.020 |
| 3612 |
0.02 |
156.25 |
0.02 |
0.56 |
0.09 |
0.56 |
0.482 |
| 3613 |
0.06 |
144.05 |
0.10 |
0.46 |
0.28 |
0.61 |
0.193 |
| 3614 |
0.00 |
102.09 |
0.24 |
0.82 |
0.00 |
0.57 |
-0.138 |
| 3615 |
0.03 |
128.69 |
0.00 |
1.04 |
0.24 |
0.51 |
-0.058 |
| 3616 |
0.00 |
111.35 |
0.14 |
0.62 |
0.26 |
0.61 |
0.087 |
| 3701 |
0.01 |
177.44 |
0.00 |
0.71 |
0.06 |
0.38 |
0.458 |
| 3702 |
0.01 |
146.96 |
0.04 |
0.66 |
0.03 |
0.52 |
0.355 |
| 3703 |
0.00 |
140.57 |
0.15 |
0.64 |
0.05 |
0.47 |
0.337 |
| 3704 |
0.00 |
128.37 |
0.33 |
0.71 |
0.01 |
0.65 |
0.148 |
| 3705 |
0.09 |
175.68 |
0.05 |
0.58 |
0.08 |
0.63 |
0.242 |
| 3706 |
0.09 |
121.60 |
0.09 |
0.73 |
0.18 |
0.55 |
0.319 |
| 3707 |
0.01 |
98.90 |
0.20 |
0.72 |
0.05 |
0.47 |
0.136 |
| 3708 |
0.00 |
102.03 |
0.07 |
0.70 |
0.07 |
0.38 |
0.487 |


 nueva página del texto (beta)
 Inglés (pdf)
 Artículo en XML
 Referencias del artículo
 Enviar artículo por email
 Citado por SciELO
  Similares en
SciELO
Similares en
SciELO 
 Permalink