


 nueva página del texto (beta)
 Inglés (pdf)
 Artículo en XML
 Referencias del artículo
 Enviar artículo por email
 Citado por SciELO
  Similares en
SciELO
Similares en
SciELO 
 Permalink
1. Introduction
China, with its vast territory spanning multiple latitudes, is located at the intersection of the Pacific Ocean and the Eurasian continent, giving rise to a complex and variable climate pattern (Qin et al., 2016). Against the backdrop of urbanization and climate warming, extreme summer precipitation events have become more frequent in China (Marelle et al., 2018; IPCC, 2021). For example, on July 23, 2019, Shuicheng in Guizhou Province experienced torrential rains that triggered a landslide, affecting nearly 1600 people, with 43 dead, nine missing, and more than 700 urgently relocated. The direct economic losses amounted to approximately 190 million RMB (Zhou et al., 2021). Similarly, in July 2020, heavy rains in the Yangtze River Basin resulted in flooding that affected 54.81 million people, caused 158 deaths, and led to direct economic losses of 144.4 billion RMB. Under the influence of climate warming, eastern China has become a particularly sensitive region for extreme heavy rainfall (Zhang and Zhou, 2020). Thus, in-depth research into the spatiotemporal characteristics and future trends of extreme precipitation in eastern China is not only an inevitable trend to meet societal needs but also a crucial approach to achieving harmony between humans and nature.
Previous studies have used various extreme precipitation indices to more accurately describe and examine the observed characteristics and trends of such events. These indices encompass different methods of defining extreme precipitation, including relative, absolute, and customized thresholds. The frequency and intensity of extreme precipitation events vary across regions. Earlier research primarily focused on individual river basins, including the Yangtze River Basin (Wu et al., 2025), the Yellow River Basin (Sun et al., 2022), the Huai River Basin (Yang et al., 2025), the Songhua-Liao River Basin (Gu et al., 2022), the Hai River Basin (Hu et al., 2023), the Pearl River Basin (Wu and Huang, 2015), and the Inland Rivers Basin (Li et al., 2017), with each study examining the temporal and spatial variations of extreme precipitation within a specific basin. Using the HadGEM3-GA6 and CMIP6 models, Chen et al. (2019) conducted a comparative study on the attribution of extreme heavy rainfall events in the summer of 2020 between the middle and lower reaches of the Yangtze River and the middle and lower reaches of the Yellow and Huai River basins, located in the north and south of the East Asian monsoon region. The results indicated that human activities reduced the probability of monthly-scale extreme precipitation events in the southern part of the monsoon region. Human factors increased the likelihood of extreme precipitation in these two regions, while anthropogenic aerosols reduced the probability of monthly-scale extreme precipitation and extreme rain for one day (R×1day) events in the summer of 2020. On the other hand, greenhouse gases (GHG) increased the likelihood of both events, with GHG exerting a stronger influence on R×1day than anthropogenic aerosols. Tian et al. (2022) used the maximum five-day precipitation (R×5day) during June, July, and August (JJA) to measure extreme rainfall in eastern China, finding that it contributed more than 20% to the JJA regional average rainfall. Analyzing daily precipitation data from 344 meteorological stations in eastern China from 1961 to 2015, Shi et al. (2018) found that nearly all regional precipitation indices related to the frequency or intensity of extreme precipitation events showed an increasing trend over the past 55 years. Their study revealed that the spatial patterns of anomalies in summer mean precipitation, the number of days with daily precipitation exceeding the 95th percentile (R95p), and the maximum number of consecutive wet days (CWD) were generally consistent, while the spatial pattern of anomalies in the maximum number of consecutive dry days (CDD) showed an opposite trend to some extent.
Numerical models, including those from the Coupled Model Intercomparison Project (CMIP), have played a key role in simulating and projecting the evolution of extreme precipitation. CMIPs are crucial for future climate projections, as they provide a range of climate scenarios generated by different models, helping to improve our understanding of potential climate change impacts (Eyring et al., 2016). Based on the CMIP5/CMIP6 multi-model data, previous studies have analyzed extreme precipitation. Using 32 models from CMIP5, Rao et al. (2019) found that while most models overestimated the maximum precipitation in northern China, CMIP5 models generally performed well in simulating the spatial distribution of extreme precipitation in northern China during 1986-2005. Utilizing the regional climate model RegCM4, Zhou et al. (2019) simulated extreme precipitation in western China from 1986 to 2005, and projected future changes under the RCP4.5 scenario, concluding that precipitation and the number of rainy days would increase in the northwestern (decrease in the southeastern) part of western China in autumn, with the magnitude of change by the end of the 21st century expected to be greater than that of the mid-21st century.
This study employs daily precipitation data from 1310 meteorological stations in eastern China to analyze the historical spatiotemporal distribution characteristics of summer extreme precipitation indices from 1961 to 2020, based on 10 extreme precipitation indices defined by the Expert Team on Climate Change Detection and Indices (ETCCDI). Additionally, the ensemble mean of 20 CMIP6 models is evaluated to assess the performance of simulating the historical spatiotemporal distribution of extreme precipitation indices during the summer in eastern China. Based on this, we further project the future changes in summer extreme precipitation indices across eastern China and its eight major river basins from 2021 to 2100 under three Shared Socioeconomic Pathways (SSP1-2.6, SSP2-4.5, and SSP5-8.5), with a particular focus on analyzing extreme precipitation indices in eastern China under the “dual carbon” targets. This study aims to provide scientific insights and projections for understanding the evolution of extreme summer precipitation in eastern China and its response to future climate change, supporting the development of relevant climate adaptation and carbon emission mitigation strategies.
2. Data and methods
2.1 Study area
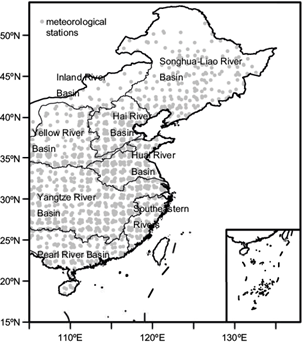
According to the standards of the Resource and Environment Science and Data Center of the Institute of Geographic Sciences and Natural Resources Research, Chinese Academy of Sciences, China can be divided into nine major river basins: Inland Rivers Basin, Southwestern Rivers, Southeastern Rivers, Pearl River Basin, Yangtze River Basin, Yellow River Basin, Huai River Basin, Hai River Basin, and Songhua-Liao River Basin (Gou et al., 2020). The study area of this paper focuses on the eight corresponding river basins in eastern China, as shown in Figure 1.
2.2 Data
This study is based on the National Basic Meteorological Elements Daily Dataset v. 3.0 from China’s national meteorological stations, covering daily precipitation data from 1961 to 2020 (https://data.cma.cn/data/). The dataset includes data from over 2400 stations and has undergone rigorous three-tier quality control at the national, provincial, and station levels, ensuring data reliability with an accuracy close to 100%. Although daily precipitation data have been available since 1951, most regions of China before 1960 have unreliable or missing data (Wang et al., 2022). Therefore, the period from 1961 to 2020 was selected to ensure the inclusion of more reliable data.
In addition, daily precipitation data from 20 CMIP6 multi-models were used (https://aims2.llnl.gov/search/cmip6/), covering the period from 1961 to 2014. These models include three Shared Socioeconomic Pathways (SSPs) scenarios: SSP1-2.6, SSP2-4.5, and SSP5-8.5, corresponding to different future carbon emission levels (Table I). The data variant label is r1i1p1f1, and the resolution was linearly interpolated to 0.5° × 0.5°. SSPs represent different global socioeconomic development pathways, which are used to assess potential future climate change and its impacts. SSP1-2.6 corresponds to a sustainable development scenario with low emissions, SSP2-4.5 represents a middle-of-the-road scenario with moderate emissions, and SSP5-8.5 is a high-emission pathway driven by rapid economic growth and high energy demand. These scenarios are widely used in climate modeling to explore how different socioeconomic trajectories could influence future climate change.
Table I Characteristics of 20 CMIP6 models.
| Model name | Country | Resolution | Model name | Country | Resolution |
| ACCESS-CM2 | Australia | 192 × 145 | INM-CM5-0 | Russia | 180 × 120 |
| ACCESS-ESM1-5 | Australia | 192 × 145 | IPSL-CM6A-LR | France | 144 × 143 |
| BCC-CSM-MR | China | 32 × 160 | KIOST-ESM | South Korea | 192 × 96 |
| CanESM2 | Canada | 128 × 64 | MIROC6 | Japan | 256 × 128 |
| CESM2-WACCM | USA | 288 × 192 | MPI-ESM1-2-HR | Germany | 384 × 192 |
| CMCC-ESM2 | Italy | 288 × 192 | MPI-ESM1-2-LR | Germany | 192 × 96 |
| FGOALS-g3 | China | 188 × 80 | MRI-ESM2-0 | Japan | 320 × 260 |
| GFDL-ESM4 | USA | 288 × 180 | NESM3 | China | 192 × 96 |
| IITM-ESM | India | 192 × 94 | NorESM2-LM | Norway | 144 × 96 |
| INM-CM4-8 | Russia | 180 × 120 | TaiESM1 | Taiwan, China | 288 × 192 |
2.3 Calculation of extreme precipitation indices
This study utilizes 10 precipitation indices defined by the ETCCDI under the Climatology Commission of the World Meteorological Organization (WMO) (Karl and Easterling et al., 1999; Zhang et al., 2011) (Table II), including total annual precipitation (PRCPTOT), precipitation intensity (SDII), R×1day, R×5day, R95p, very heavy precipitation (R99p), number of heavy rain days (R10mm), number of very heavy rain days (R20mm), CWD, and CDD.
Table II 10 extreme precipitation indices defined by the ETCCDI
| Index | Name | Definition | Unit |
| PRCPTOT | Total annual precipitation | Total precipitation on wet days (daily precipitation ≥ 1 mm) within a year | mm |
| SDII | Precipitation intensity | Ratio of total annual precipitation to the number of wet days (daily precipitation ≥ 1 mm) | mm d-1 |
| R×1day | Maximum 1-day precipitation | Maximum daily precipitation within a year | mm |
| R×day | Maximum 5-day consecutive precipitation | Maximum 5-day cumulative precipitation within a year | mm |
| R95p | Heavy precipitation amount | Annual total precipitation from days with daily precipitation > 95th percentile of the reference period | mm |
| R99p | Extreme heavy precipitation amount | Annual total precipitation from days with daily precipitation > 99th percentile of the reference period | mm |
| R10mm | Number of heavy rain days | Number of days with daily precipitation ≥ 10 mm within a year | d |
| R20mm | Number of very heavy rain days | Number of days with daily precipitation ≥ 20 mm within a year | d |
| CWD | Maximum consecutive wet days | Maximum number of consecutive days with daily precipitation ≥ 1 mm within a year | d |
| CDD | Maximum consecutive dry days | Maximum number of consecutive days with daily precipitation <1 mm within a year | d |
3. Results
3.1 Spatiotemporal distribution characteristics of summer extreme precipitation indices observed at stations in eastern China from 1961 to 2020
First, we examine the climatology for the 10 extreme precipitation indices during summer, calculated from the data of 1310 stations in eastern China from 1961 to 2020. As shown in Figure 2, a pattern of wetter conditions in the south and drier conditions in the north (i.e., the “south flooding, north drought” pattern) is observed in eastern China. Specifically, PRCPTOT, R10mm, and R20mm exhibit similar spatial patterns, with maximum values concentrated in the southeastern coastal region. The maximum PRCPTOT exceeds 1800 mm, while the maximum R10mm and R20mm exceed 54 and 28 d, respectively (Fig. 2a, g-h). Additionally, the spatial distribution of R×1day and R×5day shows similar characteristics, with peak values in the southeastern coastal region, the Yangtze River Basin, and the boundary area between the Yangtze River Basin and the southeastern rivers. The maximum R×1day exceeds 130 mm, and the maximum R×5day exceeds 230 mm (Fig. 2c-d). However, the spatial distribution of SDII, R95p, R99p, CWD, and CDD shows some differences. SDII exhibits its highest values in the southeastern coastal region, Hainan Island, and large areas of the Huai River Basin, Yangtze River Basin, and southeastern rivers, with maximum values exceeding 21 mm d-1 (Fig. 2b). The highest R95p values are located in the middle and lower reaches of the Yangtze River and the Pearl River Basin, with maximum values above 110 mm, though there is a relatively low-value zone in the eastern Pearl River Basin, with a center of 60-70 mm (Fig. 2e). R99p exhibits scattered peaks south of the Yangtze River, with maximum values exceeding 45 mm (Fig. 2f). CWD gradually decreases from southeast to northwest, with the highest values in the southeastern coastal region. The maximum CWD in the eastern Pearl River Basin exceeds 5.5 d (Fig. 2i). On the other hand, the highest CDD values are found in central Inner Mongolia, exceeding 10 d, while the lowest values are distributed south of the Yangtze River, across most of Heilongjiang, and parts of Guizhou, Sichuan, and Guangxi, where the minimum values are below 6 d (Fig. 2j).
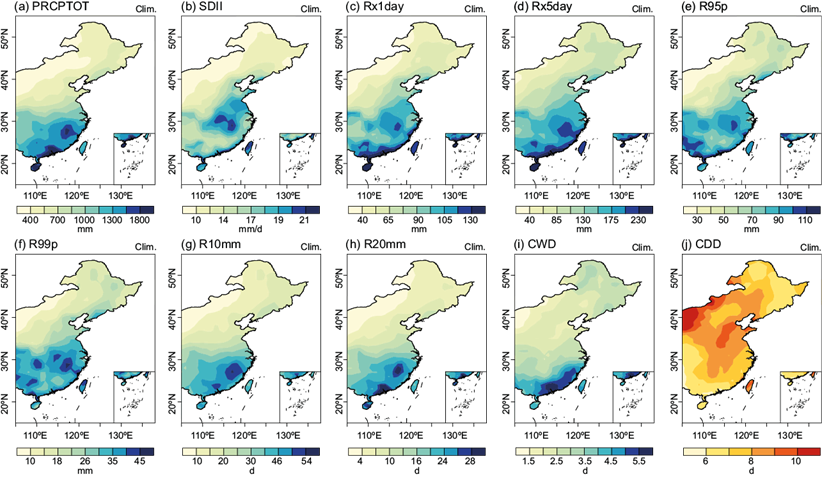
Fig. 2 Climatology of summer extreme precipitation indices derived from station observation data in eastern China from 1961 to 2020.
In the northeastern region, both the frequency and intensity of extreme precipitation are relatively low, resulting in less precipitation. In contrast, the middle and lower reaches of the Yangtze River experience higher frequencies and intensities of extreme precipitation, leading to greater rainfall, which contributes to the wetter conditions in southern China and drier conditions in the north. The high rainfall accumulations in the southeast of the study area are primarily influenced by the southeast monsoon, which brings abundant moisture from the ocean, and by the interaction of warm, moist air masses with the complex topography of the region (Wang et al., 2016, 2022). Additionally, tropical cyclones, which frequently make landfall in the southeastern coast, also contribute significantly to extreme rainfall events (Wang et al., 2020). In summary, the climatological distribution of the 10 extreme precipitation indices in eastern China shows a general trend of higher values in the south and lower values in the north, with CDD being the exception.
Figure 3 presents the temporal variation of the summer extreme precipitation indices in eastern China from 1961 to 2020. The results indicate significant increases in SDII, R×1day, R95p, R99p, and R20mm, while PRCPTOT, R×5day, and R10mm show increasing trends, though not statistically significant. Specifically, the average value of SDII increased from around 12 mm d-1 in the 1960s to its maximum value of 17.51 mm d-1 in 2020, with a growth rate of approximately 0.03 mm d-1 per year (Fig. 3b). R×1day rose from about 80 mm in the 1960s to a historical maximum of 102 mm in 2016, with an increase rate of about 0.11 mm yr-1 (Fig. 3c). R95p increased from around 70 mm in the 1960s to peak at 94 mm in 2020, with a growth rate of 0.22 mm yr-1. R99p rose from 30 mm in the 1960s to its highest value of 41 mm in 1999, with a growth rate of about 0.13 mm yr-1. The maximum value of R20mm occurred in 2016, reaching 17.02 d, with a growth rate of approximately 0.02 d yr-1. CWD, which had an average of about 4.5 d in the 1960s, reached its peak of 3.71 d in 1996, with a decreasing rate of 0.03 d per decade (Fig. 3i). CDD, with an average of 14 d in the 1960s, peaked at 12.61 d in 1998, with a decreasing rate of 0.21 d per century (Fig. 3j). Overall, these trends demonstrate a clear intensification of extreme precipitation events in eastern China, marked by higher daily rainfall, more frequent extreme events, and a shift toward heavier and more persistent precipitation during the summer months.
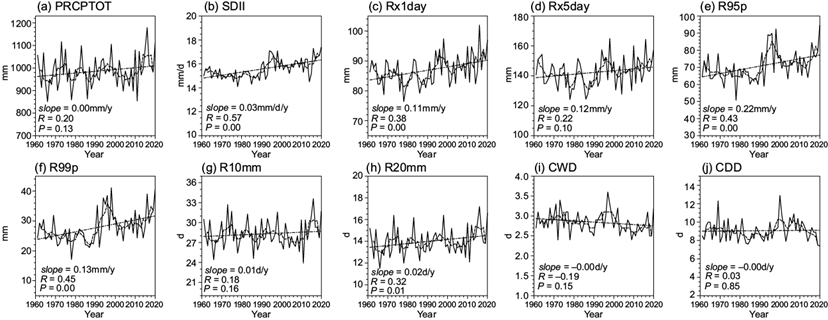
Fig. 3 Temporal evolution characteristics of summer extreme precipitation indices derived from station observation data in eastern China from 1961 to 2020. Solid lines represent climatology, dashed lines represent five-year moving averages, and dotted lines represent linear trends.
Figure 4 illustrates the long-term trends of summer extreme precipitation indices in eastern China. Specifically, for PRCPTOT, R10mm, and R20mm (Fig. 4a, g-h), decreasing trends are observed in the western Pearl River Basin, Huai River Basin, Hai River Basin, and Yellow River Basin, with the reduction in R10mm in the western Pearl River Basin being particularly significant. In contrast, these three indices show increasing trends in other areas, especially in the middle and lower reaches of the Yangtze River, Heilongjiang, and northeastern Inner Mongolia, with maximum increasing trends exceeding 5.00 mm yr-1, 0.12 d yr-1, and 0.09 d yr-1, respectively. SDII, R×1day, R×5day, R95p, and R99p exhibit decreasing trends in the Hai River Basin and Yellow River Basin, with significant decreases observed for indices other than SDII and R×1day (Fig. 4b-f). The decreasing trends for these indices are approximately 0.03 mm d-1 per year, 0.30 mm yr-1, 0.50 mm yr-1, 0.40 mm yr-1, and 0.22 mm yr-1, respectively. Conversely, these indices show increasing trends in other regions, particularly in the southern Yangtze River Basin and the Songhua-Liao River Basin, where the increasing trends are more pronounced, with specific trends exceeding 0.10 mm d-1 per year, 0.45 mm yr-1, 0.80 mm yr-1, 1.20 mm yr-1, and 0.70 mm yr-1, respectively. The trend for CWD is slightly different (Fig. 4i), showing an increasing trend south of the Yangtze River, in the western Yellow River Basin, and parts of Heilongjiang, while decreasing trends are observed in other areas. The decreasing trends are particularly significant in the western Pearl River Basin, Yellow River Basin, Hai River Basin, and northern Songhua-Liao River Basin, with the largest increases (or decreases) exceeding 0.08 d per 10 yr (0.10 d per 10 yr). For CDD (Fig. 4j), decreasing trends are observed south of the Yangtze River, in central Inner Mongolia, and the northern Songhua-Liao River Basin, especially in the middle and lower reaches of the Yangtze River, where CDD shows a significant downward trend. Increasing trends for CDD are observed in other regions, particularly in the eastern Huai River Basin and southern parts of the three northeastern provinces, where the trends are significantly positive, with the largest increases (or decreases) exceeding 0.40 d per 10 years.
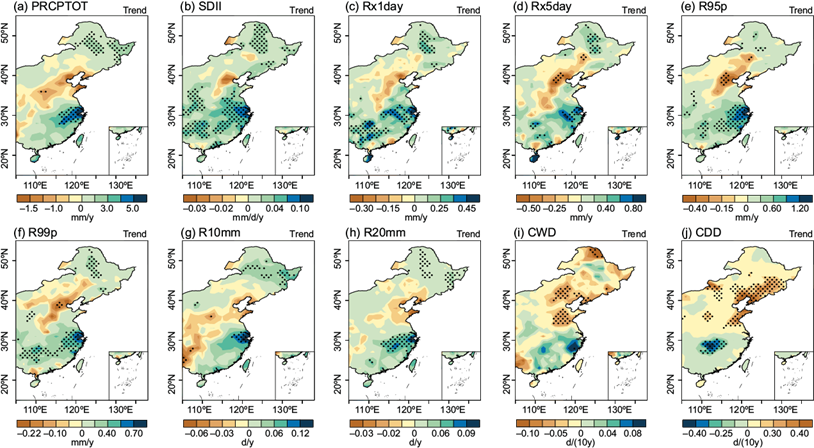
Fig. 4 Spatial distribution of trends in summer extreme precipitation indices derived from station observation data in eastern China from 1961 to 2020, with significant trends indicated by black dots at the 0.05 level of confidence.
In summary, most areas in southeastern and northeastern China show increasing trends in extreme precipitation, with longer duration and higher rainfall amounts. Several studies have suggested that the increase in rainfall totals in these already naturally wetter regions could be attributed to factors such as climate change, changes in atmospheric circulation patterns, and urbanization (Liu et al., 2015; Gu et al., 2022; Fu et al., 2024). In contrast, northern China experiences a reduction in extreme precipitation events and rainfall amounts, while southwestern parts of eastern China exhibit fewer heavy rain days but increased extreme precipitation intensity.
3.2 Historical simulations and future projections of summer extreme precipitation indices in eastern China
By averaging multiple climate models, the ensemble mean of CMIP6 models helps reduce the influence of biases and uncertainties from individual models, including both natural variability and responses to external forcing (Wu et al., 2023). The ensemble mean better represents the range of possible climate outcomes, providing more robust estimates for historical simulations and future climate predictions, especially in regions with complex climate dynamics like eastern China (Wang et al., 2021). Notably, the spatial correlation coefficients of all models indicate a positive agreement with the observed trends, suggesting that the models can capture the direction of extreme precipitation changes effectively.
Figure 5 shows the spatial distribution of the summer extreme precipitation indices in eastern China from 1961 to 2014, simulated by the ensemble mean of 20 CMIP6 models. The numbers in the top-right corner of Figure 5 represent the spatial correlation coefficients between the multi-model ensemble mean and the observations, all of which pass the 95% confidence level. The results indicate that the spatial correlation coefficients between the ensemble mean and observations range from 0.44 to 0.67, with higher correlations for indices such as CDD, SDII, and R10mm, at 0.67, 0.59, and 0.53, respectively, suggesting reliable simulation capabilities for specific extreme precipitation indices (Krishnamurti et al., 2003). The ensemble mean of the 20 models accurately simulates historical summer precipitation (PRCPTOT) and extreme precipitation frequency (R10mm and R20mm), but the precipitation intensity (SDII, R×1day, and R×5day) is slightly underestimated. Overall, the models perform well in reproducing the spatial distribution of historical extreme precipitation indices. In the western Pearl River Basin, the ensemble mean of PRCPTOT (SDII) is 1200-1600 mm (6-8 mm d-1), while the observed values are 1000-1100 mm (14-17 mm d-1), indicating an overestimation of summer rainfall (underestimation of rainfall intensity) in the western Pearl River Basin. In other parts of eastern China, the ensemble mean of SDII (R10mm) is lower (higher), leading to PRCPTOT values comparable between the model and observations. The simulation of the “south flooding, north drought” pattern for indices such as PRCPTOT, R×5day, R95p, R99p, R20mm, and CWD is particularly successful, accurately capturing the high-value areas of extreme precipitation and their spatial locations.
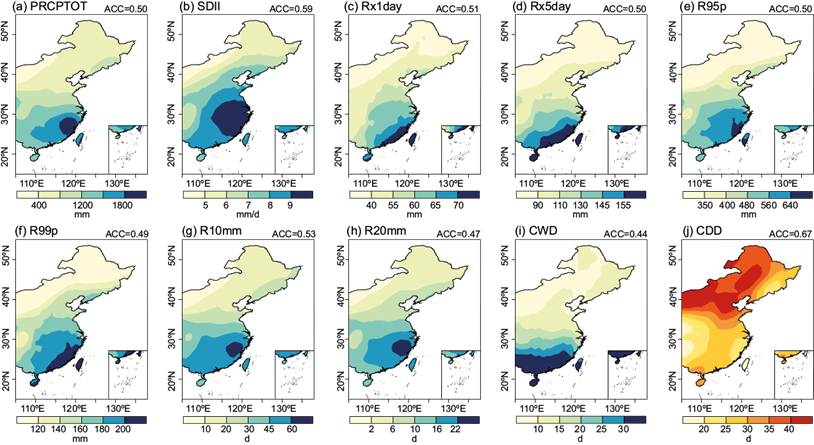
Fig. 5 Spatial distribution of summer extreme precipitation indices over eastern China based on the ensemble means of 20 CMIP6 models from 1961 to 2014. The number in the top right corner indicates the spatial correlation coefficient between the multi-model ensemble mean and observation.
In summary, the results indicate that the ensemble mean of the models provides reliable simulations of the summer extreme precipitation indices in eastern China, laying a solid foundation for further exploration of the impacts of climate change on extreme precipitation.
The SSP scenarios describe potential global development pathways based on different economic, social, and environmental policy choices, reflecting various visions of future development. This study considers three future SSP scenarios: SSP1-2.6 represents a low-emission, sustainable development scenario; SSP2-4.5 represents a medium-emission scenario with some GHG mitigation measures but with continued development pressure; and SSP5-8.5 represents a high-emission, high-growth scenario with higher future GHG emissions and greater development challenges (Lovino et al., 2021).
Under different carbon emission scenarios, the future trends of the 10 extreme precipitation indices show varying increase levels. R95p, R99p, and CWD exhibit significant growth in the near term (2021-2040), with rates of 1.44 mm yr-1, 0.78 mm yr-1, and 0.02 d yr-1, respectively. R99p and CWD will continue to increase in the mid-term (2041-2060), with growth rates of 0.77 mm yr-1 and 0.01 d yr-1, respectively. In the long-term (2081-2100), R95p and R99p will reach historical levels 10.61 times and 11.32 times higher, respectively. Other extreme precipitation indices, such as PRCPTOT, R×1day, R×5day, R10mm, R20mm, and CDD, show little change compared to historical values. Additionally, the future growth trends of all precipitation indices under the three scenarios follow the pattern SSP5-8.5 > SSP2-4.5 > SSP1-2.6, with the most pronounced increases in SDII, R×1day, R×5day, R95p, and R99p (Fig. 6b-f), indicating that the higher the carbon emissions, the more evident the increase in precipitation. Under the SSP1-2.6 and SSP2-4.5 scenarios, the most noticeable growth trends are for PRCPTOT and SDII, with rates of 1.07 mm yr-1 and 0.01 mm d-1 per year under SSP1-2.6 and 0.71 mm yr-1 and 0.01 mm d-1 per year under SSP2-4.5. Under the SSP5-8.5 scenario, the increase in PRCPTOT and R99p is the most significant, with rates of 1.75 and 1.20 mm yr-1, respectively. Future summer extreme precipitation in eastern China is expected to continue increasing in the long term, particularly in heavy precipitation, extreme precipitation, and maximum consecutive wet days.
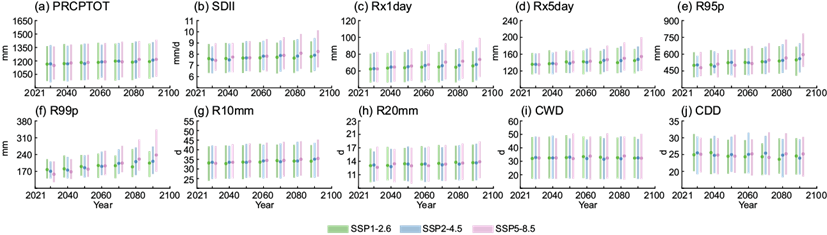
Fig. 6 Future projections of summer extreme precipitation indices over eastern China from 2021 to 2100 based on the ensemble means of 20 CMIP6 models. The green, blue, and purple error bars represent the decadal averages under the SSP1-2.6, SSP2-4.5, and SSP5-8.5 scenarios, respectively.
In September 2020, China announced at the 75th session of the United Nations General Assembly that it would aim to peak its CO2 emissions before 2030 and strive to achieve carbon neutrality before 2060. The achievement of the “dual carbon” targets will help humanity take proactive steps to better cope with the adverse effects of extreme weather caused by global warming (Yang et al., 2022). The SSP1-2.6 scenario is well aligned with the goals of low emissions and sustainable living, and therefore can represent China’s “dual carbon” target carbon emissions.
Under the SSP1-2.6 scenario, by the time carbon emissions peak (around 2030), PRCPTOT, CWD, and R95p are projected to increase by 4, 4, and 2%, respectively, compared to historical averages. Meanwhile, CDD, SDII, R×1day, R×5day, R10mm, R99p, and R20mm are expected to decrease by 9, 3, 2, 2, 2, 1, and 1%, respectively. By the time carbon neutrality is achieved (around 2060), R99p, R95p, PRCPTOT, R×1day, CWD, and R×5day will show significant growth trends, with R99p, R95p, and PRCPTOT increasing by 10, 7, and 6%, respectively.
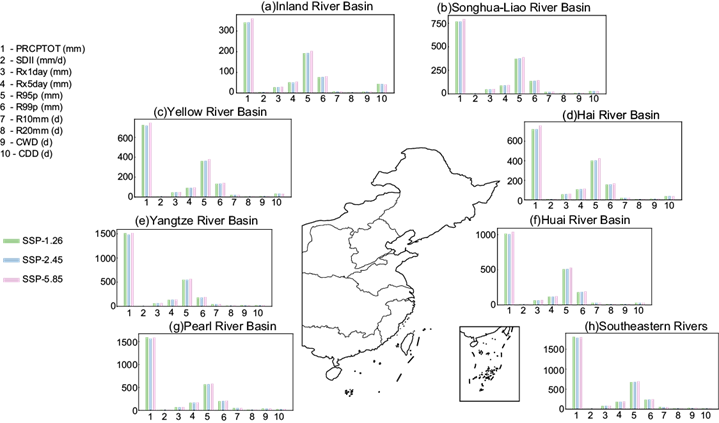
Further analysis of the changes in the 10 extreme precipitation indices across the different river basins in eastern China from 2021 to 2100 (Fig. 7), using relative changes (future vs. historical periods), reveals spatial heterogeneity in future trends. In terms of precipitation frequency (R10mm and R20mm), the Southeast Rivers Basin > Pearl River Basin > Yangtze River Basin > Huai River Basin > Songhua-Liao River Basin > Hai River Basin > Yellow River Basin > Inland Rivers Basin (the average projected R10mm values under the three scenarios in these basins are 54.49, 51.20, 47.74, 31.82, 21.60, 21.40, 20.90, and 7.56 d, respectively; the average projected R20mm values are 21.29, 16.28, 16.58, 12.88, 7.10, 7.86, 7.24, and 1.88 d, respectively). In terms of precipitation intensity (R×1day, R×5day, R95p, and R99p), the Southeast Rivers Basin > Pearl River Basin > Yangtze River Basin > Huai River Basin > Hai River Basin > Yellow River Basin > Songhua-Liao River Basin > Inland Rivers Basin (the average projected R×1day values under the three scenarios in these basins are 83.29, 70.51, 63.86, 66.45, 59.04, 48.25, 48.95, and 28.73 mm, respectively; the average projected R×5day values are 186.29, 169.63, 137.96, 119.90, 110.94, 93.35, 91.39, and 52.41 mm, respectively; the average projected R95p values are 683.36, 574.38, 556.03, 516.66, 410.87, 367.85, 380.11, and 196.78 mm, respectively; the average projected R99p values are 241.54, 205.59, 186.80, 186.25, 161.99, 136.12, 139.46, and 78.13 mm, respectively). In terms of total precipitation (PRCPTOT), the Southeast Rivers Basin > Pearl River Basin > Yangtze River Basin > Huai River Basin > Hai River Basin > Yellow River Basin > Songhua-Liao River Basin > Inland Rivers Basin (the average projected PRCPTOT values under the three scenarios in these basins are 1799.86, 1799.86, 1502.78, 1020.32, 776.23, 735.63, 728.42, and 348.06 mm, respectively). In summary, future summer precipitation in eastern China is expected to show a decreasing spatial distribution from south to north and east to west, maintaining the “south flooding, north drought” pattern. Particularly, the future total summer precipitation, extreme precipitation frequency, and extreme precipitation intensity in the Southeast Rivers Basin, Pearl River Basin, and Yangtze River Basin will significantly increase.
4. Conclusion and discussion
This study uses daily precipitation data from 1310 stations in eastern China to analyze the historical spatiotemporal distribution of summer extreme precipitation indices (1961-2020) based on 10 ETCCDI indices. We also evaluate the ensemble mean of 20 CMIP6 models to assess their simulation performance. Furthermore, we project future changes in these indices across eastern China and its eight major river basins from 2021 to 2100 under three SSP scenarios. The main conclusions are as follows:
1. From 1961 to 2020, summer extreme precipitation in eastern China generally decreased from south to north and east to west. In southern China, extreme precipitation events have increased due to rising rainfall, while the Yellow and Hai River basins have experienced a drying trend. The Songhua-Liao River Basin has remained relatively dry, with less significant increases in precipitation frequency and intensity compared to the south. Additionally, consecutive wet days (CWD) have decreased from the southeastern coastal areas to the northwestern inland regions, while heavy precipitation events have become more frequent, particularly south of the Yangtze River.
2. Regarding the time series, summer extreme precipitation amount, daily precipitation, precipitation intensity, and precipitation frequency in eastern China from 1961 to 2020 show upward trends. Southeastern and northeastern China have experienced an increase in extreme precipitation amounts and the duration of extreme events, while northern China has seen a reduction in the frequency and amount of extreme precipitation. Southwestern parts of eastern China have seen fewer heavy rain days but an increase in the intensity of extreme precipitation. Consecutive wet days decreased, while heavy precipitation events increased in eastern China.
3. The ensemble mean of multiple models shows reliable performance in simulating the historical extreme precipitation indices for summer in eastern China. The multi-model ensemble results indicate that the higher the future carbon emissions, the more pronounced the increase in precipitation, especially in terms of heavy precipitation, extreme precipitation, and the maximum number of consecutive wet days.
4. By 2030, when China aims to peak carbon emissions, the extreme indices of PRCPTOT, CWD, and R95p for summer in eastern China are projected to increase by 4, 4, and 2%, respectively, compared to historical averages. However, indices such as CDD, SDII, R×1day, R×5day, R10mm, R99p, and R20mm are expected to decrease by 9, 3, 2, 2, 2, 1, and 1%, respectively. By 2060, when carbon neutrality is targeted, R99p, R95p, PRCPTOT, R×1day, CWD, and R×5day are all expected to show significant increases, with R99p, R95p, and PRCPTOT projected to increase by 10, 7, and 6%, respectively.
Previous studies using nine extreme precipitation indices defined by ETCCDI indicate that, from 1948 to 2014, consecutive wet days decreased while heavy precipitation events increased (Wu et al., 2023). Other studies suggest that the probability of precipitation events increases with rising GHG concentrations (Wu and Cao, 2024). These conclusions are consistent with the findings of this study. In China, extreme heavy precipitation events are expected to intensify with warming, leading to increased population exposure in all regions. Extreme dry events, however, exhibit a dipole pattern, with events extending in southern China and shortening in northern China. Due to climate change and uneven population distribution, southeastern China is expected to be the most sensitive region to the increased impacts of extreme heavy precipitation and extreme dry events on population exposure (Zhang and Zhou, 2020). However, it is important to note that the CMIP6 models may not fully capture the intensity of extreme precipitation, which could lead to inaccuracies in future projections.
Given the uncertainties inherent in climate models, coupled with the effects of natural internal variability within the climate system, climate projections are probabilistic rather than deterministic. In other words, there is a certain range of uncertainty in the projections (Tebaldi and Knutti, 2007; Hawkins and Sutton, 2009). Therefore, while making projections using CMIP6 multi-model results, attention should also be paid to low-probability, high-impact extreme scenarios to improve prediction accuracy. The implementation of the “dual carbon” policies will influence the global climate to some extent, thereby affecting the occurrence of extreme weather events. The changes in summer extreme precipitation in eastern China have significant implications for water resource management, agriculture, and regional economies. Increased extreme precipitation can lead to water scarcity or flooding, directly impacting water availability for both urban and agricultural needs.
Furthermore, agriculture, especially crop production, may face challenges such as altered growing seasons and increased risk of crop damage due to floods. From an economic perspective, the occurrence of extreme weather events may disrupt regional infrastructure, industries, and agricultural output, thereby influencing local economies. Consequently, future carbon emission policies should consider these climatic shifts, with an emphasis on enhancing resilience to extreme weather events and reducing the risks they pose to key sectors like agriculture and infrastructure.

