nueva página del texto (beta)
 Inglés (pdf)
 Artículo en XML
 Referencias del artículo
 Enviar artículo por email
 Citado por SciELO
  Similares en
SciELO
Similares en
SciELO 
 Permalink
1. Introduction
The urban heat island (UHI) effect is a significant challenge faced by most small and medium-sized cities, as well as all large cities worldwide (dos Santos et al., 2017; Ladan et al., 2023). As urban areas continue to expand and become more densely populated, the absorption and retention of heat by buildings, roads, and other impervious surfaces can lead to significantly higher temperatures compared to surrounding rural or suburban areas (Battisti et al., 2018; Sturiale and Scuderi, 2019; Dong et al., 2020). This effect is particularly pronounced during heat waves and can have detrimental impacts on public health, energy consumption, and the overall livability of urban environments. In urban environments, heat accumulation is commonly caused by artificial surfaces, as building materials and asphalt possess higher thermal conductivity, increasing the absorption of solar radiation and facilitating the retention and gradual release of heat (Budhiraja et al., 2020). Conversely, the decrease in vegetation cover also plays a crucial role in limiting evapotranspiration, thereby hindering natural cooling through the evaporation of water in the soil and vegetation.
One effective strategy to mitigate the UHI effect is the implementation of green infrastructures, such as urban forests, street trees, and green corridors (Hagishima, 2018; Arellano and Roca, 2022). Vegetation can have a significant cooling effect on the surrounding environment, as it absorbs solar radiation, provides shade, and facilitates evapotranspiration, which helps to lower air temperatures (Georgi and Dimitriou, 2010). Additionally, green spaces can help to reduce wind speeds, improve air quality, and provide other ecosystem services that contribute to a more comfortable urban environment (Li et al., 2020).
The UHI effect can be explored through two distinct layers: the canopy urban heat island (CUHI) and the surface urban heat island (SUHI) (Peng et al., 2022). CUHI is generally investigated using air temperature data from local meteorological observations or in situ measurements (Hu et al., 2019), while SUHI is typically studied using land surface temperature obtained via remote sensing (Anniballe et al., 2014; Soberón-Forsberg and Obregón-Párraga, 2016; Chakraborty et al., 2020). These UHI types are examined at various scales, including microscale, local scale, and mesoscale (Kim and Brown, 2021). Although both CUHI and SUHI involve energy exchanges between the land surface and the atmosphere (Huang et al., 2020), numerous studies prioritize CUHI over SUHI when investigating the relationship between UHI and heat stress, thermal comfort, and public health (Aram et al., 2020).
UHIs, intensified by climate change, can exacerbate air pollution by promoting the formation of tropospheric ozone, posing additional risks to public health. According to Heaviside et al. (2017), the increased heat in urban areas poses a direct health risk, with severe consequences such as dehydration, heart attacks, and aggravation of chronic diseases (Tewari et al., 2019). This increased heat also causes a rise in energy demand for cooling and air conditioning systems, exacerbating the emission of air pollutants from power plants.
On the other hand, the thermal variability between urban and rural areas can negatively impact biodiversity and the resilience of urban ecosystems. As urbanization accelerates, UHIs become more prominent, highlighting the urgency of addressing these challenges. A study conducted in Seville, Spain, by Álvarez-Domínguez et al. (2022) suggests that decreasing automobile circulation and prioritizing vegetation and permeable surfaces in urban design are some effective UHI mitigation strategies. Additionally, green infrastructure on roofs and facades can reduce the impact of UHIs through the cooling effect of the metabolic processes of vegetation (Irfeey et al., 2023).
Previous research has focused on analyzing the effectiveness of green infrastructure in mitigating the effects of UHIs using temperature and humidity sensors. Studies have found that trees in parks can reduce temperatures by up to 2 ºC (Tejedor et al., 2016). Similarly, Salas-Esparza and Herrera-Sosa (2017) observed a significant difference of 3.82 ºC between areas with trees and those exposed to direct sunlight, as well as an average variation of 4% in relative humidity between these same areas. Another study conducted in Rome compared air temperatures on a university campus with those in a greener neighborhood, where an average UHI index of 1.14 ºC was recorded, reaching up to 2.65 ºC from 9:30 to 19:00 LT. This highlights the importance of tree height, as its effect on air temperature is due to its ability to obstruct wind, rather than solely providing shade (Battista et al., 2020). These cases demonstrate the need to study the impact of various green infrastructure interventions to mitigate UHIs, as their effectiveness depends on the specific configuration and characteristics of the infrastructure. This information is essential to optimize urban designs adapted to local conditions.
Lima (Peru’s capital) has experienced significant population growth over the past decades, accompanied by rapid urbanization and expansion of impervious surfaces, leading to the emergence of UHIs within the city. According to the Strategic evaluation of measures to reduce the urban heat island effect in the Province of Lima, prepared by the Metropolitan Municipality of Lima, several mitigation measures were proposed to address the impact of UHIs. These measures include increasing urban tree coverage, creating green spaces, and implementing cool surfaces, among others. Simulation results demonstrated that implementing green corridors alone reduced UHI occurrences by 0.5 ºC, while combining them with other strategies achieved a reduction of up to 1.2 ºC (MML et al., 2021).
The district of Lince, situated in the central area of Lima, has been identified as one of the most affected regions by the UHI effect, primarily due to the high concentration of commercial and residential buildings, coupled with the limited presence of green spaces. This limited access to green areas particularly impacts lower-income populations, who are more exposed to heat waves compared to higher-income groups in Lima (Ascencio et al., 2023). To counter this scenario, the strategic evaluation proposes the implementation of various measures, including the expansion of Lomas areas, the establishment of green corridors, the introduction of cool surfaces, and increased urban tree planting (MML et al, 2021).
This study aims to evaluate a heat island mitigation strategy based on a green corridor in Lima, using temperature and humidity sensors, together with numerical atmospheric modeling data. The primary purpose is to inform more effective decision-making by urban planners and government authorities when planning new green areas or spaces. These interventions seek to counteract the impacts of UHIs, transforming city areas into environments resilient to climate change.
2. Data and methods
2.1 Study area
The study area is the district of Lince (Fig. 1), located in the province of Lima, Peru (12º 2’ 35.45” S, 77º 1’ 41.66” W). It covers an area of 3.03 km² with a population of 54 711. Lince is among the 10 districts most affected by the UHI effect (MML et al., 2021). Despite being home to one of the largest and most biodiverse green spaces in Lima, the district is dominated by asphalt and cement.
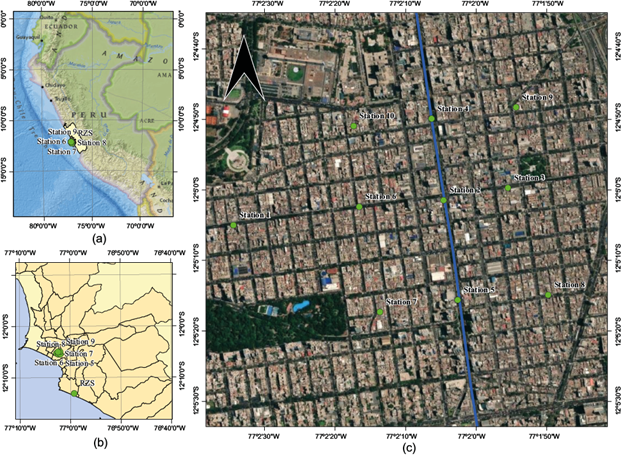
Fig. 1 (a) Lima, Peru; (b) Lima’s metropolitan area and location of the green corridor and rural zone station (RZS); (c) location of the Arequipa Avenue’s green corridor and the stations.
Within this study area, observation points were selected following the criteria provided by Ahn et al. (2021): (i) green corridors are located in the middle of streets; (ii) urbanized environments with similar land use and atmospheric conditions between them; (iii) green corridors with exclusive paths for pedestrians and cyclists, with no vehicular movement inside, and open to the public 24 hours a day, 365 days a year.
It is possible to identify the UHI better in winter than in summer, since this season is when the temperature range between urban and vegetation areas is better distinguished (Flores-de la O et al., 2018). Therefore, it was decided to conduct the study in winter for the city of Lima. According to the National Service of Meteorology and Hydrology of Peru (SENAMHI), Lima’s winter spans from June to September, with temperatures ranging from 13 to 19 ºC. This period is characterized by humid days, fog, morning drizzle, and stable atmospheric conditions, with annual precipitation not exceeding 8 mm (SENAMHI, 2021). The enhanced perception of the UHI effect in winter can be attributed to reduced solar radiation and minimal energy transfer, allowing UHI impacts to be more noticeably observed under microclimatic conditions (Suomi, 2014).
Five observation points were chosen as the most significant, representing the prevailing microclimate. Four were positioned at the ends of the avenues, and one at the intersection between them, to validate the comparison. Sensors were installed at these locations for direct monitoring. Additionally, five reference stations were created, parallel to the points where field monitoring was conducted, to obtain complementary information from the WRF numerical model. For the thermal analysis, and due to the absence of a station in the rural area, a point located in the Pantanos de Villa area in the district of Chorrillos was designated as the rural zone station (RZS). The geographical locations of these points are detailed in Table I.
Table I Location of stations (observation points) for the determination of the canopy urban heat island (CUHI) in the study area.
| Stations | Latitude | Longitude | Districts | Avenue | Location |
| Station 1* | -12.0847 | -77.0429 | Lince | Francisco de Zela | Outside the corridor |
| Station 2* | -12.0837 | -77.0346 | Lince | Arequipa | Intersection between corridor and avenue without intervention |
| Station 3* | -12.0832 | -77.0321 | Lince | Francisco de Zela | Outside the corridor |
| Station 4* | -12.0805 | -77.0351 | Lince | Arequipa | Inside the corridor |
| Station 5* | -12.0876 | -77.0340 | Lince | Arequipa | Inside the corridor |
| Station 6** | -12.084 | -77.038 | Lince | Canevaro | Outside the corridor |
| Station 7** | -12.088 | -77.037 | Lince | Los Pinos | Outside the corridor |
| Station 8** | -12.087 | -77.030 | Lince | Pedro Conde | Outside the corridor |
| Station 9** | -12.080 | -77.032 | Lima | Emilio de Althaus | Outside the corridor |
| Station 10** | -12.081 | -77.038 | Lima | Emilio de Althaus | Outside the corridor |
| Rural zone station (RZS) | -12.2163 | -76.9856 | Chorrillos | Located in the area outside the urban zone to the south of the city of Lima. |
*Observation points in field data collection and the WRF model; **observation points only in the WRF model.
2.2 Data collection
Field data were taken at each observation point for temperature and humidity variables using thermohygrometer devices (Yuwese data logger model SSN-22ET), with a temperature measurement range of -35 to 80 ºC. These devices were placed inside shelters to provide natural ventilation and protection from radiation, ensuring reliable measurements. According to Baranka et al. (2016), the recommended height for UHI assessment is between 1.25 and 2 m above ground level for urban sites. However, in densely urbanized areas, a higher placement is advisable. In this study, the devices were mounted at a height of 4 m on trees along the study avenues for security reasons. As the streets are flanked by buildings on both sides, this configuration generates a canopy effect, ensuring the air is generally well mixed (Nakamura and Oke, 1988). As a result, measurements taken at this height do not significantly differ from those taken at 2 m.
The data was collected every hour to compare variables across different avenues throughout the day. Our measurement campaign spanned from August 23, 2022, at 14:00 LT, to September 13, 2022, at 14:00 LT. For the selection of days for analysis, we focused on the 90th percentile of the data, specifically targeting the days with the highest recorded temperatures.
In addition to the in-situ measurement of temperature and humidity, remote sensing data were used to analyze vegetation cover through the Normalized Difference Vegetation Index (NDVI), which is an essential metric for assessing vegetation health, with values ranging from −1 to +1, where negative values correspond to non-vegetated surfaces, values near 0 indicate sparse vegetation, and values close to +1 represent dense vegetation (Cetin et al., 2024). NDVI was calculated using Sentinel-2 imagery via the Google Earth Engine platform, following the formula presented in Eq. (1) (Ullah et al., 2022):
The images were filtered by location, date range, and cloud cover percentage, representing different periods (March to August 2022). Median values were computed to minimize atmospheric interference, ensuring stable and accurate results for vegetation analysis. The NDVI values were then exported to ArcGIS for further analysis, providing a comprehensive view of vegetation dynamics in the study area.
2.3 Methods
2.3.1 CUHI intensity
The maximum CUHI intensity (CUHII) is determined from the maximum temperature difference between the urban weather station and the rural station during the study period. This approach follows the methodology proposed by Oke et al. (2017).
where T U is the temperature of the urban stations and T R that of the rural station. This method of comparing urban and rural temperatures offers a straightforward and systematic means to quantify the CUHI. However, accurate CUHI estimates depend on the appropriate selection of the rural reference area. In this study, the rural zone station (RZS) was chosen based on the approach described by Stewart et al. (2014). This station is situated on relatively flat terrain and is surrounded by extensive farmland, with significantly less impervious surface than the urban sites.
Stations were used for CUHII estimations. Point 1 was discarded because it is in the zone of influence of another important green area in the Lince district, and point 5 was discarded because the 500-m resolution of the model showed the same information as point 7. To select the days for analysis, the 90th percentile of data from days with the greatest differences in CUHII between observation points was used. The average and variance of temperature at each observation point are summarized in Table II.
Table II Temperature average and variance of the stations in the WRF model.
| Observation points | Count | Average | Variance |
| Station 1 | 503 | 15.46 | 1.66 |
| Station 2 | 503 | 15.57 | 3.55 |
| Station 3 | 503 | 15.50 | 2.72 |
| Station 4 | 503 | 15.01 | 1.01 |
| Station 5 | 503 | 15.35 | 1.25 |
| Station 6 | 503 | 15.49 | 1.52 |
| Station 7 | 503 | 15.52 | 1.66 |
| Station 8 | 503 | 15.57 | 1.96 |
| Station 9 | 503 | 15.58 | 2.03 |
| Station 10 | 503 | 15.49 | 1.52 |
2.3.2 Weather Research and Forecasting Model
WRF v. 4.1.2 was used to determine the temporal variations of UHI, as there are no meteorological stations in rural areas near the study region, and the existing urban stations are located at considerable distances. The simulation design incorporates three domains, following similar studies conducted in urban environments (Bilang et al., 2022). The first domain, with a resolution of 12.5 km, encompasses the area of Peru. The second domain, with a resolution of 2.5 km, covers the central coastal region of Peru. The third domain focuses on the urban area of the Lima region, centered on the districts of Lince and Jesús María (12.08º S, 77.03º W), with a 0.5-km resolution. The Morrison two-moment microphysics parameterization scheme was employed, based on previous studies conducted in Peru to evaluate the effect of topography on atmospheric modeling results (Martínez-Castro et al., 2019). The simulation data were obtained from the Global Forecast System platform, with a resolution of 0.5º, spanning every 3 h from August 22 at 00:00 UTC to September 14 at 18:00 UTC, to match the observation period of the sensors. Model outputs were generated hourly, and the analysis focused on the air temperature variable at a height of 2 m.
To analyze the UHI effect along the corridor using the WRF model, the study focused on three sections along its length, with nine reference points. Three points were selected in the northern section, three in the central section, representing a mix of land use and urban characteristics, and three in the southern section. The WRF simulation results for these points provided high-resolution spatial and temporal data, enabling a detailed assessment of CUHI variations and their relationship to land use and urban features along the corridor. To further assess these variations, an analysis of variance (ANOVA) was performed to evaluate differences in the CUHI across different data groups based on observation points, with statistical significance tested at the 0.05 level.
3. Results and discussion
The study compares air temperatures between Arequipa Avenue, which has a green corridor, and Canevaro Avenue, which does not. Sensors 1-3 were located on Canevaro Avenue without the green corridor, while sensors 4-5 were within the green corridor of Arequipa Avenue. The results show that under certain meteorological conditions, the green corridor of Arequipa Avenue exerts a cooling effect compared to the non-green corridor of Canevaro Avenue. Figure 2 presents the temporal variations in temperature for the urban weather stations. The maximum temperature difference between the stations with a green corridor and the rural station was observed in the afternoon and evening hours, with values reaching up to 5.4 ºC (Anjos and Lopes, 2017).
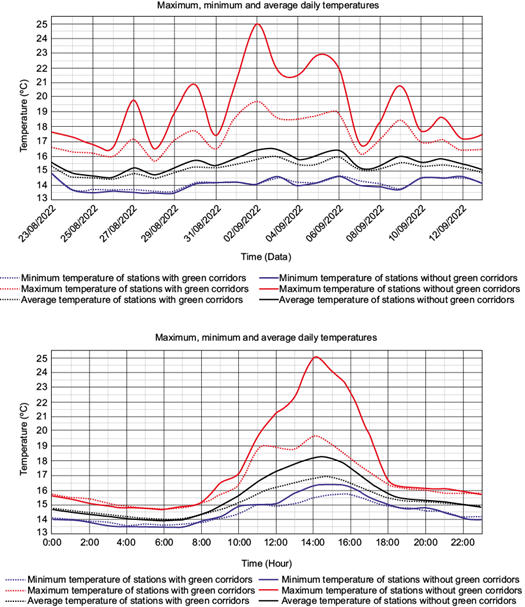
Fig. 2 (a) Daily time evolution of air temperature (ºC) from field data for the period August-September 2022; (b) hourly time evolution of air temperature (ºC) from field data for the period August-September 2022.
This diurnal pattern of the urban heat island effect has been well documented in previous studies conducted in the central Andes region of Peru (Suárez-Salas et al., 2017; Flores-Rojas et al., 2019, 2021). The peak urban UHI coincides with the times when anthropogenic heat loads and human activity are highest in the urban area, due to transportation and other activities during the warmer parts of the day.
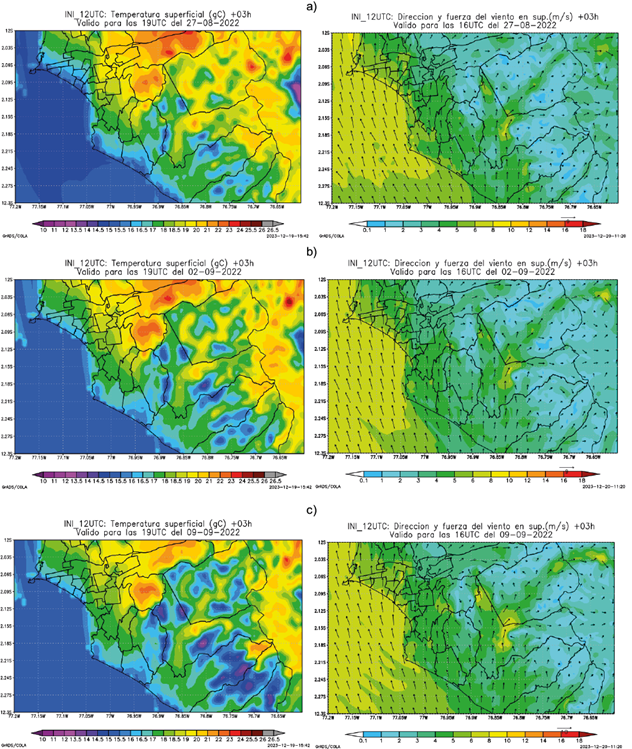
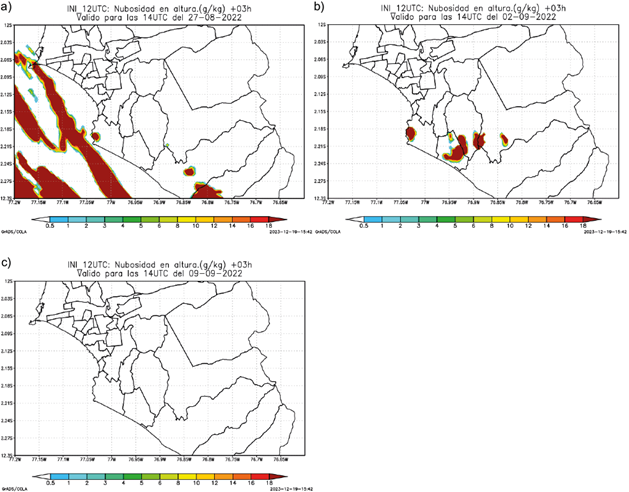
The days with the maximum temperature values were characterized by clear skies, weak winds with speeds below 2 m s-1, as seen in Appendix A, and low cloud density at an altitude of 500 m (Fig. S1 in the supplementary material). Additionally, there was cloud cover over the oceanic zone or further south of the study area. This low cloudiness and weak wind conditions created an environment that favored a significant increase in air temperature. This observation aligns with the findings of al-Obaidi et al. (2021), who indicate that the highest UHI intensities are recorded when the wind is weak (less than 2 m s-1), while the lowest magnitudes are found when the wind speed exceeds 6 m s-1. Consequently, the temperature peaks were observed between 12 and 16 h on the identified days.
The results show that there are statistically significant differences between the air temperatures of stations located in the green corridor and those located in the avenue without the corridor. Stations 4 and 5 within the green corridor showed lower average temperatures than stations 1, 2 and 3 without the corridor. This suggests that the green corridor of Arequipa Avenue has a cooling effect, mitigating the CUHI by up to 0.5 ºC on average (Fig. 3).
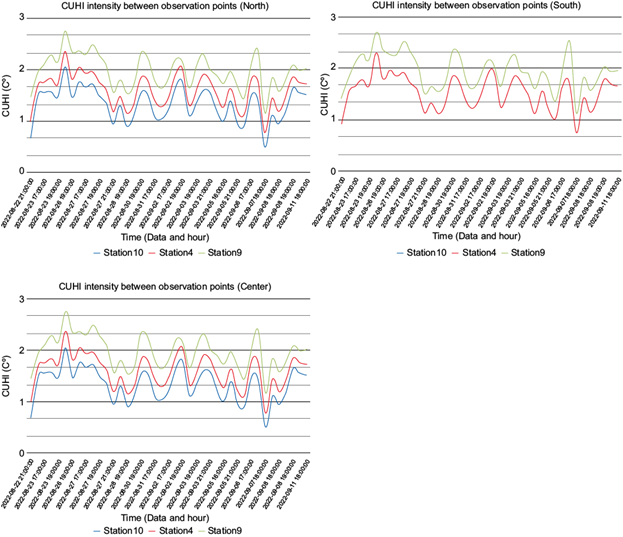
Fig. 3 90th percentile of data from days with the greatest differences in canopy urban heat islands (CUHIs) intensity between observation points. (a) Comparison between stations 10, 9 outside the corridor and 4 inside the corridor. (b) Comparison between stations 7, 8 outside the corridor and 5 inside the corridor. (c) Comparison between stations 6, 3 outside the corridor and 2 in the intersection between the corridor and the avenue without it.
The 0.5 ºC average reduction achieved with the green corridor is consistent with the magnitudes reported in the literature. For example, studies in Brazil (Anjos and Lopes, 2017) and India (Mohan et al., 2012) reported PCI intensities of 1.5-2 ºC and 1-1.5 ºC, respectively. Studies in Hong Kong (Wong et al., 2009) also showed that more green spaces can reduce ambient air temperatures by up to 1 ºC. The ANOVA test showed statistically significant differences between the groups with and without green corridors, demonstrating the cooling effect of the green infrastructure. The results confirm the findings of previous studies, which have shown that green infrastructure can contribute to mitigating the UHI effect (Li et al., 2020).
The evaluation of the CUHI intensity was conducted by comparing air temperature at a 2-m height, as estimated by the model at the recording points, with a point located outside the urban area to the south of the city of Lima. Table III shows the existence of CUHI at stations 3, 4, and 5, with the maximum value located in the area of Point 3, which is situated precisely on the avenue without a green corridor. The CUHI obtained by the model presents the occurrence of higher intensities between 12:00 and 16:00 LT (Fig. 3). According to Moreno et al. (2023), this behavior is expected in a subtropical zone, because the amount of direct solar radiation reaching the Earth’s surface is maximum and there is a higher cooling rate in the rural point. The findings of this study underscore the significant potential of incorporating green corridors as an effective strategy to mitigate UHI effects in Lima. Although the highest intensity value of the CUHI was observed on August 23, the differences between the CUHI intensity inside and outside the corridor were higher on August 28 and September 6, with values ranging between 0.53 and 0.66 ºC higher in the area outside the corridor. Apparently, the presence of the corridor would also reduce the effect of CUHI in the study area.
Table III ANOVA comparing CUHII values between stations with and without green corridors.
| Source of variation | SS | df | MS | F | P-value |
| Between groups | 39.25 | 9 | 4.36 | 40.48 | 0.000000001 |
| Within groups | 43.09 | 400 | 0.11 | ||
| Total | 82.34 | 409 |
The green corridor area is generally located in a transition zone with CUHII values ranging from 3 to 1 ºC (Fig. 4). These values represent the temperature difference compared to the rural zone station, indicating how much higher the temperature is in the study area relative to the cooler rural baseline. This transition is most distinctly observed between 16:00 and 21:00 UTC, when the temperature variation becomes more pronounced (Fig. 5).
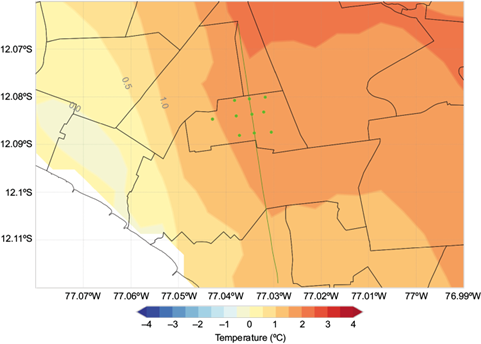
Fig. 4 Daily maximum canopy urban heat islands (CUHI) over the city of Lima, based on WRF model results for the period August 22 to September 13, 2024.
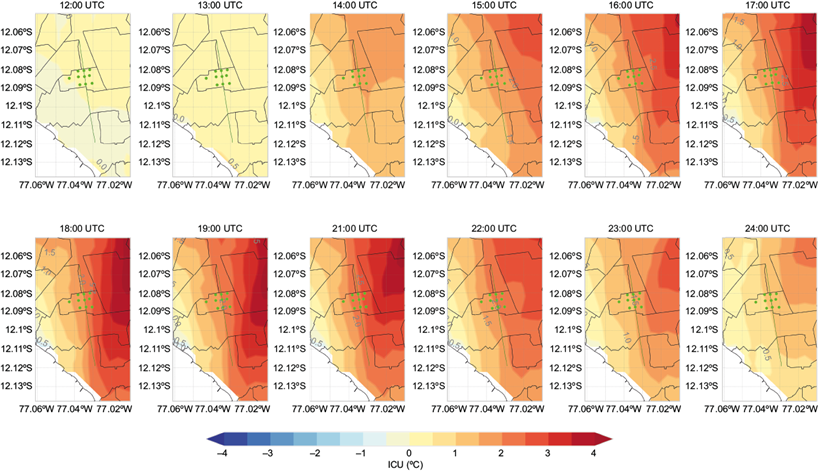
Fig. 5 Results from the WRF model showing the calculated canopy urban heat islands’ (CUHI) intensity data, provided on an hourly basis between 12:00 and 23:00 UTC, based on the weather conditions simulated by the model.
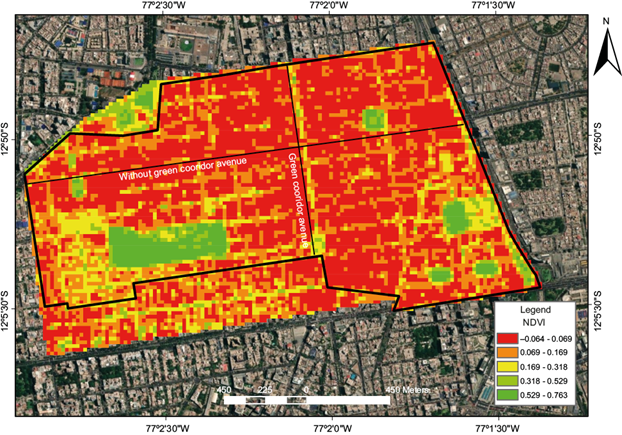
The NDVI analysis indicates that the green corridor area exhibits moderate to high vegetation density compared to the avenue without a green corridor and its surroundings, which show very low vegetation densities (Fig. 6). This allows us to attribute the temperature reduction in areas near the corridor to the presence of vegetation.
In summary, the findings of this study support the hypothesis that the presence of green corridors can significantly reduce urban peak temperatures, thus offering both environmental benefits and improvements in the quality of life for urban residents. Moreno et al. (2023) found that greenways and natural parks provided a greater reduction in the UHI effect compared to other mitigation measures, likely due to their continuous surface area, higher vegetation content (both grass and trees), and lower presence of urbanized elements. This confirms the importance of vegetation in the design of public spaces for controlling the UHI effect.
On the other hand, they underscore the importance of considering these elements as essential tools for adapting cities to climate change, as was the case in Hong Kong, where future temperature increase scenarios would have marked effects on UHI (Wong et al., 2016). With the growing concern over rising urban temperatures and extreme weather events, the strategic implementation of green areas emerges as a crucial measure to mitigate negative impacts on urban quality of life (Voelkel et al., 2018).
This effect is not uniform across the city and is subject to inequalities in living conditions, ages, gender, and ethnic groups among the population of different districts in Lima (Fernández-de-Córdova et al., 2021; Moreno et al., 2023). Often, we find that green areas are unevenly distributed, being more accessible in some urban areas than in others. This not only perpetuates inequality in terms of environmental quality and well-being but also exacerbates disparities in communities’ adaptive capacity to climate impacts.
Urban planning must, therefore, address these disparities and prioritize the implementation of green corridors in historically underserved areas. Studies such as the one by Cui and de Foy (2012) in Mexico City highlighted these aspects, pointing out the importance of incorporating green infrastructure in large cities to prevent negative future effects. Additionally, it is crucial to consider community participation in the planning and design of these spaces, ensuring they are inclusive and beneficial for the entire population.
While the findings of this study suggest the cooling effect of the green corridor in Arequipa Avenue, it is important to consider potential limitations and counterarguments. The observed temperature reduction of up to 0.5ºC on average and the mitigation of the UHI effect with differences of up to 0.6 ºC may not be substantial enough to significantly impact urban climate and human thermal comfort. Factors such as the size, vegetation density, and distribution of the green corridor could influence the magnitude of the cooling effect (Narváez et al., 2021). However, the results are similar to those found in the analyses conducted by the Municipality of Lima for 2017 and 2018, which include summer and spring, respectively (MML et al., 2021). Although the season of the year for this study is not the same, the values obtained fall within the range of 0.5 to 1.2 ºC, modeled to assess the cooling effect achieved by implementing green infrastructure to reduce the UHI in the city of Lima.
Additionally, the relatively short study period and the lack of data on other meteorological variables, such as wind speed, humidity, and solar radiation, limit the ability to fully understand the complex relationships between the green corridor and the UHI effect. It is possible that other factors, such as urban design, building materials, and anthropogenic heat sources, could have a more dominant influence on the UHI effect compared to the green corridor (Jiang et al., 2021; Arellano and Roca, 2022). Furthermore, the evaluation of the green corridor’s impact on energy consumption and human thermal comfort was not included in this study. The observed cooling effect may not necessarily translate to significant energy savings or improved thermal comfort for urban residents. More comprehensive research is needed to fully assess the broader implications of green corridors on the urban environment and human well-being. However, this study still provides valuable insights into the potential of green infrastructure to mitigate UHI effects in Lima and serves as a foundation for further investigation and policy development. As noted by Ascencio et al. (2023), the poorest populations in the city of Lima are the most exposed to the effects and impacts of heat waves, which is why these interventions have high social and environmental value.
4. Conclusions
This study aimed to quantify the cooling effect of a green corridor along Arequipa Avenue in Lima, Peru, and assess its potential to mitigate the urban heat island effect. The results clearly demonstrate that the presence of the green corridor can contribute to reducing the urban heat island effect by up to 0.6ºC compared to areas without the corridor. The findings of this study indicate that incorporating green corridors into urban planning and design could be an effective strategy for mitigating UHI effects in Lima, and potentially in other cities with similar climatic and urban characteristics.
Additionally, the study underscores the urgency of concrete policies and actions to expand and improve green areas in specific urban regions, highlighting the need for climate change adaptation strategies that comprehensively address inequalities in the availability of these resources. Therefore, the implementation of green corridors is justified not only by their immediate environmental benefits but also as an essential tool for building more equitable cities prepared to face the challenges of climate change. Further research is needed to fully understand the complex relationships between green infrastructure, urban climate, and human thermal comfort, as well as the broader implications on energy consumption and urban sustainability.