


 nueva página del texto (beta)
 Inglés (pdf)
 Artículo en XML
 Referencias del artículo
 Enviar artículo por email
 Citado por SciELO
  Similares en
SciELO
Similares en
SciELO 
 Permalink
1. Introduction
Jalisco, located in western Mexico, is one of the states with the greatest contribution to the nation’s gross domestic product (GDP), covering an area of 78 595.9 km2. According to the Instituto Nacional de Estadística y Geografía (National Institute of Statistics and Geography) (INEGI, 2022), Jalisco was the fourth largest contributor to the GDP in 2021, with 7.3%, and the first entity in primary economic activities, mainly integrated by agriculture, livestock, and forestry. The state ranks first in fodder maize, pasture, and agave production. Therefore, atmospheric deviations affecting wet and dry periods might have an impact on the development of economic and human activities for the entire country. Moreover, equatorial deviations in sea surface temperature (SST) with global effects, such as El Niño-Southern Oscillation (ENSO), significantly modulate the precipitation regime in Mexico (Pavia et al., 2006; Salas-Flores et al., 2014). Depending on the ENSO phase, it can generate anomalously dry conditions in some regions, producing subsidence that inhibits convective organization (Magaña et al., 2003a; Wang and Enfield, 2003).
Subsidence, generally caused by anticyclonic circulations, is responsible for causing drought spells that are recurrent and irregular meteorological phenomena. Droughts, lasting weeks, months, or years, can have catastrophic consequences. This natural dry period has been associated with negative impacts on water supply and food production in many regions of the world, affecting regional development and reducing water availability for long periods of time and over large areas of land (Oñate-Valdivieso et al., 2020). The main effects can be observed in agriculture, land cover, soil moisture, and the decrease of surface and underground water bodies (Anderson et al., 2018). In addition, droughts can influence other events, such as heat waves that can increase the risk of wildfires (Fischer et al., 2007; Aghakouchak et al., 2018).
As a result of the severe drought that occurred in Mexico from 2010 to 2012, an institutional and legal framework was established in 2013 to address the consequences of this phenomenon, empowering the Comisión Nacional del Agua (National Water Commission, CONAGUA) to issue general agreements in emergency situations, with the aim of mitigating droughts in Mexico and declaring alerts for this phenomenon. However, droughts have been increasingly longer and with greater intensity (Banco de Mexico, 2022), affecting the number of municipalities. This situation reflects the adverse medium- and long-term drought effects, not only on water resources but also in electric power generation (Anderson et al., 2018).
Different methodologies exist to characterize meteorological droughts. One example is the Standardized Precipitation Index (SPI) developed by Mckee et al. (1993). Recently, the SPI has been applied in several studies to estimate drought intensity and duration in Mexico. For example, Vega-Camarena et al. (2018) described the oceanic-atmospheric conditions of the most severe and persistent droughts in the Mexican Altiplano; Esquivel-Arriaga et al. (2019) performed a temporal drought analysis in the upper Nazas River basin finding that negative SPI values are related to La Niña conditions; Llanes et al. (2022) analyzed the frequency and meteorological drought evolution in the region of Sinaloa; and Esquivel-Sáenz (2024) used the SPI for the Zacatecas region to test a multilayer perceptron artificial neural network as a model to forecast the monthly SPI in northern-central Mexico.
On the other hand, ENSO not only causes anomalous dry periods but can also generate anomalously wet periods favored by deep convection. In this scenario, many studies have attempted to describe the effects of ENSO on seasonal rainfall variability in Mexico (Reyes and Mejía-Trejo, 1991; Castro et al., 2001; Pavia et al., 2006; Seager et al., 2009; Zolotokrylin et al., 2016). For instance, higher rainfall expected under the cold phase of ENSO (e.g., La Niña) produced by tropical cyclones (Domínguez et al., 2021) usually leaves a large amount of precipitation in their wake, leading to extreme precipitation events.
Different criteria exist to define an extreme daily precipitation (EDP) event; in some cases, the percentile technique (Zúñiga and Magaña, 2018) is adjusted to a probability distribution, such as the gamma distribution (Grimm and Tedeschi, 2009) to determine thresholds, above which an extreme value is defined. In other cases, extreme precipitation events result from the products of the Expert Team on Climate Change Detection Monitoring and Indices (ETCCDI) (Zhang et al., 2011; Salameh et al., 2022). Various studies in Mexico have recently attempted to characterize EDP events (Magaña et al., 2003b; Arriaga-Ramírez and Cavazos, 2010; León-Cruz et al., 2022, 2023; Vega-Camarena et al., 2024).
The present research studied drought events with large coverage, as well as the most recent drought events. Section 1 presents a study of drought events. Section 2 describes the analysis and data quality used in the present study and the approach to defining droughts and EDP events. Section 3 explores the characteristics of recent droughts and drought events with large surface coverage, as well as EDP events in Jalisco, and provides a unique analysis of the relationship between these phenomena and ENSO. Section 4 analyzes the results and the distribution of the drought events with the largest coverage, as well as the frequency of extreme daily precipitation events. Lastly, section 5 summarizes this research to highlight the main conclusions.
2. Methodology
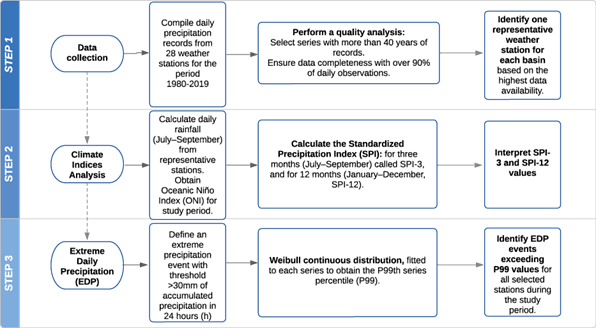
The methodology for the present study involved several steps, including data collection, climate index, analysis to calculate the SPI, and extreme precipitation event analysis. The latter was conducted using a fitted Weibull continuous distribution to determine the 99th percentile (P99) of the precipitation series. Figure 1 summarizes the steps of the methodology.
2.1 Study area and data
The state of Jalisco is located in western Mexico (Fig. 2). Approximately 68% of the state’s surface area has warm sub-humid climate along the coast and in the central zone; 18% is temperate sub-humid in the higher parts of the sierras, and 14% is dry and semi-dry in the northern and northeastern parts of the state. The state’s average annual precipitation is around 850 mm; however, precipitation is more than 1000 mm in the coastal zones (INEGI, 2024). The summer rain propagation from southern Mexico in May, with an important increase in June, is a major rainfall source maintained until September, when a marked reduction of the summer rainy season is observed (Douglas et al., 1993; Brito-Castillo et al., 2022). On the other hand, winter rains are produced by extratropical storms that rarely reach the latitudes of the state of Jalisco (Jáuregui, 1995; Brito-Castillo et al., 2003), which is the reason to focus on identifying the occurrence of extreme events during the summer season (July-September).
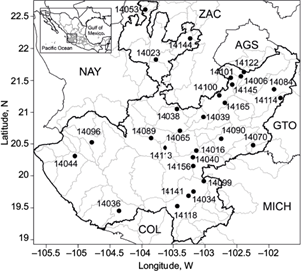
Fig. 2 Location of 28 weather stations in Jalisco, Mexico (dots). The solid line displays the state’s polygon, and the gray lines are the basin boundaries. COL: Colima, MICH: Michoacán, ZAC: Zacatecas, NAY: Nayarit, AGS: Aguascalientes, GTO: Guanajuato.
Daily observations of the database by the National Meteorological Service of Mexico (SMN; https://smn.conagua.gob.mx/es/climatologia/informacion-climatologica/informacion-estadistica-climatologica) are compiled from 28 weather stations for the base period of 1980-2019 (Fig. 2). A quality analysis was performed by selecting series with more than 40 years of records and more than 90% of daily observations. For this research, one representative station was selected for each basin, according to the station with the most daily data (Table I). Total rainfall for the summer was calculated from daily records of the representative stations.
Table I Selected climatological stations in the state of Jalisco, Mexico, for the period 1980-2019.
| No. | Station | Latitude | Longitude | Basin | Elevation (m) | % of data |
| 1 | 14006 | 21.5 | -102.4 | Río Verde Grande | 1745 | 95.5 |
| 2 | 14016 | 20.4 | -103.1 | Río Santiago - Guadalajara | 1520 | 94.3 |
| 3 | 14023 | 21.8 | -103.8 | Río Bolaños | 963 | 95.7 |
| 4 | 14034 | 19.8 | -103.2 | Río Coahuayana | 1160 | 91.8 |
| 5 | 14036 | 19.5 | -104.4 | Río Chacala - purificación | 600 | 95.4 |
| 6 | 14038 | 21.1 | -103.4 | Río Santiago - Guadalajara | 1000 | 96.0 |
| 7 | 14039 | 20.9 | -103.0 | Río Santiago - Guadalajara | 1790 | 93.2 |
| 8 | 14040 | 20.3 | -103.2 | L. Chapala | 1530 | 96.0 |
| 9 | 14044 | 20.3 | -105.0 | Río Tomatlán - tecuán | 1704 | 93.6 |
| 10 | 14053 | 22.6 | -103.9 | Río Huaynamota | 1684 | 94.0 |
| 11 | 14065 | 20.7 | -103.4 | Río Santiago - Guadalajara | 1551 | 94.7 |
| 12 | 14070 | 20.5 | -102.2 | Río Lerma - Chapala | 1619 | 95.0 |
| 13 | 14084 | 21.4 | -101.9 | Río Verde grande | 1884 | 93.6 |
| 14 | 14089 | 20.6 | -103.9 | P. La vega - cocula | 1260 | 94.8 |
| 15 | 14090 | 20.6 | -102.7 | Río Santiago - Guadalajara | 1588 | 94.3 |
| 16 | 14096 | 20.5 | -104.8 | Río Ameca - Ixtapa | 1230 | 95.6 |
| 17 | 14099 | 19.9 | -103.0 | Río Coahuayana | 2290 | 93.5 |
| 18 | 14100 | 21.3 | -102.8 | Río Verde grande | 1750 | 94.1 |
| 19 | 14101 | 21.5 | -102.6 | Río Verde grande | 1860 | 93.5 |
| 20 | 14113 | 20.4 | -103.6 | L. Chapala | 1400 | 92.7 |
| 21 | 14114 | 21.2 | -101.8 | Río Lerma - Salamanca | 1950 | 92.9 |
| 22 | 14118 | 19.5 | -103.4 | Río Coahuayana | 1045 | 94.1 |
| 23 | 14122 | 21.6 | -102.4 | Río Verde grande | 1800 | 95.0 |
| 24 | 14141 | 19.7 | -103.3 | Río Coahuayana | 1450 | 93.0 |
| 25 | 14144 | 22.2 | -103.2 | Río Bolaños | 1710 | 93.0 |
| 26 | 14145 | 21.4 | -102.6 | Río Verde grande | 1740 | 94.3 |
| 27 | 14156 | 20.2 | -103.2 | L. Chapala | 1530 | 93.8 |
| 28 | 14165 | 21.1 | -102.7 | Río Verde grande | 1850 | 93.5 |
2.2 Climate indices and drought definition
Various indices monitor climate oscillations. In this study, we use the Oceanic Niño Index (ONI), which records the three-month mean SST anomalies in the tropical Pacific for the Niño 3.4 region (5º N to -5º S, 120º to 170º W). The present study defines ONI as ONI+ (ONI-) when its value exceeds 0.5 (is less than -0.5). Index values were obtained from the National Oceanic and Atmospheric Administration and Earth System/ Physical Sciences Laboratory (NOAA/PSL; https://psl. noaa.gov/data/climateindices/list/index.html).
The SPI (Mckee et al., 1993), recommended by the World Meteorological Organization, was applied to representative series to characterized meteorological droughts (WMO, 2012; Carrão et al., 2014; Vega-Camarena et al., 2018; Nwayor and Robeson, 2023). The SPI at monthly, semi-annual, and annual time scales involves adjusting the historical accumulated rainfall records in n months to the function of incomplete gamma probabilistic distributions (Guenang and Kamga, 2014). The resulting values were transformed to standardized values (z variable values) of the normal standard distribution function (Steinemann, 2003; Wu et al., 2005).
Edwards and McKee (1997) stated that a gamma probability density function for a given empirical precipitation distribution from a region or an individual station is fitted by:
where α is a shape parameter (α > 0), β is a scale parameter (β > 0), and x is the amount of precipitation (x > 0); and
where Γ(α) is the gamma function.
Parameters α and β are estimated for each time scale of interest and each week or month of the year, depending on whether SPI is calculated weekly or monthly:
where
Here, n is the series length and x̅ is the mean precipitation during the time scale of interest. The cumulative probability of each observed precipitation event for the given time scale of the station of interest is then computed using the estimated shape and scale parameters. An equiprobability transformation is made from the cumulative probability to a standard normal random variable Z, with mean 0 and variance equal to 1, where the SPI takes the value of Z. Thus, positive values indicate high precipitation and negative values indicate low precipitation, with respect to the historical average. This procedure allows a determination of short-, medium-, and long-term frequencies, intensities, and drought duration (Guttman, 1999; Hayes et al., 1999).
In the present research, SPI was calculated for each climatological station series for the period 1980-2019, in two time-scales, for three months (July-September), called SPI-3, and for 12 months (January-December), called SPI-12. SPI-3 is suitable for monitoring drought conditions in the surface layer over a short term, which is essential for agricultural management (Mishra and Singh, 2011). SPI-12 is required for monitoring levels of groundwater and surface water supplies (Mishra and Singh, 2011; de la Barrera et al., 2020). The onset of a drought event occurs when SPI takes a value ≤ -1 and lasts until the index becomes positive for at least three or 12 months, depending on the time scale (Mckee et al., 1993).
2.3 Extreme daily precipitation events
The present study followed the methodology used by Vega-Camarena et al. (2023). An EDP event was defined by initially considering a threshold of 30 mm of accumulated precipitation in 24 h for the summer series (July-September) in 1980-2019. Summer precipitation series (≥ 30 mm) were ordered chronologically from the lowest to the highest to determine the 99th percentile (P99) of each series. Local hydrological studies and civil protection reports indicate that rainfall below this value (30 mm) typically does not result in significant flooding impacts (Vega-Camarena et al., 2023). While this threshold differs from global standards, it aligns with the localized conditions of the present study area, including soil saturation levels and urban drainage capacity (Prokešová et al., 2022). Using the 99th percentile (P99) during the humid months (July-September) ensures the analysis focuses on the most impactful extreme precipitation events during the region’s wettest period, where flooding risks are heightened.
The P99 value for each series was taken as the threshold for determining an EDP event. Extreme events with values > P99 were identified from July 1, 1980, to September 30, 2019, for all selected climatological stations in Jalisco.
3. Results
3.1 Drought events with large coverage
Drought events considered to have large area coverage were identified in at least half of the weather stations in Jalisco. Table II lists such droughts identified for SPI-3 and SPI-12 with six and four events, respectively. Note that for SPI-3, the drought that affected the state most occurred in 2005-2006, when more than 70% of the stations showed drought, including the coastal region (Fig. 3). This event was followed in importance by the 1989-1990 drought.
Table II Drought events with large surface coverage in the state of Jalisco, Mexico identified by the Standardized Precipitation Index (SPI-3 and SPI-12). x indicates the number of stations displaying drought events, and y the total number of stations. The percentage indicates the number of stations where drought events were identified.
| No. | SPI-3 | ||
| Events | Stations (x/y) | % coverage | |
| 1 | 1982-1983 | 18/28 | 64.3 |
| 2 | 1989-1990 | 19/28 | 67.9 |
| 3 | 1994-1995 | 14/28 | 50.0 |
| 4 | 1997-1998 | 14/28 | 50.0 |
| 5 | 2005-2006 | 20/28 | 71.4 |
| 6 | 2011-2012 | 17/28 | 60.7 |
| SPI-12 | |||
| 1 | 1982-1983 | 16/28 | 57.1 |
| 2 | 1989-1990 | 20/28 | 71.4 |
| 3 | 2005-2006 | 16/28 | 57.1 |
| 4 | 2011-2012 | 18/28 | 64.3 |
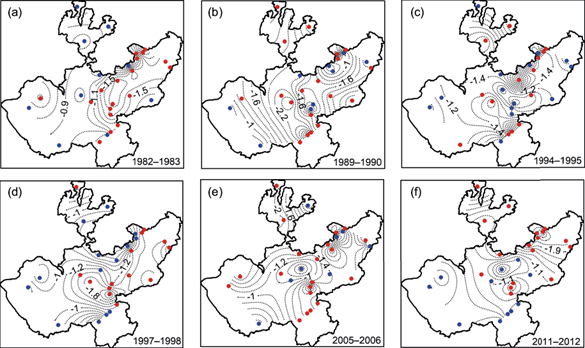
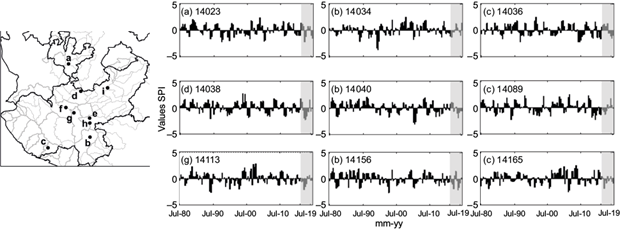
Fig. 3 Standardized Precipitation Index (SPI-3) series. Red (blue) dots are the groups of stations where drought events with large surface coverage were recorded (not recorded) for the periods: (a) 1982-1983, (b) 1989-1990, (c) 1994-1995, (d) 1997-1998, (e) 2005-2006, and (f) 2011-2012. Dashed lines are contours with the highest SPI-3 values at 0.2 intervals.
For SPI-12, the drought event with the highest affected area occurred in 1989-1990, with more than 70% coverage, followed by the event in 2011-2012. Figure 3 shows the recorded drought events with large surface coverage on a seasonal scale for SPI-3. A total of six events were identified for the period 1980-2019 (Table II). The least affected region is located near the coast in the southwestern part of the state. The lowest percentage of stations recording droughts at the SPI-3 scale was registered in the periods 1994-1995 and 1997-1998 (Fig. 3c, d), while the central-northern region had a more uniform distribution of stations with recorded droughts (Fig. 3a, b, e, f). Four drought events were identified for SPI-12, corresponding to impacts on water reserve levels. The largest coverage corresponds to the periods 1989-1990 and 2011-2012, with stations distributed in the central-northern regions of the state (Fig. 4b, d). Stations on a more uniform surface recorded the 1982-1983 and 2005-2006 droughts (Fig. 4a, c). It is important to note that in Figures 3 and 4, the stations that did not maintain negative SPI values for the required period (at least three months for SPI-3 and 12 months for SPI-12) were those considered to have no record of drought.
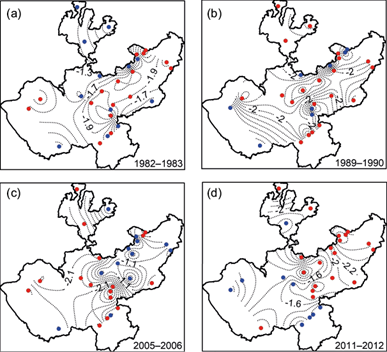
Fig. 4 Standardized Precipitation Index (SPI-12) series; dots are the group of stations recorded (red) and not recorded (blue) drought events with large surface coverage for the periods: (a) 1982-1983, (b) 1989-1990, (c) 2005-2006, (d) 2011- 2012. Dashed lines are contours with the highest SPI-12 value at 0.2 intervals.
3.2 Recent drought events
In addition to the drought events with large area coverage, an additional analysis was performed where droughts that have occurred in the last years (2015-2019) were identified, mainly at a seasonal scale (SPI-3). In total, nine stations were identified that recorded droughts in that period (Fig. 5), most of them in the central region of the state.
3.3 Identification of extreme daily precipitation events
Figure 6 shows the ratio (x/y) between the number of extreme events identified (x) and P99 per stations (y) for the 1980-2019, July-September period in each weather station. The total number of EDP events was 57 for 28 summer series analyzed.
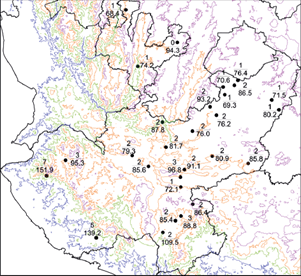
Fig. 6 Ratio (x/y) between the number of extreme events identified (x) over the P99 value (y [mm]) per station. Calculations were performed in July-September 1980 -2019. Terrain elevations are given by blue (400 m), green (1000 m), orange (1600 m), and purple (2200 m) lines.
Stations near the coast (14036 and 14044) recorded the most frequent EDP events (five and seven, respectively), representing nearly 20% of the extreme events identified in the entire state. In contrast, the lowest number of extreme events (14023, 14053, and 14144) was recorded over the northern region, with only two events in the three stations (Fig. 6), representing 3.5% of the extreme events identified in the entire state.
3.3.1 Temporal distribution of extreme daily precipitation events
The results indicate that of the 57 events identified, 28.0% (16 events) were recorded in July, 31.6% (18) in August, and 40.4% (23) in September, which was the most prolific month, with seven of the 23 extreme events occurring at stations near the coast (Fig. 6), in addition to having the highest thresholds mainly due to the passage of tropical cyclones (TCs). The peaks of activity in which EDP events occurred most frequently were 1987, 1999, 2010, and 2013, with 18 events, representing 31.6% of the total. The years 1999 and 2013 were the most active, with five events each, and 1987 and 2010 with four each, concentrating only on 11 of the 28 stations (Table III).
Table III Extreme daily precipitation events identified in the State of Jalisco, Mexico, and their 24-hour accumulated precipitation.
| Year | Date | Station | P99 (mm) | Accumulated precipitation (mm) |
| 1987 | Jul 24-25 Jul 27-28 Sep 30-Oct 01 Sep 30-Oct 01 | 14036 14089 14016 14023 | 139.2 79.3 91.1 74.2 | 156.5 114.4 94.9 75.8 |
| 1999 | Jul 05-06 Jul 20-21 Sep 05-06 Sep 05-06 Sep 06-07 | 14044 14101 14118 14036 14044 | 151.9 70.6 109.5 139.2 151.9 | 193.5 71.0 153.6 257.0 170.0 |
| 2010 | Jul 23-24 Jul 01-02 Aug 09-10 Aug 21-21 | 14044 14099 14100 14100 | 151.9 86.4 93.2 93.2 | 158.0 120.0 100.0 110.0 |
| 2013 | Jul 21-22 Sep 07-08 Sep 15-16 Sep 15-16 Sep 15-16 | 14145 14141 14118 14099 14141 | 69.3 85.4 109.5 86.4 85.4 | 70.0 93.5 143.2 98.5 92.7 |
Table III shows that P99 values change from station to station, due to the great spatial variability in the state. In addition, a TC approach can affect more than one station simultaneously, as it occurred on September 15, 2013 (TC Manuel) and September 5-6, 1999 (TC Greg), when three EDP events were identified at three different stations. In addition, the development of mesoscale convective systems (MCSs) provides favorable conditions for heavy precipitation, such as the MCS that occurred over Jalisco on July 23-24, 2010 (Fig. 12), which had an impact at station 14044 (Table III).
3.4 ENSO-conditions
3.4.1 Drought events
A time correlation analysis between SPI and ONI shows that most stations are positively correlated, particularly for correlations with SPI-3 and lag 0 (Fig. 7), while SPI-12 showed negative correlations close to the coast and in the northwestern region. This relationship would indicate that El Niño conditions are subject to wetter conditions, while those of La Niña are subject to drier conditions. The largest correlation coefficient between ONI and SPI-3 is 0.36 and 0.37 for SPI-12, both for station 14144 located in the northern region; station 14044 exhibits the most negative correlation, which is greater in SPI-12. The statistical relationship between ONI and SPI showed a strong association in the northern and northeastern regions (inland) of the state, and lower near the coast.
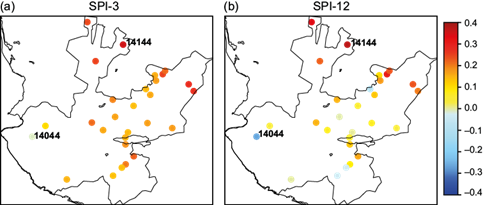
Fig. 7 Correlation between the Oceanic Niño Index (ONI) and the Standardized Precipitation Index (SPI-3 and SPI-12) (lag 0).
Table IV shows the correspondence of the drought events identified on a short time scale (SPI-3) with the different ENSO phases. Stations located in the coastal region (14036 and 14044) only present drought conditions when the ENSO phase is in transition from El Niño to La Niña and La Niña to El Niño. When La Niña conditions occur, the most affected region is the northern part of the state (14023, 14053, and 14144). Finally, for El Niño conditions, the most affected by droughts in the state is the central region in the Chapala Lake basin (14040 and 14156).
Table IV Drought events in the state of Jalisco, Mexico, with large coverage identified in the Standardized Precipitation Index (SPI-3) in the state of Jalisco and their relationship with the different El Niño Southern Oscillation (ENSO) phases.
| Drought | ENSO-conditions | Region |
| 1982-1983 | El Niño | Central |
| 1989-1990 | La Niña | North |
| 1994-1995 | El Niño to La Niña | Coastal |
| 1997-1998 | El Niño | Central |
| 2005-2006 | La Niña to El Niño | Coastal |
| 2011-2012 | La Niña | North |
Figure 8 shows the time series of SPI-3 (Fig. 8a) and SPI-12 (Fig. 8b) of all stations compared to ONI. Periods with drought events with large coverage are characterized by ENSO cold conditions in short and long-term SPI. This relationship is not observed in 1982-1983 and 1997-1998, when 64.3 and 50% of the stations showed drought. However, in this case, a strong positive ENSO event occurred, preceded by a negative ONI, although without exceeding the threshold for a minimum of five consecutive overlapping seasons with negative conditions.
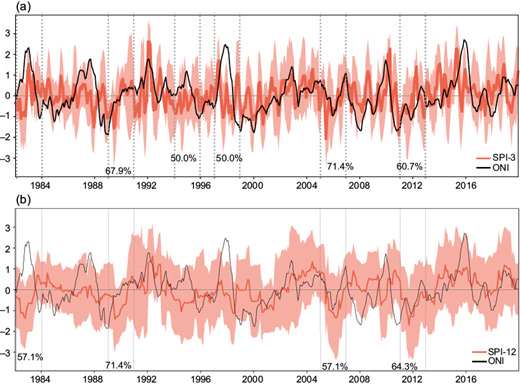
Fig. 8 Standardized precipitation index (SPI) and Oceanic Niño Index (ONI) series: (a) SPI 3 and (b) the SPI 12. The red line indicates the SPI mean across stations and shaded areas indicate ±2.0 times the standard deviation (σ). Percentages correspond to values indicated in Table III.
3.4.2 Extreme precipitation events
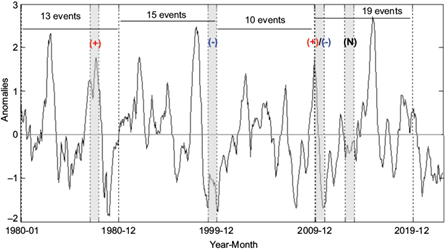
Four years were identified as the times when the most frequent EDP events and different phases of ENSO occurred (Fig. 9). For example, in 1987, El Niño conditions were observed; in 1999, negative SST anomalies led to La Niña conditions; in 2010, a transition from El Niño to La Niña; finally, in 2013 neutral conditions were observed (Fig. 9). Of the 57 EDP events identified for the state of Jalisco, 43.9% (25 events) corresponded to the ENSO neutral phase (Fig. 9), followed by 17.5% (10) El Niño and 17.5% (10) La Niña conditions, 15.9% (9) under El Niño to La Niña transition conditions, and finally 5.3% (3) from La Niña to El Niño (Fig. 9).
4. Discussion
4.1 Drought events
Long-term scale series, such as 12-month series (Fig. 8b), reflect the cumulative precipitation variability, resulting in smoother series. In contrast, short time scales, such as SPI-3 (Fig. 8a), are more sensitive to changes in total precipitation. This property explains why SPI-12 hides some features of a dry episode found when short time scales are analyzed. In this sense, temporal time scales (SPI-3) were identified over the coast; drought events with large coverage only occur under ENSO transition scenarios, as in 1994-1995 and 2005-2006 (Table IV). Some factors that may have contributed to the drought episodes in ENSO transition phases are reported in Vega-Camarena et al. (2023), who found that during the transition years (for example 2006) an anticyclonic circulation center was located south of the Gulf of California, reducing water vapor mixing ratio at 200 mb over the coast of Nayarit and Jalisco. Low water vapor mixing ratio values were also observed at 500 mb. Water vapor reduction in the middle and upper levels implies that moisture is insufficient for precipitation generation, causing negative precipitation anomalies. The result is consistent with that identified in the present study, where greater coverage of droughts was identified in ENSO transition phases on the coast of Jalisco. The rest of the state was less affected by drought events (Table IV), largely attributed to TC passages that contribute significantly to seasonal rainfall accumulation in the region, as reported by Farfán et al. (2013). Under La Niña conditions, large rainfall accumulations have been recorded after a TC passage (Morales et al., 2013), which coincides with the results of the present study, since for the coastal region, droughts were identified under El Niño to La Niña and La Niña to El Niño transition conditions. This situation largely derived from different moisture sources, such as TCs that contribute large amounts of rainfall, especially in Sinaloa, Nayarit, and Jalisco (Farfán et al., 2013; Martínez-Sánchez and Cavazos, 2014). TCs have the greatest influence on Mexican rainfall in September at their maximum northeasterly extent in the eastern Pacific. In addition, easterly waves crossing the Atlantic into the eastern Pacific are associated with strong vertical coupling due to adiabatic heating, influencing rainfall patterns over western Mexico (Giovannettone and Barros, 2008; Ladwig and Stensrud, 2009).
Under La Niña conditions, drought events with large coverage have occurred mainly in the northern part of the state, such as the one that occurred in 2011-2012, classified as an exceptionally well-documented drought (Sánchez-Rodríguez and Cavazos, 2015; Vega-Camarena et al., 2018; Cabral-Alemán et al., 2022). According to the results in the present study, approximately 60% of Jalisco was affected by this drought. The atmospheric flow is depicted in Figure 10, where it shows geopotential height for the 2011-2012 drought case and the mid-level climatological anticyclone (Castro et al., 2001; Turrent and Cavazos, 2012), which is displaced southward at 200 mb in northwestern Jalisco. The position and strength of the mid-level anticyclone are related to wet and dry summers in northern regions (Castro et al., 2001; Turrent and Cavazos, 2012). In the 2011-2012 drought, the mid-level anticyclone was stronger and stretched to the north (strong positive anomalies) and south, strengthening subsidence in the study region.
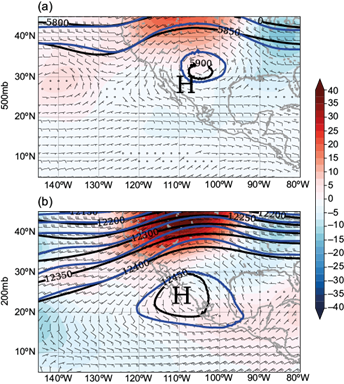
Fig. 10 Geopotential height anomalies (m) for 2011-2012 and wind fields for (a) 500 mb and (b) 200 mb. Black lines represent climatological values (1981-2022), and blue lines show values of the 2011-2012 case study. Regions with well-defined high pressure are marked with the letter H.
According to Alcalá et al. (2005), El Niño conditions tend to make the midsummer drought in Jalisco longer and more intense. This is consistent with the results of the present study, which found that during the midsummer periods, the central region of the state was the most affected. Likewise, between 2015 and 2019, drought events were concentrated in the central part of Jalisco, with only one station (14036) in the coastal region reporting such conditions.
Likewise, the Pacific coast of Mexico, with its latitudinal expanse, characterized by arid and semiarid ecosystems along a narrow corridor, receives moisture from the Pacific Ocean and the Gulf of California. However, much of the Atlantic moisture is blocked due to the Sierra Madre Occidental rain shadow effect, creating a gradient of dryland ecosystems, including Mediterranean scrubs, deserts, subtropical thorn scrubs, and tropical dry deciduous forests. These ecosystems are highly sensitive to water availability, with significant water-limited parts of the year. Positive rainfall anomalies, often driven by climatic oscillations, are essential for ecosystem renewal, allowing plant recruitment and the regeneration of biological communities. For instance, studies have highlighted the role of moisture pulses in enabling vegetation recovery and nutrient cycling, particularly in arid coastal regions (Caso et al., 2007). Inland areas, however, rely more on consistent seasonal precipitation, vital for agricultural productivity and groundwater recharge.
The results in the present study demonstrate that the relationship between ENSO and drought conditions is more pronounced inland (central, northern, and northeastern regions), where ONI correlations with SPI-3 and SPI-12 are the strongest, suggesting that inland regions are more sensitive to ENSO-driven climatic variability with El Niño, generally associated with wetter conditions, and La Niña, with drier conditions. By identifying stronger ENSO correlations in inland regions, the present study provides new insights into how climatic oscillations influence drought impacts, offering a clearer understanding of regional vulnerabilities across Jalisco.
4.2 Extreme precipitation events
According to the results in the present study, EDP events occured under different ENSO conditions during the 1980-2019 period; however, more than 30% of the extreme events occurred in four different years (1987, 1999, 2010, and 2013), corresponding to different ENSO phases (Fig. 9). This result indicates that no particular ENSO phase favored the development of EDP events in Jalisco, a climatic pattern widely related to precipitation in Mexico (Magaña et al., 2003a; Pavia et al., 2006; Bravo et al., 2018). Thus, our results are consistent with those reported by León-Cruz et al. (2022) for the state of Colima in the western region of Mexico, where EDP events do not show a clear pattern with ENSO.
The precipitation regime of Jalisco is largely affected by the influence of the trade winds and TCs (García-Oliva et al., 1991). According to Morales-Hernández et al. (2013), large rainfall accumulations have been recorded under La Niña conditions after the passage of TCs. An example was observed in 1998, when more than 200 mm of rainfall were recorded after the passage of tropical storm Javier along Jalisco’s coast. The results in the present study are consistent with those reported in the literature, since EDP events identified at different stations (14036, 14044, and 14118) on the same or nearby days were generated by TC passage. To illustrate the amount of precipitation produced by these systems, Figure 11 shows TC Greg in September 5-6, 1999 along with its track. Note that the strongest convection occurs in the coastal region, off the coast of Jalisco.
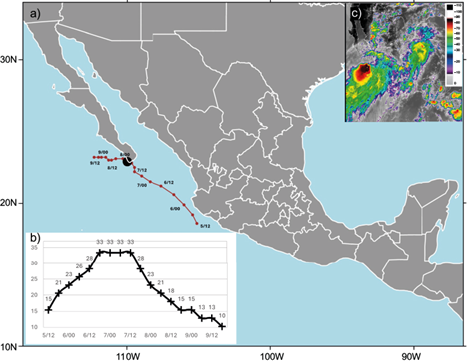
Fig. 11 (a) Track positions of tropical cyclone Greg from September 5 to 9, 1999. Numbers indicate day/UTC each six hours. The black dot indicates landfall position. (b) Time series of sustained wind speed (m s-1) associated with the development of tropical storm Greg. (c) GOES-8 infrared image from 23:15 UTC on September 5, 1999. The vertical bar indicates the associated calibrated scale of cloud-top temperatures (ºC).
In addition to tropical cyclones in Mexico, another source of well-organized conditions favorable for generating extreme precipitation events are MCSs. As an example, Figure 12 shows the MCS displayed for the event identified on July 23-24, 2010, over the states of Jalisco and Nayarit with associated extreme precipitation of more than 150 mm recorded at station 14044. For the period 1980-1987, Howard and Maddox (1988) examined the typical life cycle, track, and duration of MCSs, finding a distinct group of nocturnal systems that initiated over western Jalisco, Nayarit, and southern Sinaloa in July and August. These features are consistent with our findings, in which extreme precipitation events are related to MCSs in July.
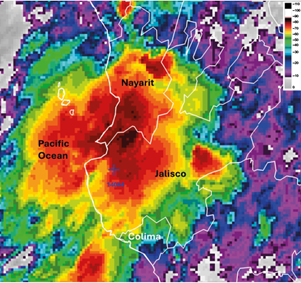
Fig. 12 GOES-13 infrared image at 07:15 UTC (01:15 LT) on July 24, 2010. The blue cross represents the location of station 14044, as shown in Table III. The vertical bar indicates the associated calibrated scale of cloud-top temperatures (ºC). Cloud tops cooler than -60 ºC (above 14 km) are associated with a mesoscale convective system over western Jalisco, southern Nayarit, and a portion of the Pacific Ocean.
Farfán et al. (2021) examined weather events associated with intense MCSs that developed along coastal Colima, Jalisco, and Nayarit in July from 2009 through 2018, identifying the occurrence of deep inland convection and over the Gulf of California’s entrance when large convective values of available potential energy, precipitable water, and lifted indexes were available. Finally, Vega-Camarena et al. (2023) found that on the coast of Nayarit and Jalisco during the 2010 season, a higher frequency of cloud cover was observed compared to 2006, consistent with above-average precipitation anomalies. These results are consistent with those reported in the present study, in which 2010 (along with 1987, 1999, and 2013) experienced more than 30% of extreme precipitation events.
5. Conclusions
In recent years, Mexico has been impacted by extreme weather events, particularly those related to droughts and precipitation. Our results show that, for the state of Jalisco, the coastal region has been the least affected by seasonal drought events (SPI-3), since they were only identified when the ENSO phase was in transition from El Niño to La Niña (1994-1995) and from La Niña to El Niño (2005-2006). At longer time scales (SPI-12), droughts with large coverage occurred in 1989-1990 and 2011-2012, affecting 71.4 and 64.3% of the state, respectively, in both cases under La Niña conditions. On the other hand, EDP events have been more frequent in the decade of 2010, with 19 events (Fig. 9), of which September was the most prolific month with 40.4% (23 of 57 events). However, no clear relationship has been found with the ENSO variability mode.
In addition, the extreme events were mainly concentrated in 11 of the 28 stations analyzed (39.3%), being the coastal region where they occurred most frequently (Table III), while the least affected stations were located in the north of Jalisco (Fig. 6). Further exploration of the influence of other climatic oscillations, such as the Pacific Decadal Oscillation (PDO) and the Atlantic Multidecadal Oscillation (AMO) is essential. These oscillations are known to modulate ENSO impacts on precipitation and drought patterns, particularly by amplifying or dampening weather extreme intensity. Understanding these interactions could provide valuable insights into the drivers of regional weather extremes and inform strategies for water resource management and disaster preparedness in Jalisco.
The findings of the present study on drought characteristics and extreme precipitation events provide critical insights for regional water resource management. For instance, identifying drought frequencies and intensities through SPI-3 and SPI-12 can guide decision-makers in allocating water resources more efficiently during dry periods. Additionally, the analysis of extreme precipitation events highlights areas prone to flooding, offering valuable information for prioritizing infrastructure improvements and flood mitigation strategies.
The identification of extreme precipitation thresholds and the seasonal timing of these events can support the development of early warning systems and emergency response plans, aiding local authorities in effectively preparing for and responding to flood events, reducing potential damage and loss of life. Finally, these results can be incorporated into regional climate adaptation plans, such as updating water management policies or improving urban drainage systems and further strengthening disaster preparedness efforts.

