


 nueva página del texto (beta)
 Inglés (pdf)
 Artículo en XML
 Referencias del artículo
 Enviar artículo por email
 Citado por SciELO
  Similares en
SciELO
Similares en
SciELO 
 Permalink
1. Introduction
Rainfall seasonality is a key feature of climate in many terrestrial ecosystems since it determines nearly all the environmental functions and responses through water availability. Therefore, rainfall seasonality becomes crucial in arid environments. It is relevant not only for ecosystemic responses but also for human primary economic activities, such as agriculture and cattle production.
Along the Pacific Mexican coast, the rainfall pattern is clearly seasonal. The main fraction of annual rainfall (APP) occurs mainly from June through early October as summer rainfall (SPP). Early SPP events are frequently the result of convective storms. In late summer, tropical storms, although being sporadic, significantly contribute to rainfall amounts via extreme precipitation events (Cavazos et al., 2008; Gutzler et al., 2013). Towards the northwest, the SPP fraction decreases whilst the winter rainfall (WPP) fraction increases until it becomes the larger fraction of APP in the extreme northwest Pacific coast of Mexico. WPP is associated with winter storms moving southwards and its interaction with humid tropical air coming from the Pacific Ocean heading northeast, colliding in the upper regions of the Sierra Madre Occidental (SMO).
The main factor driving the rainfall seasonality of northwest Mexico is the North American or Mexican Monsoon (NAM), which occurs from late June through September (Douglas et al., 1993; Gochis et al., 2006). This yearly process accumulates above 50 percent of the APP in Sinaloa. The NAM is shaped by complex interactions of several meteorological factors, which are thoroughly discussed by Hu and Feng (2002) and Vera et al. (2006), among others. An important spatial component of the SPP is the orographic effect created by the Sierra Madre (SM), which runs almost parallel to the coast but increases the distance from the shoreline moving north. The effect of topography in the development of convective rainfall is explained by Houze (2012) and, specifically for this region, by Rowe et al. (2008) and Nesbitt et al. (2008).
An intercontinental-scale phenomenon that modifies the seasonal rainfall patterns in northwest Mexico is El Niño Southern Oscillation (ENSO) and its two phases: El Niño (warmer sea surface) and La Niña (colder sea surface). The teleconnections (i.e., effects) of ENSO on seasonal rainfall patterns are multifactorial and complex and often occur at a multicontinental scale, as described by Zhao et al. (2016), who, through data analysis and simulations, detected that heating in Eurasian non-monsoonal regions induced rainfall anomalies (reduction) in North America. Taschetto et al. (2020) described that during El Niño episodes, rainfall increased in southwest North America; also, in general terms, La Niña produced opposite conditions, but these were dependent on the location of the ENSO anomaly plus the interaction of ENSO variation in different oceanic basins and non-equatorial regions. Rodríguez-Morales et al. (2023) detected divergent effects of the Atlantic Multidecadal Oscillation (AMO) and ENSO variation. The nature of these effects was also differentiated by regions on the Mexican coast. Llanes-Cárdenas et al. (2020) depicted a positive correlation between the Pacific Decadal Oscillation (PDO) and El Niño for northwest Mexico, affecting extreme precipitation.
The effect of ENSO on seasonal rainfall amounts on the Pacific Mexican coast is dependent on the occurring phase (El Niño or La Niña), the season (winter or summer), and the region (north [above 22º N] or south). According to Magaña et al. (2003), Caso et al. (2007), and Bravo-Cabrera et al. (2010), rainfall amounts tend to decrease in winter in El Niño conditions in the southern portion of the Mexican Pacific coast; inversely, rainfall amounts increase in summer in the northern region. El Niño conditions reduce rainfall amounts in the South Pacific, whilst rainfall amounts remain with unnoticeable change in the North Pacific. As for La Niña, in winter in the northern region, rainfall records were found to be lower; inversely, in the southern region, records were higher. In a yearly basis, La Niña tends to slightly increase rainfall amounts along the Pacific coast, although its signal is rather weak (Zermeño-Díaz and Gómez-Mendoza, 2023).
Most of the evidence detected for rainfall modification at small (local) scales is linked to anthropogenic processes such as deforestation. An essential issue regarding the connection between the loss of vegetal cover and the decrease in rainfall is spatial scale. Notaro and Gutzler (2012) found through simulations that the loss of vegetation cover could modify physical evapotranspiration processes, reducing water recycling and changing atmospheric dynamics, and finally reducing water rainfall. Leite-Filho et al. (2021) detected from field data a strong correlation between forest loss and reduction of rainfall at larger scales of analysis, hence producing agricultural losses.
Seasonal rainfall patterns are key for ecosystem processes in arid environments such as those in northwest Mexico (Caso et al., 2007; Verduzco et al., 2015). Given the seasonal water availability, ENSO anomalies might alter ecological processes such as plant recruitment (Félix-Burruel et al., 2021), primary productivity (Salinas-Zavala et al., 2002), tree growth (Pompa-García et al., 2014), and animal ecology (Mandujano, 2006).
Sinaloa and southern Sonora are the main agricultural regions in Mexico, whose crop production is dependent on the water availability of rivers that flow westward. Therefore, ENSO anomalies might constitute a factor that modifies crop yield and volume (Muñoz-Arriola et al., 2009; Cruz-González et al., 2024).
1.1 Sinaloa and its regions
Sinaloa is located in northwest Mexico. Together with the southwestern tip of the state of Chihuahua, the southern edge of Sonora and the eastern slopes of Durango, it is part of the Pacific northwest watershed, as delineated by the Comisión Nacional del Agua (National Water Commission, CNA). Essentially based on elevation, three main physiographic regions make up the state of Sinaloa within the watershed: the Coastal Plains (CP), situated along the Pacific coastline, with increasing width towards the northwest of the state; the low elevations of the Sierra foothills (SF), initially scattered, moving east with increasing altitude; and, finally, the SMO, the easternmost region, which runs almost parallel to the Pacific coasts and where all the state’s rivers originate (Fig. 1).
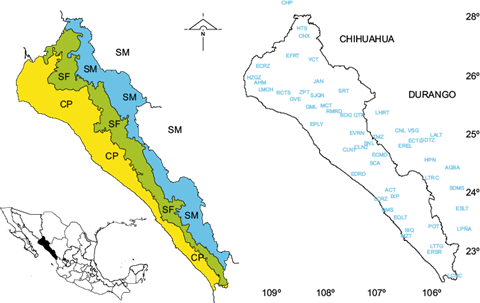
Fig. 1 Left panel: Sinaloa in northwest Mexico and its physiographic regions. Right panel: location of the climate stations. CP: coastal plains (yellow); SF: Sierra foothills (green); SM: Sierra Madre (blue).
Given the relevance of the rainfall seasonality patterns for this region and the potential effect of ENSO-driven anomalies, the objectives of this analysis were to: (1) characterize the covariance of the seasonal winter-summer rainfall related variables and geographic factors; (2) quantify the covariance between El Niño/La Niña values in each station, with their respective amounts of winter-summer rainfall; (3) estimate regional differences of the quantified covariance magnitude values of El Niño/La Niña-seasonal rainfall amounts; (4) determine the correlation of the quantified covariance of El Niño/La Niña-seasonal rainfall with geographic elements, and (5) describe the variation of seasonal rainfall-related variables from a multivariate perspective.
Caso et al. (2007) stated that along the Mexican Pacific northwest coast, there is a decrease in mean annual rainfall and summer means decrease, while winter rainfall increases towards the north. Annual and summer rainfall are expected to increase altitudinally by the orographic effect in convective rainfall, as described by Nesbitt et al. (2008) and Rowe et al. (2008). These trends have yet to be quantified for the state of Sinaloa. In addition, we also estimated another related seasonal rainfall variable. Likewise, we incorporated longitude to widen the perspective of spatial analysis.
2. Materials and methods
2.1 Climate data
From the records of the Servicio Meteorológico Nacional (National Weather Service, SMN)-CNA website, based on its entirety, we chose and downloaded daily data from 53 stations (Table I). Data from the selected stations was updated through 2022 by the CNA regional office. From every selected station, we calculated monthly totals for each recorded year. We also considered stations in the states of Chihuahua and Durango that belong to the same regional North Pacific watershed since the rivers that flow into Sinaloa originate from these sites.
Table I Selected stations from three regions in northwestern Mexico (n = 53).
| Name and 1st year of data | Abbreviation | Region | Latitude | Longitude | Altitude (masl) | APP | WPP | %WPP | PPE | PCI |
| Acatitán (1962) | ACT | SF | 24º 05’ | -106º 40’ | 96 | 787.1 | 64.3 | 8.10 | 64 | 24.4 |
| Agua Blanca (1981) | AGBA | SM | 24º 26’ | -105º 47’ | 2500 | 1202.5 | 56.8 | 9.23 | 101 | 18.4 |
| Ahome (1962) | AHM | CP | 25º 55’ | -111º 52’ | 10 | 363.4 | 53.5 | 15.0 | 30 | 29.6 |
| Badiraguato (1961) | BDG | SF | 25º 20’ | -107º 32’ | 190 | 951.4 | 71.3 | 7.17 | 60 | 25.3 |
| Canelas (1961) | CNL | SF | 25º 07’ | -106º 32’ | 1754 | 1300.9 | 178.4 | 12.8 | 101 | 19.8 |
| Chinipas (1961) | CHP | SF | 27º 23’ | -108º 32’ | 440 | 747.9 | 108.1 | 13.7 | 66 | 21.9 |
| Choix (1961) | CHX | SF | 26º 42’ | -108º 19’ | 240 | 770.5 | 101.9 | 12.6 | 61 | 22.1 |
| Culiacán_CNA (1961) | CLN1 | CP | 24º 48’ | -107º 24’ | 40 | 678.5 | 59.6 | 8.55 | 55 | 27.8 |
| Culiacán_UAS (1995) | CLN2 | CP | 24º 49’ | -107º 22’ | 62 | 701.5 | 33.9 | 5.16 | 61 | 28.8 |
| Dimas (1962) | DMS | CP | 23º 43’ | -106º 46’ | 20 | 574.2 | 53.1 | 11.1 | 31 | 30.0 |
| El Cantil (1961) | ECTL | SM | 24º 56’ | -106º 15’ | 2240 | 1468.5 | 216.4 | 14.0 | 95 | 19.6 |
| El Carrizo (1969) | ECRZ | CP | 26º 16’ | -109º 02’ | 9 | 361.5 | 51.8 | 13.9 | 34 | 27.1 |
| El Comedero (1981) | ECMD | SF | 24º 37’ | -106º 48’ | 311 | 973.6 | 66.9 | 6.83 | 56 | 25.1 |
| El Dorado (1970) | EDRD | CP | 24º 19’ | -107º 22’ | 12 | 445.4 | 27.6 | 6.72 | 39 | 29.4 |
| El Fuerte (1961 | EFRT | SF | 26º 24’ | -108º 37’ | 86 | 597.6 | 70.7 | 10.9 | 50 | 27.8 |
| El Playón (1962) | EPLY | CP | 25º 13’ | -108º .11 | 6 | 477.4 | 46.7 | 9.89 | 51 | 25.5 |
| El Quelite (1961) | EQLT | CP | 23º 33’ | -106º 27’ | 49 | 613.6 | 53.1 | 8.53 | 51 | 25.5 |
| El Real (1978) | EREL | SF | 24º 42’ | -106º 32’ | 457 | 757.2 | 125.9 | 14.9 | 71 | 21.1 |
| El Rosario (1963) | ERSR | CP | 22º 59’ | -105º 51’ | 32 | 917.6 | 54.7 | 5.79 | 59 | 25.8 |
| El Salto (1961) | ESLT | SM | 23º 41’ | -105º 21’ | 2538 | 979.4 | 148.4 | 14.2 | 90 | 18.1 |
| El Varejonal (1961) | EVRN | SF | 25º 05’ | -107º 23’ | 120 | 897.3 | 79.3 | 8.63 | 55 | 25.4 |
| Guamúchil (1961) | GML | CP | 25º 28’ | -108º 11’ | 44 | 554.9 | 46.1 | 8.86 | 53 | 26.4 |
| Guasave (1969) | GVE | CP | 25º 33’ | -108º 27’ | 17 | 479.7 | 45.0 | 9.55 | 38 | 28.2 |
| Guaténipa (1964) | GTP | SF | 25º 20’ | -107º 13 | 293 | 798.7 | 164.1 | 18.9 | 73 | 18.0 |
| Higuera de Zaragoza (1962) | HZGZ | CP | 25º 58’ | -109º 18’ | 10 | 318.9 | 49.7 | 14.9 | 25 | 30.8 |
| Huahuapan (1967) | HPN | SM | 24º 31’ | -105º 57’ | 1170 | 808.4 | 101.2 | 12.1 | 84 | 19.5 |
| Huites (1961) | HTS | SF | 26º 53’ | -108º 21’ | 260 | 707.2 | 104.0 | 12.4 | 53 | 22.6 |
| Ixpalino (1961) | IXP | SF | 23º 58’ | -106º 36’ | 69 | 755.9 | 62.0 | 7.92 | 61 | 24.7 |
| Jaina (1961) | JAN | SF | 25º 53’ | -108º 13 | 261 | 868.6 | 79.4 | 9.11 | 65 | 24.2 |
| La Concha (1961) | LCNC | CP | 22º 31’ | -105º 27’ | 16 | 1060.5 | 58.1 | 5.47 | 66 | 25.4 |
| La Cruz (1969) | LCRZ | CP | 23º 54’ | -106º 54’ | 9 | 576.8 | 44.6 | 9.20 | 37 | 27.3 |
| La Huerta (1969) | LHRT | SF | 25º 21’ | -106º 42’ | 670 | 787.9 | 169.9 | 19.4 | 73 | 17.8 |
| La Peña (1963) | LPÑA | SM | 23º 33’ | -105º 24’ | 2756 | 1295.3 | 248.9 | 17.9 | 94 | 17.4 |
| Las Tortugas (1974) | LTTG | SF | 23º 05’ | -105º 50’ | 65 | 895.7 | 46.8 | 5.08 | 61 | 25.5 |
| Las Truchas (1962) | LTRC | SM | 24º 10’ | -105º 57’ | 1288 | 1260.5 | 186.0 | 14.2 | 110 | 18.7 |
| Los Altares (1973) | LALT | SM | 24º 59’ | -105º 53’ | 2616 | 839.3 | 129.3 | 14.9 | 91 | 17.5 |
| Los Mochis (1970) | LMCH | CP | 25º 48’ | -109º 02’ | 11 | 346.1 | 43.0 | 12.2 | 32.5 | 29.8 |
| Mazatlán (1961) | MZT | CP | 23º 12’ | -106º 24’ | 4 | 796.2 | 30.9 | 4.14 | 49 | 27.7 |
| Mocorito (1969) | MCT | SF | 25º 28’ | -107º 55’ | 87 | 706.3 | 63.5 | 8.94 | 54 | 26.7 |
| Potrerillos (1969) | POT | SM | 23º 27’ | -105º 49’ | 1572 | 1296.0 | 113.9 | 8.60 | 90 | 22.2 |
| Rosa Morada (1962) | RMRD | SF | 25º 21’ | -107º 50’ | 134 | 782.1 | 57.4 | 7.14 | 47.1 | 27.0 |
| Ruiz Cortines (1963) | RCTS | CP | 25º 42’ | -108º 43’ | 20 | 416.2 | 42.2 | 9.91 | 32.3 | 28.7 |
| San Diego (1973) | SDTZ | SM | 24º 53’ | -106º 07’ | 1640 | 807.0 | 101.2 | 11.9 | 85 | 19.9 |
| San Joaquín (1979) | SJQN | SF | 25º 40’ | -108º 01’ | 144 | 758.9 | 58.5 | 7.11 | 49 | 27.4 |
| Sanalona (1961) | SNL | SF | 24º 48’ | 107º 09’ | 104 | 861.5 | 63.3 | 7.45 | 63 | 25.6 |
| Santa Cruz (1961) | SCA | SF | 24º 29’ | -106º 57’ | 109 | 771.8 | 74.6 | 9.39 | 64 | 25.0 |
| San Dimas (1962) | SDMS | SM | 24º 08’ | -105º 35’ | 952 | 901.6 | 114.9 | 12.4 | 80 | 20.4 |
| Siqueros (1961) | SIQ | CP | 23º 20’ | -106º 14’ | 40 | 743.5 | 52.2 | 6.77 | 56 | 25.8 |
| Surutato (1961) | SRT | SM | 25º 48’ | -107º 33’ | 1460 | 1190.1 | 195.4 | 15.2 | 90 | 19.1 |
| Tamazula (1961) | TMZ | SF | 24º 58’ | -106º 58’ | 264 | 1001.2 | 94.0 | 8.82 | 75 | 23.9 |
| Vasco Gil (1967) | VSG | SM | 25º 07’ | -106º 21’ | 2400 | 1314.4 | 274.8 | 19.4 | 132 | 16.5 |
| Yecorato (1967) | YCT | SF | 26º 25’ | -108º 13’ | 400 | 802.0 | 104.9 | 12.5 | 59 | 22.4 |
| Zopilote (1979) | ZPT | CP | 25º 43’ | -108º 20’ | 37 | 565.3 | 37.8 | 6.36 | 36 | 29.4 |
APP: annual rainfall (mm); WPP: winter rainfall (mm); %WPP: percentage of winter rainfall; PPE: rainfall events; PCI: precipitation concentration index.
We settled the SPP season from May 15 to November, following the guidelines of the CNA that determine the major probabilities of hurricane occurrence on the Mexican Pacific coast for the period. Hence, the WPP season was delimited from December to May 14. We quantified the seasonal rainfall amounts as follows: WPP as the sum of monthly rainfall from December to May 14 and SPP as the sum from May 15 to November. As an example, for any considered station here, the WPP of 1973 was the sum of December 1972 plus the totals of January, February, March, April, and the first 14 days of May of 1973; the 1973 SPP was considered as the total sum from the last 16 days of May to November, therefore, the APP amount of 1973 goes from December 1972 to November 1973.
For the analysis, in addition to APP, SPP, and WPP, we included the percentage of WPP calculated as
%WPP = (WPP/APP) × 100 (1)
We also included the mean number of rainfall events per year (PPE), estimated from daily rainfall data provided by the CNA. Finally, we incorporated the precipitation concentration index (PCI) proposed by Oliver (1980) for an annual scale proposed, estimated as:
where the numerator is the sum of squared monthly rainfall amounts, and the denominator is the squared total annual rainfall amount. This measure of annual rainfall variation indicates that larger values describe a higher level of rainfall seasonality, e.g., a larger amount of annual rainfall in fewer months.
Monthly Oceanic Niño Index values were obtained from the NWS Climate Prediction Center webpage (ONI, n.d.). These values are estimated as a three-month rolling average temperature difference of sea surface temperature in the tropical eastern Pacific. Values of 0.5 or above point to El Niño conditions; values of -0.5 or below indicate La Niña conditions.
2.2 Data analysis
We explored the covariance of the stations’ APP, SPP, WPP, and %WPP means with latitude, longitude, and altitude by linear regression analysis. We chose these geographic elements due to their accessibility and ease of interpretation.
To elucidate the effect of ENSO variation on seasonal rainfall amounts, we separated monthly ONI data values for El Niño (warm) and La Niña (cold) conditions. Then we performed four non-parametric Spearman correlation (ρ) analyses (P < 0.05) on each selected station: (1) between the ONI monthly data set of El Niño and its corresponding WPP amount; (2) between El Niño and its respective SPP amount; (3) we repeated the process between La Niña and WPP, and (4) La Niña and SPP amounts. We selected Spearman’s ρ correlation since monthly seasonal rainfall data in most of the stations were not normally distributed and/or lacked homogeneity of variance. To assess differences among regions of the quantified magnitude of Spearman’s (ρ) coefficients, we performed a one-way ANOVA (P < 0.05).
To explore the covariance of the quantified Spearman’s ρ products of El Niño/La Niña and seasonal rainfall in terms of geographic variation, a linear regression of their magnitudes was performed with values of latitude, longitude, and altitude. Also, a spatial autocorrelation analysis was carried out using Moran’s I index for the Spearman’s ρ products quantified from the correlations between El Niño/La Niña ONI and WPP-SPP.
Finally, a principal component analysis was performed to achieve a simultaneous perspective of the total variation of the seasonal rainfall variables assessed plus the effect of ENSO on the seasonal rainfall. We used an Oblimin oblique rotation since the considered variables were highly correlated.
3. Results
3.1 Annual and seasonal rainfall
An initial descriptive analysis of the rainfall-related variables showed that the SM, APP, and SPP means almost double the CP mean. The WPP mean is almost four times larger in the SM as compared to CP (Table II). %WPP is also the largest in the SM, while there were no significant differences between the CP and the SF regions. The number of PPE in the CP is half of the mean value detected in the SM region. The highest seasonality for the rainfall regime was detected for CP.
Table II Means ± S.E. of annual rainfall, percentage of winter rainfall, annual rainfall events, and precipitation concentration index of 53 stations from three regions in northwestern Mexico.
| Coastal plains | Sierra foothills | Sierra Madre | |
| Annual rainfall (mm) | 578.5 ± 46.1c | 817.4 ± 20.0b | 1152.0 ± 67.0a |
| Summer rainfall (mm) | 532.0 ± 45.8c | 728.9 ± 21.6b | 989.4 ± 58.0a |
| Winter rainfall (mm) | 46.5 ± 2.1c | 88.46 ± 7.1b | 162.6 ± 18.9a |
| % winter rainfall | 9.05 ± 0.74b | 10.42 ± 0.81b | 13.71 ± 0.90a |
| Rainfall events | 42.8 ± 2.91c | 61.9 ± 1.86b | 97.1 ± 3.84a |
| Precipitation concentration index | 27.9 ± 0.37a | 23.7 ± 0.56b | 18.9 ± 0.43c |
Superscript letters denote Tukey post hoc differences: a > b > c.
The regression analysis with the geographic features of the sampled stations showed that APP and SPP had negative correlations with latitude and positive correlations with longitude and altitude. So, their means were smaller towards the north, the west, and higher sites. WPP and %WPP showed higher means in northern and higher sites; in contrast, WPP means were lower in western stations, while %WPP values were higher. PPE correlated negatively with latitude and positively with longitude and altitude, exactly the opposite pattern than PCI (Table III).
Table III Regression coefficients (R2), slope, and statistical significance (P < 0.05) of rainfall-related variables in 53 meteorological stations of the North Pacific watershed in northwestern Mexico.
| Variable | Latitude (N) | Longitude (W) | Altitude (m) | ||||||
| R2 | Slope | P | R2 | Slope | P | R2 | Slope | P | |
| APP | 0.100 | -81.09 | 0.021 | 0.466 | 170.6 | 0.000 | 0.513 | 0.231 | 0.000 |
| SPP | 0.143 | -83.48 | 0.005 | 0.487 | 150.3 | 0.000 | 0.415 | 0.180 | 0.000 |
| WPP | 0.002 | 2.392 | 0.750 | 0.151 | 20.33 | 0.004 | 0.593 | 0.052 | 0.000 |
| %WPP | 0.134 | 1.308 | 0.007 | 0.001 | -0.115 | 0.815 | 0.282 | 0.002 | 0.000 |
| PPE | 0.046 | -4.647 | 0.124 | 0.459 | 14.32 | 0.000 | 0.715 | 0.023 | 0.000 |
| PCI | 0.003 | 0.193 | 0.713 | 0.336 | -2.104 | 0.000 | 0.663 | -0.004 | 0.000 |
APP: annual rainfall; SPP: summer rainfall; WPP: winter rainfall; %WPP: percentage of winter rainfall; PPE: annual rainfall events; PCI: precipitation concentration index.
3.2 El Niño and La Niña effects on seasonal rainfall
The effect of El Niño conditions on the WPP amounts indicated that positive correlations occurred in all the stations, hence increasing rainfall. Only in Rosa Morada, Huahuapan, and Culiacán-UAS were the results statistically non-significant (Fig. 2a). The magnitude of Spearman’s ρ ranged from 0.463 in Acatitán to 0.150 in Mocorito. Contrastingly, in El Niño conditions with SPP (Fig. 2b), 45 stations produced negative correlations, pointing to a reduction in rainfall. Eight stations had positive correlations (yellow squares in Fig. 2) that were non-significant, most of them in the CP region. Larger intensities were detected in the SF and SM regions.
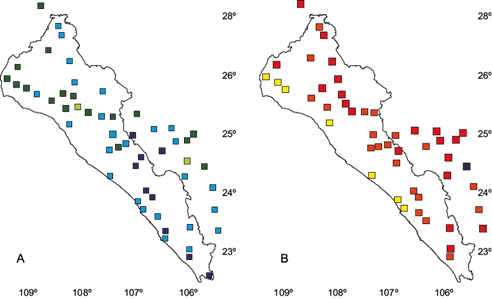
Fig. 2 Spearman’s ρ correlations analysis between El Niño ONI values and (a) winter rainfall amounts and (b) summer rainfall amounts in 53 stations of the North Pacific watershed of northwestern Mexico. Magnitudes of Spearman’s ρ correlations: blue (■): 0.499 to 0.400; cyan (■): 0.399 to 0.300; green (■): 0.299 to 0.200; olive green (■): 0.199 to 0.100; yellow (■): 0.099 to 0.0; orange (■): -0.001 to -0.100; red (■): -0.101 to -0.200; purple (■): -0.201 to -0.360.
Spearman's ρ correlation magnitudes between La Niña ONI values and WPP amounts ranged from 0.200 in Acatitán to -0.115 in Rosa Morada; also, Chinipas, El Carrizo, Mocorito, and Yecorato showed negative signs in such correlations (Fig. 3a). The correlations products between La Niña ONI values and SPP amounts were all positive in the studied stations, hence describing increasing rainfall amounts. The SF and SM regions showed larger magnitudes of these correlation products (Fig. 3b).
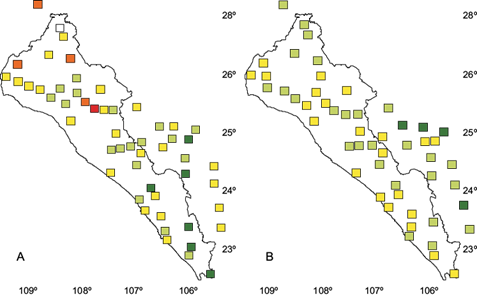
Fig. 3 Spearman’s ρ correlations analysis between La Niña ONI values and (a) winter rainfall amounts and (b) summer rainfall amounts in 53 stations of the North Pacific watershed of northwestern Mexico. Magnitudes of Spearman’s ρ correlations: blue (■): 0.499 to 0.400; cyan (■): 0.399 to 0.300; green (■): 0.299 to 0.200; olive green (■): 0.199 to 0.100; yellow (■): 0.099 to 0.0; orange (■): -0.001 to -0.100; red (■): -0.101 to -0.200; purple (■): -0.201 to -0.360.
3.3 Regional differences of Spearman’s ρ magnitude
We found a normal distribution of Spearman’s ρ magnitude for each analysis, and hence, we performed a one-way ANOVA between regions. Overall, the largest mean value was found in El Niño-WPP, and the minimum mean was detected in La Niña-WPP; however, both winter interactions were not regionally differentiated. On the other hand, summer rainfall was differentiated in the direction of the mean correlations; they were negative in El Niño (reducing rainfall) and positive during La Niña (increasing rainfall). Both summer season rainfall correlations with El Niño/La Niña were different between regions, where the SM magnitudes were always larger (Table IV).
Table IV Mean Spearman’s ρ values (± S.E.) of the covariance between El Niño and La Niña phases and winter and summer rainfall amounts for 53 stations of three physiographic regions in the North Pacific watershed of Mexico.
| ENSO-seasonal rainfall | Coastal plains | Sierra foothills | Sierra Madre | Overall |
| El Niño-winter | 0.320 ± 0.014 | 0.341 ± 0.017 | 0.315 ± 0.018 | 0.328 ± 0.010 |
| El Niño-summer | -0.025 ± 0.015a | -0.091 ± 0.011b | -0.137 ± 0.019b | -0.078 ± 0.010 |
| La Niña-winter | 0.096 ± 0.015 | 0.076 ± 0.018 | 0.135 ± 0.018 | 0.097 ± 0.010 |
| La Niña-summer | 0.077 ± 0.012b | 0.112 ± 0.007ab | 0.141 ± 0.015a | 0.106 ± 0.007 |
Superscript letters denote Tukey post hoc differences: a > b > c.
3.4 Geographic and spatial covariation of ENSO rainfall amounts
Latitude correlates significantly with Spearman’s ρ coefficients of El Niño-WPP (Fig. 4a) and La Niña-SPP (Fig. 4b), with smaller coefficients toward the north in both cases.
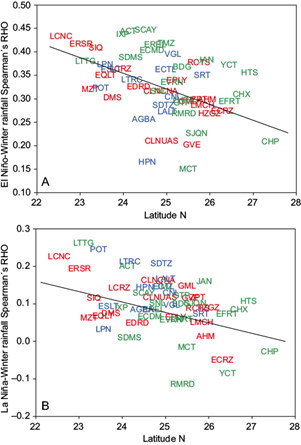
Fig. 4 Regression analysis of 53 stations within three physiographic regions in northwestern Mexico. (a) latitude and El Niño-winter rainfall (R2 = 0.182, P < 0.001, slope = -0.028); (b) latitude and La Niña-winter rainfall (R2 = 0.219, P < 0.000, slope = -0.033). Red captions: coastal plains region; green captions: Sierra foothills region; blue captions: Sierra Madre region.
Longitude generated three significant regressions with Spearman’s ρ values: El Niño-WPP, El Niño-SPP, and La Niña-WPP (Fig. 5).
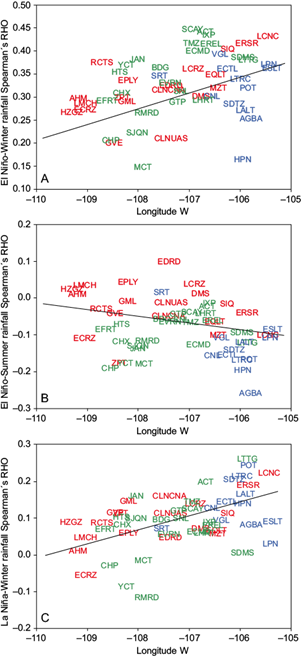
Fig. 5 Regression analysis of 53 stations within three physiographic regions in northwestern Mexico. (a) longitude and El Niño-winter rainfall (R2 = 0.129, P < 0.008, slope = 0.023); (b) longitude and El Niño-summer rainfall (R2 = 0.077, P < 0.044, slope = -0.033); (c) longitude and La Niña-winter rainfall (R2 = 0.222, P < 0.000, slope = 0.032). Red captions: coastal plains region; green captions: Sierra foothills region; blue captions: Sierra Madre region.
Altitude produced two significant regressions with Spearman’s ρ values: El Niño-SPP correlated negatively with altitude (Fig. 6a), and La Niña-SPP coefficients correlated positively with altitude (Fig. 6b).
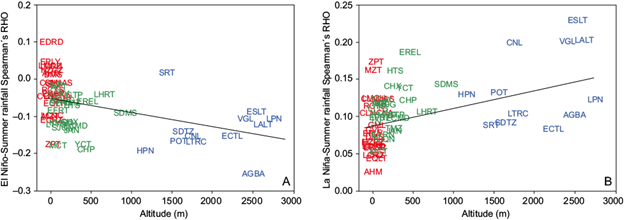
Fig. 6 Regression analysis of 53 stations within three physiographic regions in northwestern Mexico. (a) altitude and El Niño-summer rainfall (R2 = 0.220, P < 0.000, slope = 4.03-5); (b) altitude and La Niña-summer rainfall (R2 = 0.244, P < 0.000, slope = 2.59-5). Red captions: coastal plains region; green captions: Sierra foothills region; blue captions: Sierra Madre region.
Two spatial Moran’s I analyses were significant: El Niño-SPP: I = 0.227, P < 0.001, showing a clustered aggregation, and La Niña-SPP, which also developed a clustered aggregation: I = 0.147, P < 0.028.
3.5 Multivariate analysis
From a multivariate perspective, a principal component analysis (Table V) showed that the three first components explained over 80% of the total variation. PC1, which depicted 51%, was correlated positively with WPP, the number of rainfall events, the percentage of WPP, APP, and the covariance of La Niña-SPP and SPP. The largest negative loadings of PC1 were the PCI and El Niño-SPP. PC2 illustrated 17% of the total variation; here, the main positive loadings were SPP, the covariance of La Niña-WPP, El Niño-WPP, APP, and a number of rainfall events; the largest negative loading was the PCI. The main positive loadings in PC3 were the covariances of El Niño-SPP and El Niño-WPP plus the PCI; the largest negative loadings were SPP, APP, the number of rainfall events, and the La Niña-SPP relationship.
Table V Multivariate analysis (Oblimin rotation) loadings of Spearman’s ρ coefficients from rainfall variables and ENSO phases (El Niño-La Niña), with winter and summer rainfall amounts of 53 stations from northwest Mexico. Loadings above 0.300 in boldface.
| PC1 | PC2 | PC3 | |
| Explained variance (%) | 50.57 | 17.40 | 12.42 |
| Accumulated variance (%) | - | 67.97 | 80.39 |
| Annual rainfall | 0.669 | 0.676 | -0.619 |
| Summer rainfall | 0.543 | 0.725 | -0.661 |
| Winter rainfall | 0.962 | 0.243 | -0.234 |
| % winter rainfall | 0.808 | -0.280 | 0.132 |
| Rainfall events | 0.830 | 0.506 | -0.570 |
| Precipitation Concentration Index | -0.918 | -0.300 | 0.444 |
| El Niño-Winter rainfall | 0.111 | 0.717 | 0.361 |
| El Niño-Summer rainfall | -0.351 | -0.072 | 0.914 |
| La Niña-Winter rainfall | -0.021 | 0.719 | -0.125 |
| La Niña-Summer rainfall | 0.555 | 0.111 | -0.328 |
Bold letters: loadings above 0.300.
A graphic analysis of the z-standardized scores for PC1 and PC2 (Fig. 7) calculated from the multivariate analysis, depicted that on the negative sector of PC1, the variability of all CP stations plus Acatitán, Badiraguato, El Comedero, El Fuerte, El Varejonal, Ixpalino, Jaina, Las Tortugas, Mocorito, Rosa Morada, San Joaquín, Sanalona, Santa Cruz, and Tamazula from the SF region, was determined by high values of PCI and the correlation of El Niño-SPP. In the positive sector of PC2, all the stations of the SM region besides Huites, San Dimas, El Real, Choix, Chinipas, Guaténipa, and La Huerta from the SF region were linked to high means of APP, SPP, WPP, %WPP, number of rainfall events, and the correlation of La Niña-SPP.
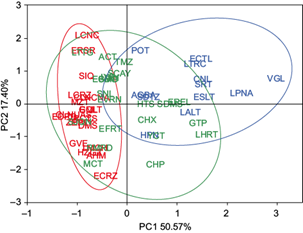
Fig. 7 Scatter plot of z-scores of principal component analysis for rainfall variables and the effect of El Niño and La Niña conditions on seasonal rainfall of 53 stations from three regions of the North Pacific watershed in northwestern Mexico. Red captions: coastal plains region; green captions: Sierra foothills region; blue captions: Sierra Madre region.
4. Discussion
4.1 Rainfall and geography
In the scenario described by Caso et al. (2007), the state of Sinaloa is located at the northern end of a summer-rainfall regime along the transition summer-to-winter rainfall dominance on the Pacific coast of Mexico. Here, regional differences within the Pacific Northwest watershed for all the rainfall-related variables indicated that rainfall seasonal patterns are differentiated. These differences were correlated to geographical variations: the APP mean values decrease heading north and west; APP and SPP clearly decrease into the lower altitudes of the CP, an effect described by Houze et al. (2012), and WPP and %WPP increase toward the north and in upper stations. In addition, in the northwest and lowlands, there is a decreasing gradient of PPE and an increasing trend in the values of %WPP and rainfall seasonality (PCI).
4.2 Effects of El Niño and La Niña on seasonal rainfall and regional differences
Regarding the ENSO covariance with seasonal rainfall in Sinaloa during winter, El Niño increased rainfall amounts in each studied station as described by Magaña et al. (2003), Caso et al. (2007), and Bravo-Cabrera et al. (2010). The magnitude of El Niño’s effect in each region is similar, with over 30% of explained covariance. On the contrary, in summer, with El Niño warm-ocean conditions, rainfall in Sinaloa developed a similar pattern as in the southern regions of the Mexican Pacific coasts, with 85% of the studied stations recording decreasing rainfall amount trends. Among regions, the SF and the SM showed the largest negative mean correlations, pointing that in these conditions, El Niño may decrease water availability during the summer, thus disrupting or delaying ecosystemic processes.
In reference to La Niña, our results also coincide with those of Magaña et al. (2003), Caso et al. (2007) and Bravo-Cabrera et al. (2010) for the WPP and SPP regimes, for which they depicted slightly increasing trends in both seasons. The effect of La Niña and WPP in Sinaloa showed mostly increasing rainfall trends. The magnitude of the overall Spearman’s ρ in each of the analyzed regions was the lowest, in accordance with the analysis of Zermeño-Díaz and Gómez-Mendoza (2023), who depicted a weak signal of the La Niña-WPP for northwestern Mexico. As for the covariation of La Niña and the SPP, all the analyzed stations in Sinaloa developed increasing trends. Here, the detected differences among regions showed a larger effect on the SM and SM foothills regions. This scenario could potentially mitigate dryness in the seasonal regions by increasing rainfall and/or advancing the start of the rainy season.
A relevant feature of the spatial distribution of the covariances of ENSO variation on the seasonal rainfall amounts is its homogeneity. In the four performed analyses, we did not detect relevant spatial discrepancies in the directions of correlations in nearby stations. These results suggest that spatial physical heterogeneity does affect local rainfall regimes under ENSO variation, although further research needs to be done in this area.
4.3 Geographic and spatial covariance
Although El Niño and La Niña physical conditions are opposed, their Spearman’s ρ correlation products with WPP amounts correlated in the same manner with latitude. These two results, together with those described by regression between longitude-El Niño-WPP and longitude-La Niña-WPP, indicate that rainfall amounts in the southern and eastern stations of the studied area are prone to increase during winter in both extremes of the ENSO variation. In contrast, as depicted by the regression between longitude and El Niño-SPP, southeastern stations are more sensitive to Pacific warmer water conditions; in this case, although these stations possess larger SPP means in such scenario, rainfall below its average would enhance lack of water availability and so dry conditions during summer due to frequent elevated temperatures in such season.
Regarding altitude, summer rainfall regressions generated two contrasting directions. During El Niño conditions, a few CP stations plus Surutato from the SM region tend to develop a minor increase in rainfall amounts. This condition could slightly mitigate dry conditions in that region, but the SF and the SM stations developed negative trends. Hence, in such regions is evident that El Niño decreases water availability in summer. On the contrary, during La Niña in summer, as altitude increases across regions, the covariation of La Niña and rainfall amounts increases accordingly, hence ameliorating dry conditions due to increased rainfall conditions in all stations.
4.4 Multivariate analysis
From a multivariate perspective, the relevance of ENSO variations in seasonal rainfall amounts seems rather scarce, given the explained variance of the principal components. In PC1, which explains half of the total variance, most of the variation is illustrated by the weights of APP, SPP, WPP, %WPP, number of rainfall events, and PCI. Nevertheless, correlations of El Niño-SPP and La Niña-SPP found in PC1 are important. El Niño-SPP correlation and PCI mainly determine the multivariate responses of CP and 14 stations of the SF, indicating that summer rainfall would increase in this area if El Niño is present. On the other hand, if La Niña is present in summer, rainfall amounts would increase in all SM and eight stations of the SF.
For PC2, El Niño-WPP and La Niña-WPP are relevant in 10 of the 12 stations of the SM region, southern CP stations, and 10 SF stations. This depicts that in winter, regardless of the contrasting El Niño and La Niña conditions, rainfall amounts could increase in the aforementioned stations.
5. Conclusions
All the seasonal rainfall variables analyzed here were differentiated on a regional scale. Altitude was correlated significantly to all seasonal rainfall variables, pointing to the relevance of orography in the development of rainfall convective processes for the SF and SM stations. Although there is a decrease in APP, SPP, and WPP means towards the north and lower altitudes, the %WPP increases. This percentage of water is of paramount relevance for ecosystem processes since it can mitigate the lack of humidity during the following dry season. Contrary to expectations, longitude presented twice as many significant results as latitude.
The effect of ENSO in seasonal rainfall amounts in the analyzed watershed is better described by seasons. In winter, the effect of El Niño tends to be more homogeneous in terms of direction by increasing chances of rainfall in all the studied stations, as depicted by the regional non-significant differentiation. Similarly, although with less intensity, La Niña’s effect in winter also increased rainfall amounts in Sinaloa and the rest of the watershed. Contrastingly, El Niño and La Niña showed opposite effects. El Niño showed negative correlations, pointing to decreasing rainfall amounts, whilst La Niña showed positive correlations (i.e., increasing rainfall) with a marked regional differentiation.
The effect of El Niño-SPP covariation in Sinaloa is particularly relevant since it is correlated to a decrease in rainfall amounts across all regions, potentially limiting water availability and worsening the effects of a prolonged dry season, hence affecting not only natural ecosystemic processes but also primary economic activities such as agriculture and cattle production.
Concerning the covariance of SPP with El Niño and La Niña, the regional differences in Spearman’s ρ, linear regressions with longitude and altitude, and spatial Moran’s autocorrelation obtained in this study suggest that summer seasonal rainfall in Sinaloa is highly reactive to both extremes of ENSO variation, producing opposite effects.
Latitudinally, regardless of the interaction with the contrasting conditions of El Niño/La Niña, the effects in the stations were very similar, with more notorious effects in southern stations. In terms of longitude, the correlation of WPP and El Niño/La Niña also occurred in the same manner as with larger effects towards eastern stations. On the contrary, SM stations showed a slightly more intense decrease in rainfall in the summer with El Niño conditions.

