nueva página del texto (beta)
 Inglés (pdf)
 Artículo en XML
 Referencias del artículo
 Enviar artículo por email
 Citado por SciELO
  Similares en
SciELO
Similares en
SciELO 
 Permalink
1. Introduction
As the planet faces increasingly evident climate changes, understanding the factors driving climatic variations at the regional level becomes important for decision-making. In this context, the Atlantic Ocean plays a crucial role, being directly affected by global climate changes, such as increased sea surface temperature (SST) and alterations in atmospheric and oceanic circulation patterns (Campos, 2014). Moreover, changes in the Atlantic Ocean can have significant impacts on precipitation variability in the Northeast Region of Brazil (NEB) (Soares et al., 2023), which have been widely investigated to establish adaptation measures for potential impacts in this region (Lübbecke and McPhaden, 2013; Foltz et al., 2019; Utida et al., 2019; Mao et al., 2022).
The climatic variability of the Tropical Atlantic (TA) involves different processes of ocean-atmosphere interaction, climate oscillations, inter-hemispheric SST gradients, and anomalous wind patterns (Chiang et al., 2002; Okumura and Xie, 2004; Xie and Carton, 2004), which have a direct relationship with regulating patterns of air temperature and precipitation in various regions of the planet (Lübbecke and McPhaden, 2013). Several studies have been conducted to understand the climatic processes influencing this variability at different spatial and temporal scales (Kushnir et al., 2006; Marengo et al., 2017). Among them, the interannual variability modes Atlantic Niño (Hastenrath and Heller, 1977) and Atlantic Meridional Mode (AMM) (Moura and Shukla, 1981; Servain and Seva, 1987; Chang et al., 2006; Hastenrath, 2006) stand out.
The AMM is recognized as a key factor in regulating the climate in the NEB, being widely regarded as the primary mode of long-term variability for interannual climate fluctuations in the TA. Its formation involves variations in SST, low-level wind patterns, and sea-level atmospheric pressure in both the North Tropical Atlantic (NTA) and South Tropical Atlantic (STA) on temporal scales ranging from seasonal to decadal.
The Atlantic Niño is a coupled ocean-atmosphere mode responsible for controlling interannual variability in the TA. This mode is associated with changes in atmospheric circulation (Merle et al., 1980; Servain et al., 1982; Hirst and Hastenrath, 1983; Philander, 1984; Lübbecke et al., 2018; Wang, 2019) and an increase in the frequency of floods in countries near the Gulf of Guinea in West Africa and northeastern South America during the positive phase (Folland et al., 2001; Giannini et al., 2003; Okumura and Xie, 2004; Losada et al., 2010; Lübbecke et al., 2018; Foltz et al., 2019).
The development of the Atlantic Niño typically begins in the austral autumn (MAM), in response to anomalous weakening of the trade winds over the Equatorial Atlantic (Zebiak, 1993; Ruiz-Barradas et al., 2000; Richter et al., 2013, 2014; Lübbecke et al., 2018), with its peak occurring in the austral winter (JJA) (Zebiak, 1993; Lübbecke et al., 2018). During the positive phase of the Atlantic Niño, positive SST anomalies are established in the STA, as observed by Torralba et al. (2015). These anomalies weaken the inter-hemispheric thermal gradient in the TA, resulting in the southward displacement of the Intertropical Convergence Zone (ITCZ), bringing precipitation to the NEB.
Some studies highlight the relationship between the Atlantic Niño and precipitation in the NEB (e.g., Hounsou-Gbo et al., 2019; Vallès-Casanova et al., 2020). Vallès-Casanova et al. (2020) investigated different types of Atlantic Niño and observed that during positive phase events, there is a significant increase in precipitation in northeastern South America. Hounsou-Gbo et al. (2019) demonstrated that the positive (negative) phase of the Atlantic Niño is associated with increased (reduced) rainfall in northern NEB, especially in the municipalities of Recife (Pernambuco) and Fortaleza (Ceará), with the peak occurring with a lag of two to four months relative to the Atlantic Niño index.
Studies such as those by Nascimento et al. (2017) and Soares et al. (2023) highlight the influence of TA conditions on precipitation patterns in Maranhão, which will be one of the study’s objectives. In particular, Soares et al. (2023) examined the impacts of the Pacific-Atlantic teleconnection on the state’s precipitation regime between 1980 and 2015 and observed a clear influence of Western Equatorial Atlantic SST anomalies on precipitation in Maranhão, especially in the northern region. These studies demonstrate that TA conditions play a crucial role in precipitation variability in Maranhão, directly affecting the distribution of rainfall in the state.
This precipitation variability, in turn, is directly related to SST anomalies in the TA, making it essential to understand this relationship for efficient water resource planning in the region. A detailed understanding of this connection not only helps to predict climate patterns but is also fundamental for improving water resource management. This, in turn, directly benefits socioeconomic activities, especially in the northern and southern regions of Maranhão, which are key to the state’s economy, encompassing activities such as agriculture, mining, livestock farming, and tourism.
In section 2, we present the datasets used, including in-situ observations and global climate reanalysis. Additionally, we explain the methodology used to characterize and identify Atlantic Niño and AMM events. In this section, we also address the identification of non-stationary spectral patterns of Atlantic Niño. The main findings are discussed in section 3, and finally, the study’s conclusions are presented in section 4.
2. Data and methods
2.1 Study area
The study area comprises the TA region (Fig. 1a) and the state of Maranhão (Fig. 1b). The dashed rectangles in Fig. 1a represent the regions of the NTA (5.5º-23.5º N; 57.5º-15º W) and the STA (0º-20º S; 30º W-10º E), where the years of occurrence of the AMM (Moura and Shukla, 1981) were estimated. The solid rectangle in the same figure represents the ATL3 region (3º N-3º S, 20º W-0º E), where the years of occurrence of the Atlantic Niño were estimated.
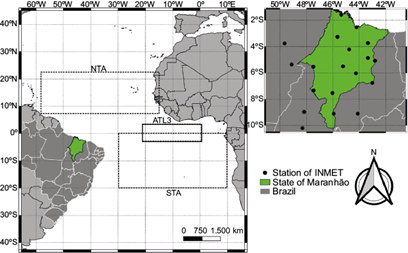
Fig. 1 (a) Spatial domain of the North Tropical Atlantic (NTA) (5.5º-23.5º N; 57.5º-15º W), South Tropical Atlantic (STA) (0º-20º S; 30º W-10º E), and ATL3 (3º N-3º S; 20º W-0º E) regions; (b) location of the state of Maranhão (in green) and the INMET meteorological stations analyzed in this study.
The state of Maranhão has a population of over 7 million inhabitants, and it encompasses part of the Cerrado biome area of the country, integrating the Matopiba region, which also includes areas of the states of Tocantins, Piauí, and Bahia (Bolfe et al., 2016). This region is recognized for adopting modern agriculture geared toward exports, with soybean and corn production being its main crops (Loayza et al., 2023). Rainfall totals in the state show significant variations, ranging from 700 mm year-1 (inland) to 2,000 mm year-1 (coastal areas) (NUGEO, 2023).
The spatial distribution of rainfall is heterogeneous due, in part, to geographic features that allow the state to be influenced by the Amazonian complex to the north and northwest, where the climate exhibits equatorial characteristics, being hot and humid (Nascimento et al., 2017). Meanwhile, another part of the state is located in the semi-arid region of the Northeast, giving it distinct and peculiar characteristics (Nascimento et al., 2017). Precipitation in Maranhão shows marked semi-annual variability, with a rainy season occurring from December to May, with emphasis on February to May, which are the rainiest months, and a dry season from June to November (Nascimento et al., 2017; Silva et al., 2017). This variability is significantly affected by the climatic conditions of the TA (Soares et al., 2023).
2.2 Data
The monthly outputs of SST and 10-m wind were obtained from the European Centre for Medium-Range Weather Forecasts (ECMWF) reanalysis v. 5 (ERA5) (Hersbach et al., 2020), with a horizontal resolution of 0.25º (~28 km) and covering the period from January 1980 to December 2020 (41 years).
This study used monthly precipitation accumulations for the same period (1980-2020) from 23 meteorological stations of the National Institute of Meteorology of Brazil (INMET), obtained from the Meteorological Database for Teaching and Research (BDMEP). Of these 23 stations, 12 are located within the territorial limits of Maranhão and the rest in neighboring states, Pará and Piauí (Fig. 1b), aiming to improve precipitation data interpolation.
2.3 Treatment of precipitation data
From the identification of missing data in the time series of in situ precipitation, we developed an algorithm capable of identifying all the gaps and creating temporal vectors (years and months) to fill them. The spatial interpolation of data for the state of Maranhão domain was performed using the statistical method Biharmonic spline (Sandwell, 1987), which showed the lowest precipitation errors. After data spatialization, we calculated quarterly precipitation anomalies with one-month moving averages (e.g., DJF, JFM, FMA, etc.) from the climatological mean of 1980-2020 for each quarter.
2.4 Indices of Atlantic variability modes
With the aim of assessing the occurrence years of the Atlantic Niño, quarterly SST anomalies in the ATL3 region (Fig. 1a) were calculated using quarterly means with a one-month moving window (e.g., DJF, JFM, FMA, etc.). The Atlantic Niño occurrence years were defined following the methodology proposed by Vallès-Casanova et al. (2020), based on standard deviation normalization and persistence of SST anomalies equal to or greater (less) than +0.5 ºC (-0.5 ºC) for at least three consecutive quarters. SST anomalies above +0.5 ºC characterized the positive phase of ATL3, and anomalies equal to or below -0.5 ºC, the negative phase. The positive and negative Atlantic Niño events were classified according to the temporal evolution pattern of SST anomalies (SSTAs) in the ATL3 region over the quarters, where we defined four categories, as proposed by Vallès-Casanova et al. (2020): (i) late onset (events lasting four consecutive quarters, from ASO to NDJ); (ii) early termination (events lasting four consecutive quarters, from FMA to MJJ); (iii) persistent events (events lasting more than four consecutive quarters); and (iv) transitional events (events in which, in the same year, an early termination event and a late onset event occurred).
The occurrence years of the AMM were identified based on its index, which consists of the difference between the mean monthly SST anomalies in the ATN and ATS regions, normalized by the standard deviation, as shown in Eq. (1).
where IAMM is the Atlantic Meridional Mode index, SSTA NTA is the mean of SST anomalies in the NTA, and SST STA is the mean of SST anomalies in the STA.
Subsequently, the occurrence years of the AMM were identified, focusing on the months between February and May (FMAM), when the rainy season of the NEB is established. The years in which the AMM index ranged between -0.5 and +0.5 were excluded, as they represent the neutral phase of this mode. The occurrence years of the AMM can be found in the supplementary material (Table SI).
2.5 Statistical analyses
From the quarterly precipitation anomalies in Maranhão and the quarterly TSM anomalies in the ATL3 region, the mean compounds of the years and quarters that characterized the occurrence of different types of Atlantic Niño for both negative and positive phases were calculated. Precipitation compounds were constructed for the late onset, early termination, and persistent events only.
Finally, we used the Complex Morlet Wavelet Transform (Torrence and Compo, 1998) to identify and analyze the interannual and decadal variability and to detect the most significant periods of Atlantic Niño occurrence between 1980 and 2020. The Morlet wavelet analysis (Eq. [2]) was employed based on the algorithm written by Torrence and Compo (1998):
where ψ 0 (η) is the frequency, η is the non-dimensional time, and ω 0 is the non-dimensional frequency.
3. Results and discussions
Through the ATL3 index, we identified the occurrence of 20 Atlantic Niño events from January 1980 to December 2020. Out of this total, nine events were classified as negative phase and 11 as positive phase (Table I and Fig. 2a).
Table I Years of occurrences of Atlantic Niño events between January 1980 and December 2020, classified by phase (negative or positive), category (early termination, persistent, late onset, and transitional), and duration (in quarters of each event).
| Atlantic Niño events | ||||
| Negative | Positive | |||
| 1982, 1983, 1986, 1991*, 1992, 1996*, 1997*, 2005, 2014 | 1981, 1984, 1987, 1988, 1991*, 1995, 1996*, 1997*, 1998, 1999, 2019 | |||
| Category | Negative | Duration (quarterly) | Positive | Duration (quarterly) |
| Early termination | 2005 | 3 | 1995 | 3 |
| Persistent | 1984, 1988 | 6-7 | 1992 | 9 |
| Late onset | 1981, 2019 | 3-4 | 1986, 2014 | 3 |
| Transitional | 1991*, 1996* | 3-4 | 1997* | 6-9 |
*Years of Atlantic Niño with characteristics of transitional events.
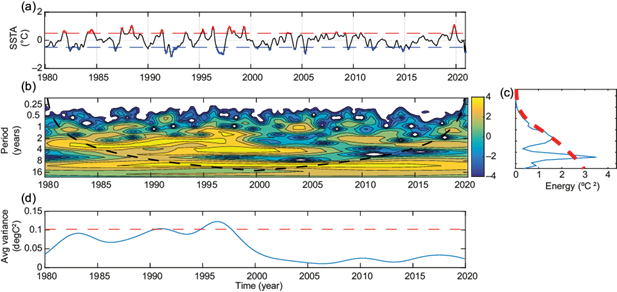
Fig. 2 (a) Time series of sea surface temperature (SST) anomalies (ºC) in the ATL3 region, highlighting positive (red) and negative (blue) events, as well as thresholds (dashed lines) for positive (≥ +0.5 ºC) and negative (≤ -0.5 ºC) events; (b) wavelet power spectrum of the ATL3 index and cone of influence (dashed black line); (c) global power spectrum of the ATL3 and 95% confidence level (dashed red line); (d) scale-averaged wavelet power or variance and 95% confidence level (dashed red line).
Atlantic Niño events have a periodicity between 2 and 8 years, with the most intense spectral contours around 4 to 8 years (Fig. 2b-c). Furthermore, it was observed that the highest wavelet variances were recorded in a specific set of years: 1992, 1996, 1997, 1998, and 1999 (Fig. 2d). The peak observed in the 2-8-year scale may be associated with the El Niño-Southern Oscillation (ENSO). We also observed a symmetry between positive and negative Atlantic Niño events (Fig. S4), which behave like “reflections” of each other. This symmetry pattern has been addressed by Lübbecke and McPhaden (2017), who demonstrated that positive Atlantic Niño events exhibit such symmetry. Additionally, the calculation of Bjerknes feedback terms reveals that the intensity of the feedback is very similar for warm and cold phases in the Atlantic.
Studies by Chiang et al. (2000) and Munnich and Neelin (2005) have shown that the anomalous atmospheric convection caused by ENSO in the eastern Equatorial Pacific influences the interannual variability of the trade winds during the boreal spring in the Equatorial Atlantic and, consequently, triggers an Atlantic Niño event. Tokinaga et al. (2019) suggested that successive ENSO events may initiate Atlantic Niño events through atmospheric teleconnection. Wang et al. (2024) explains that the key factor for the long-term strengthening of the relationship between Atlantic Niño and ENSO is the average increase in SST in the Atlantic due to global warming. The year 1997, when a strong El Niño event occurred (NOAA, 2021), was also a year of a negative transitional Atlantic Niño event.
Since the 2000s, there has been a significant decrease in Atlantic Niño events (Fig. 2a). This decline can be attributed to the weakening of the Bjerknes feedback mechanism (Prigent et al., 2020). This mechanism involves positive SST anomalies in the eastern TA, reducing temperature gradients between the western (typically warmer) and eastern (usually cooler) sectors of the basin. This thermal imbalance weakens the eastward zonal winds (the trade winds), generating a long-period oscillation known as the equatorial Kelvin wave (Dippe et al., 2019), which propagates eastward along the equator, affecting the vertical structure of the ocean and deepening the thermocline in the eastern basin, where there is higher heat content stored in the surface layers of the ocean (Deppenmeier, 2022). Changes in any of the three components of this mechanism (positive SST anomalies in the east, weaker trade winds, or a deeper thermocline in the east) can impact the development of the Bjerknes feedback. However, the influence of the first two components is particularly relevant, as highlighted by Prigent et al. (2020). These authors observed that, after 2000, compared to the period from 1982 to 1999, the first component of the Bjerknes feedback weakened by 21% during JJA and 24.5% during NDJ. The second component also showed a significant reduction, of 30.2% in JJA and 32.7% in NDJ.
In addition to the weakening of the Bjerknes feedback, the decrease in decadal variability of SST in the eastern Equatorial Atlantic since the 2000s may also be associated with the positive phase of the AMO (Martín-Rey et al., 2018). Although it was presumed that the period from 2000 to 2020 would not present such expressive Atlantic Niño events as the period from 1980 to 1999, the positive event that occurred in 2019 was the most intense Atlantic Niño event observed in the studied series, as evidenced by Figure 2a. A recent study (Richter et al., 2022) showed the development of an intense positive Atlantic Niño event in the JJA trimester of 2021, which extended until the end of the year.
The temporal evolution pattern of the 20 Atlantic Niño events varies in terms of onset, peak, and decay, which can be observed in the time series of the ATL3 index (Fig. 3) for the Atlantic Niño events (see Table I).
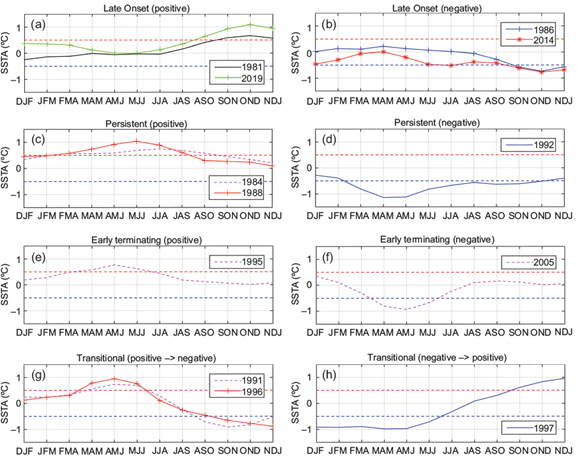
Fig. 3 Temporal evolution of the ATL3 index during the years of Atlantic Niño occurrences between 1980 and 2020, classified as (a) positive early termination, (b) negative early termination, (c) positive persistent, (d) negative persistent, (e) positive late onset, (f) negative late onset, (g) positive transitional, and (h) negative transitional. The dashed black lines represent the sea surface temperature (SST) anomaly thresholds (SSTAs) for positive (> +0.5 ºC) and negative (< -0.5 ºC) events.
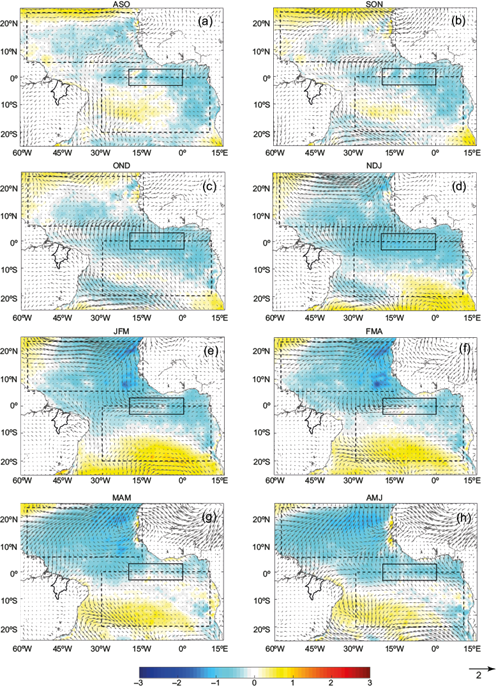
Some late-onset events followed the development pattern of Atlantic Niño events identified in other studies, being preceded by the weakening of the equatorial trade winds (Fig. 4). Some works suggest that this type of event can be triggered by internal (Keenlyside and Latif, 2007) and external (Zhang and Han, 2021) processes in the Equatorial Atlantic Ocean. For example, Okumura and Xie (2006) indicate that late-onset events may be triggered by a secondary and seasonal weakening of the trade winds in the Gulf of Guinea. Zhang and Han (2021) report that the intensity of the Indian Ocean Dipole can affect late-onset events, including the strong positive phase event and late-onset event that occurred in 2019 (Fig. 2a), which coincided with the strong positive phase event of the Indian Ocean Dipole in 2019, which was considered one of the strongest events since 1979 (Zhang et al., 2021).
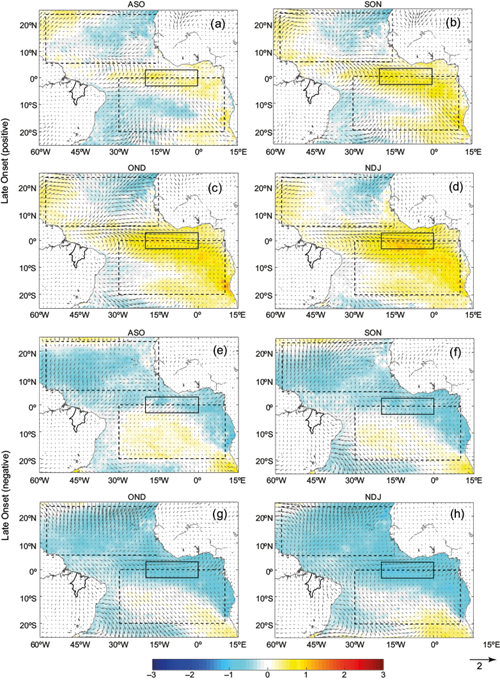
Fig. 4 Spatial evolution of quarterly sea surface temperature (SST) anomalies (ºC) and 10-m wind (m s-1) in the tropical Atlantic during positive (a-d) and negative (e-h) late onset events.
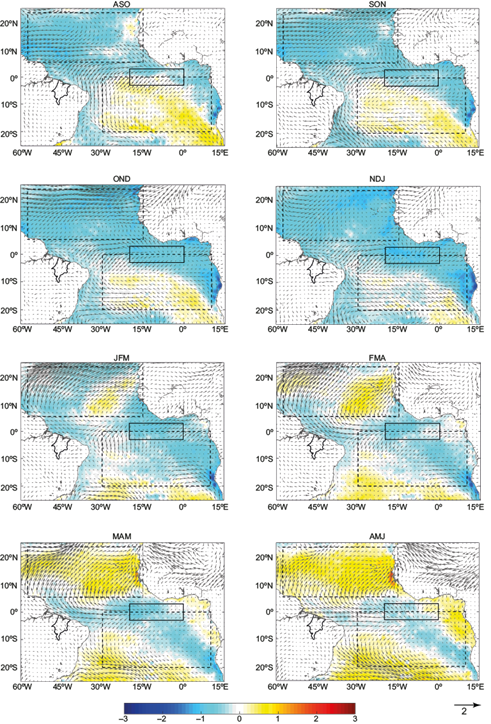
We observed that the negative phase and early termination event in 2005 it was associated with intense positive SSTAs in the NTA and anomalous easterly winds in the equatorial region of the Atlantic, which could be characterized, according to Richter et al. (2013), as a “non-canonical” event (Fig. 5e-h). Negative Atlantic Niño events of the “non-canonical” type are associated with intense positive anomalies in the NTA and/or the positive phase of the AMM (Ruiz-Barradas et al., 2000; Chiang and Vimont, 2004). In this case, these events can be explained by the wind-evaporation-SST feedback. According to Foltz and McPhaden (2010) and Vallès-Casanova et al. (2020), positive and early termination events of the Atlantic Niño can be triggered by a negative phase of the AMM in the austral autumn. For example, positive (1995) and negative (2005) early termination events were preceded by negative and positive phases of the AMM, respectively, in the austral autumn (not shown). For persistent events (Fig. 6), easterly wind anomalies were observed in the equatorial region, especially during the negative phases of the Atlantic Niño in the MAM to MJJ quarters, which were associated with pronounced negative SST anomalies in the ATS.
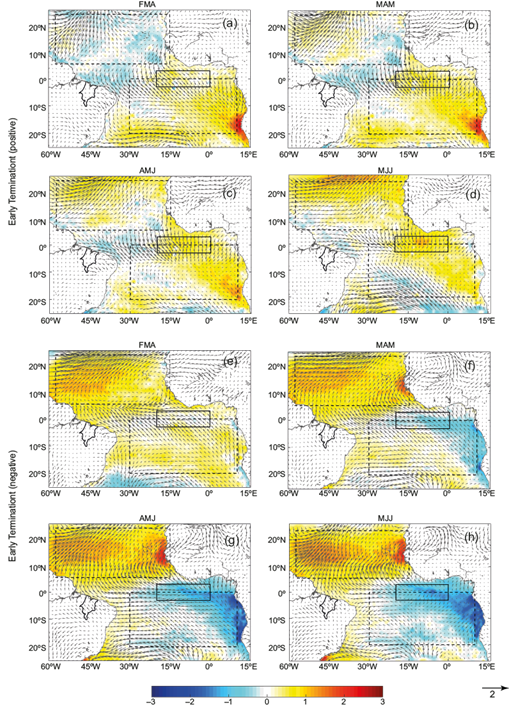
Fig. 5 Spatial evolution of quarterly sea surface temperature (SST) anomalies (ºC) and 10-m wind (m s-1) in the tropical Atlantic during positive (a-d) and negative (e-h) early termination events.
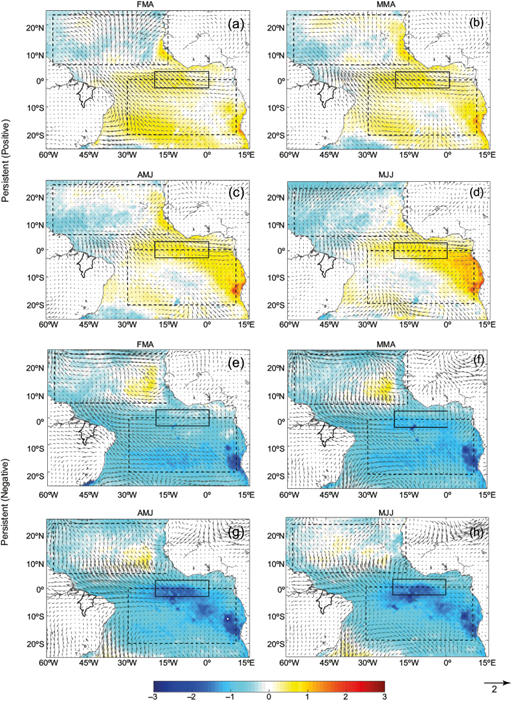
Fig. 6 Spatial evolution of quarterly sea surface temperature (SST) anomalies (ºC) and 10-m wind (m s-1) in the tropical Atlantic during positive (a-d) and negative (e-h) persistent events.
The positive AMM event in 1992 (Fig. 7 e-h) was preceded by a negative and persistent Atlantic Niño event in 1991 (Fig. 7 a-d). We also observed that late-onset events, like the one in 2014, can trigger AMM events of the same sign the following year (Fig. S1). This same pattern was observed in late-onset Atlantic Niño events in 1986, which initiated an event of the same sign in AMM in 1987 (Fig. S2). This suggests that the phase and intensity of AMM events can influence the temporal evolution of Atlantic Niño events. This relationship between the Atlantic Niño and AMM modes has been widely investigated in previous studies (Plaut and Vautard, 1994; Moron et al., 1998; Huang et al., 1998; Foltz and McPhaden, 2010; Martín-Rey et al., 2019). The literature suggests that the Atlantic Niño and AMM modes are connected through the meridional displacement of the ITCZ (Servain et al., 1999; Murtugudde et al., 2001; Andreoli and Kayano, 2003). Foltz and McPhaden (2010) emphasize that the relationship between the Atlantic Niño and AMM occurs through anomalies in surface equatorial winds and their relationships with the meridional and zonal gradients of SST.
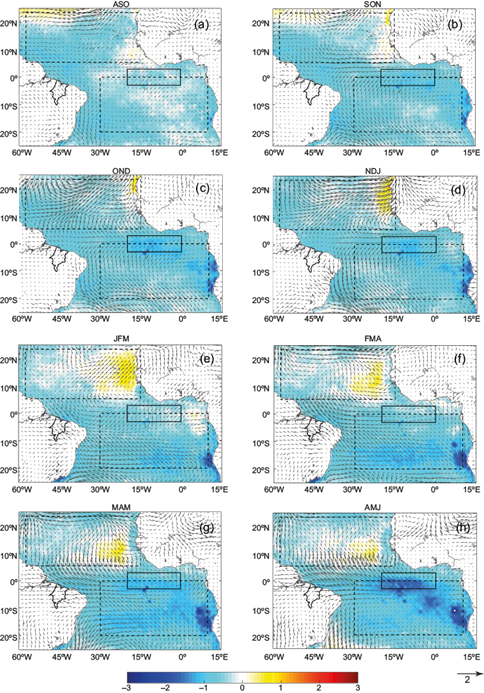
Fig. 7 Evolution of SST anomalies (ºC) and surface winds (m s-1) in the Tropical Atlantic for the negative phase events of the Atlantic Niño occurring in 1991 (a-d) and the AMM occurring in 1992 (e-h). Spatial domain of the North Tropical Atlantic (NTA): 5.5º-23.5º N, 57.5º-15º W; of the South Tropical Atlantic (STA): 0º-20º S, 30º W-10º E; and of the ATL3 region: 3º N-3º S, 20º W-0º E.
We also observed that in transitional events (not shown), characterized by the occurrence of two events of opposite phases in the same year, the secondary peak (occurring from SON to OND) can be triggered by oceanic outflow associated with the South Equatorial Current (Okumura and Xie, 2006), which flows westward, partly in response to the intensification of easterly winds, along with a shallower thermocline and an intensified equatorial upwelling process east of the basin (Okumura and Xie, 2006). Furthermore, Lübbecke et al. (2014) suggested that a more intense activity of the South Atlantic Subtropical High (SASH) in February may anticipate the formation of the cold tongue of the Equatorial Atlantic, i.e., the negative phase of the Atlantic Niño. On the other hand, a less intense SASH would delay the development of this cold tongue, resulting in a positive Atlantic Niño event (Lübbecke et al., 2014). This SASH activity may be influenced by El Niño events. Rodrigues et al. (2011) show that strong and prolonged El Niño events (weak and short), associated with a heating source in the eastern (central) Pacific, trigger the second (third) mode of the Pacific-South America pattern in SON, which consequently leads to a strengthening (weakening) of the SASH. Additionally, Atlantic Niño events can be triggered by eastward oceanic advection through the propagation of the equatorial Kelvin wave in the absence of westerly wind anomalies in the austral autumn (MAM) (Richter and Tokinaga, 2021).
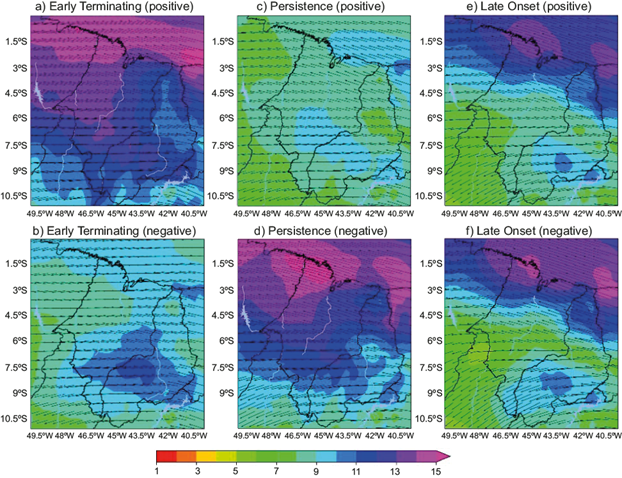
Regarding precipitation anomalies in the different categories of Atlantic Niño events (Fig. 8), we observed that during the negative phase of the early termination event, the state of Maranhão recorded significantly above-average precipitation in the northwest and south regions, with anomalies exceeding +100 mm (Fig. 8d). Typically, the negative phase of the Atlantic Niño is associated with a significant decrease in precipitation in the northeastern region (Hounsou-Gbo et al., 2019), which was also observed in Maranhão during the late-onset and persistent negative events (Fig. 8b, f).
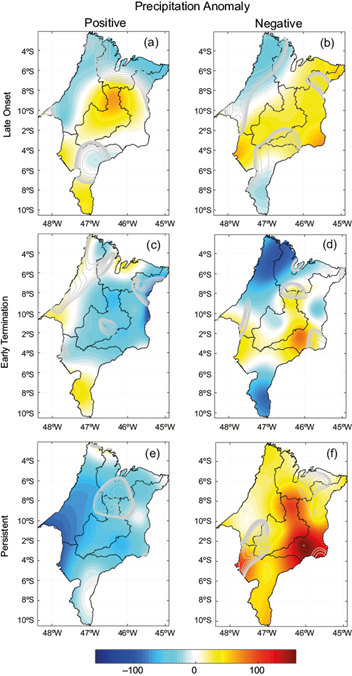
Fig. 8 Average quarterly precipitation anomalies (mm) in the state of Maranhão during positive (first column) and negative (second column) events in years of Atlantic Niño occurrences of the following types: (a-b) late onset, (c-d) early termination, and (e-f) persistent. Gray lines indicate statistically significant values at the 95% level.
This increase in precipitation observed during the negative phase of the early termination event in the northwest and south regions of the state, even during a positive AMM event, may result from the intensification of moisture transport from the ocean to the continent by equatorial winds (Fig. S3) or the influence of the 2005 La Niña event (NOAA, 2021), which may have affected the variability of the trade winds over the equatorial Atlantic and consequently the positioning of the ITCZ (Munnich and Neelin, 2005), which is considered the main driver of precipitation in the state.
During persistent positive events, we observed significant positive precipitation anomalies in the western region of the state (Fig. 8e). These substantial values can be explained by the study by Torralba et al. (2015), which describes that during the occurrence of the Atlantic Niño, positive SST anomalies appear in the STA. These anomalies weaken the inter-hemispheric SST gradient in the Atlantic, which enhances the southward displacement of the ITCZ, resulting in positive anomalies in the region (Torralba et al., 2015). This behavior suggests that the persistent positive phase of the Atlantic Niño may intensify moisture transport processes to the western region, leading to above-average rainfall. On the other hand, during the negative phase of persistent events, significant negative precipitation anomalies were identified across almost the entire state, with an even sharper reduction in the western region (Fig. 8f), which seems to be particularly sensitive to oscillations between the positive and negative phases. This widespread decrease in precipitation may be attributed to the inhibition of mechanisms that favor convection and moisture transport, characteristics associated with the negative phase of the Atlantic Niño.
4. Conclusions
In this study, the impact of TA SST on precipitation anomalies in the state of Maranhão was investigated. Analyzing the ATL3 index between 1980 and 2020, 20 Atlantic Niño events were identified, with a dominant scale of two to eight years. There was a significant decrease in events from the 2000s, probably due to the weakening of the Bjerknes feedback and the influence of the AMO. However, some positive Atlantic Niño events that occurred outside of this pattern, such as those in 2019 and 2021, indicated the influence of the negative phase of the AMO on the potential reactivation of the Atlantic Niño after 19 inactive years (Richter et al., 2022).
The negative early termination event, characterized by positive anomalies of SST in the NTA and positive anomalies of easterly winds, was considered a “non-canonical” event. Furthermore, we observed a relationship between the Atlantic Niño and the AMM, indicating that the intensity of the AMM influences the temporal evolution of Atlantic Niño events and vice versa. The intersection of these modes ultimately influences crucial elements such as SST and interhemispheric winds. These factors, in turn, directly impact precipitation patterns in Maranhão. It is noteworthy that during the negative phase of the Atlantic Niño’s early termination event, an atypical precipitation trend was observed in the state. In this phase, there was a noticeable increase in precipitation levels, especially in the northwest region. This contrasts with the pattern generally associated with the negative phase of the Atlantic Niño and the positive phase of the AMM, which are typically correlated with reductions in rainfall in the region.
A plausible explanation for this unexpected increase in precipitation during the negative phase of the early termination event may be related to the intensification of moisture flux transported from the ocean to the continent by equatorial winds. Additionally, the possible influence of the La Niña phenomenon that occurred in 2005 may have contributed to this pattern. This analysis highlights the complexity of climate interactions in the Maranhão region and underscores the importance of considering multiple factors, including local and remote climate modes and extreme events of atmospheric systems, for a more comprehensive understanding of precipitation patterns and climate variability in this area.
In summary, the results reveal that Atlantic Niño events can be distinct based on the generating mechanisms. Additionally, precipitation exhibits different behaviors for the different types of these events. Notably, late-onset events demonstrate significant relationships with the northern and southern regions of the state, which play a crucial role in the socio-economic development of the region. Therefore, continuous monitoring and conducting studies related to Atlantic Niño and AMM are essential to deepen the understanding of these variability patterns and thus anticipate possible impacts on the volume and distribution of rainfall in Maranhão. Furthermore, the results of this study have the potential to contribute significantly to agricultural planning in the southern part of the state, and also to port operations in the north, especially in the Itaqui Port Complex. This complex, classified as the largest port in the Northern Arc, faces frequent challenges during rainy periods, as most bulk solids, such as corn and soybeans, cannot be moved under these conditions. This leads to significant operational delays and consequently substantial financial losses. Therefore, understanding how Atlantic Niño influences rainfall in the state becomes an essential tool in strategic planning.