


 nueva página del texto (beta)
 Inglés (pdf)
 Artículo en XML
 Referencias del artículo
 Enviar artículo por email
 Citado por SciELO
  Similares en
SciELO
Similares en
SciELO 
 Permalink
1. Introduction
One of the most specific climates on Earth is the wet tropical climate, which is encountered only at the highest equatorial mountains of the Andes, specifically in the páramo ecosystem (Suárez et al., 2023). According to Vásquez et al. (2022), the climate of the tropical Andean region, particularly high-mountain regions like the paramo ecosystem, can be classified as Cfc according to the Köpeen-Geiger categories (Kottek et al., 2006) and is characterized as a warm temperate climate, totally humid, with cool summer and cold winter. In the Andean páramo ecosystem, meteorological variables change constantly throughout the day and night, constituting a fundamental factor in the local climate and the hydrological cycle (Whiteman, 2001; Ruiz-Hernández et al., 2021). The changes result from the interplay between regional mechanisms and local atmospheric circulation induced by topography (Yang and Slingo, 2001; Takahashi et al., 2010; Junquas et al., 2018; Espinoza et al., 2020; Kumar et al., 2020), causing strong horizontal and altitudinal gradients (e.g., Guo et al., 2014; Immerzeel et al., 2014; Sklenár et al., 2015) that define diurnal and seasonal modes of variability (e.g.,Oettli and Camberlin, 2005; Ilbay-Yupa et al., 2021). These high-altitude ecosystems are particularly sensitive to the impacts of climate change, where even small shifts in temperature and precipitation patterns can lead to significant ecological consequences (Cresso et al., 2020; Valencia et al., 2020).
For this reason, a long-term time series of high-quality meteorological observations is fundamental to understanding the climatology and climate variability at high elevations of the tropical Andes. Unfortunately, in mountain areas, the installation and maintenance of meteorological stations are difficult tasks due to the usual remoteness and the challenging environmental conditions for meteorological monitoring.
In consequence, knowledge about the diurnal to seasonal meteorological cycles in the tropical high Andes is often derived from short-period climate records spanning only days or weeks (e.g., Diemer, 1996; Sømme et al., 1996; Sklenár, 1999). Measurements of climatic variables lasting longer than one year are uncommon at the highest elevations (e.g., Hardy et al., 1998; Wagnon et al., 2009; Sklenár et al., 2015). Studies with longer periods (up to five years) are conducted in mid-elevation sites of the páramo belt (e.g., Witte, 1996; Rapp and Silman, 2012; Newell et al., 2022), and only a few studies exceed the period of a decade with measurements of a single climatic variable (e.g., Poveda et al., 2005).
Moreover, the study of daily to seasonal climate variability in the upper Páramo belt of the humid equatorial Andes is an essential prerequisite to: (1) calibrate and validate statistically and dynamically downscaled climate models (Ochoa et al., 2016); (2) generate spatially distributed models of climate and hydrology (Lyra et al., 2014; Rohm et al., 2014; Shea et al., 2015); (3) detect climatic risks and their relationships with atmospheric and pollution process (Wu et al., 2018); and (4) study the phenology of biota (Kudo and Suzuki, 2004; Fagua and González, 2007).
Given the limited availability of long-term climate measurements in the tropical Andean region, a network of automatic weather stations (AWS) distributed along an altitudinal gradient (between 3298 and 3955 masl) in the Interandean valley in southern Ecuador was established in 2013 to monitor the climate of the region at 5-min frequency measurements. Thus, this paper aims to describe the diurnal to seasonal meteorological patterns of the first 10 years of monitoring and quantify the spatiotemporal variability of the main meteorological variables: precipitation, air temperature, relative humidity, incident solar radiation, and wind speed and direction. In particular, using this unique dataset, we examine the extent to which daily to seasonal meteorological variables are related to their position in the altitudinal gradient.
2. Materials and methods
2.1 Study area
The study area is along an altitudinal gradient between 3298 and 3955 masl, located in southern Ecuador in the Interandean valley and is within the Macizo del Cajas, declared as part of the World Network of Biosphere Reserves (WNBR) by UNESCO in 2013 (Córdova et al., 2016). In addition, Macizo del Cajas provides the water supply to Cuenca (~2500 masl), Ecuador’s third largest city, and other neighboring towns; water originating in the study area is also important for agriculture, industrial activities, and tourism (Célleri and Feyen, 2009).
The climate of the study area is mainly influenced by continental air masses (moisture-laden) from the Amazon basin to an equal degree by the meridional displacement of the Intertropical Convergence Zone (ITCZ), which directly influences the seasonality of rainfall throughout the year and to a lesser degree by dry cool air associated to the Humboldt current in the Pacific Ocean (Buytaert et al., 2006; Garreaud, 2009; Carrillo-Rojas et al., 2016). Consequently, the formation of convective clouds associated with these processes and the formation of orographic clouds associated with the topography are predominant (Schubert, 1982; Bendix et al., 2006a). In addition, the mean temperature lapse rate is 6.88 ºC km-1 (Carrillo-Rojas et al., 2016).
Our study area (Fig. 1) is characterized by steep slopes (up to 66%). The sites where the AWS are located are designated as follows (Table I): the lower elevation Chirimachay (LE) site is situated at 3298 masl; the middle elevation Virgen (ME) site is situated at 3626 masl, and the upper elevation Toreadora (UE) site is situated at 3955 masl near the continental water divide (4167 masl). The AWSs are at linear distances of 3.45 km (UE to ME), 5.70 km (ME to LE), and 17.50 km (LE to Cuenca) and have operated since December 2012 (UE and LE) and the beginning of March 2013 (ME). Thus, the 10-year dataset in the present study is from March 2013 to February 2023.
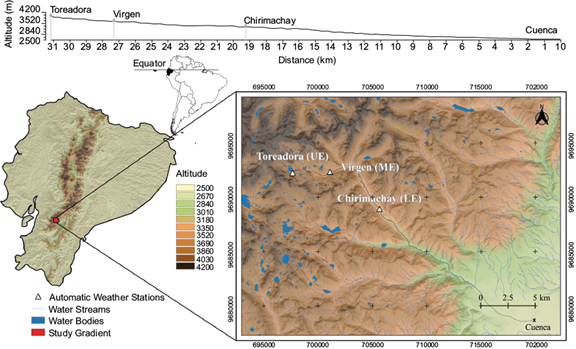
Fig. 1 Topographic map of Ecuador and topographic map of the study area (right) with location of the automatic weather stations. The altitude scale corresponds to the map of the study area: upper elevation (UE) Toreadora, middle elevation (ME) Virgen, and lower elevation (LE) Chirimachay.
2.2 Meteorological data processing and quality control
Each station is equipped with a set of sensors connected to a Campbell CR800 datalogger, which records measurements at a 5-min frequency. The total precipitation (P) (TR525M-TEXAS); mean, maximum, and minimum values of incident solar radiation (SR) (SP215SS-APOGEE); air temperature (T); relative humidity (RH) (CS215-CAMPBELL), and wind speed (WS) and direction (WD) (034E, MET ONE INSTRUMETS) were recorded. Precipitation is recorded as the accumulation over the 5-min interval, and the mean, maximum, and minimum values are recorded based on direct measurements taken during the 5-min intervals. The air temperature, relative humidity sensors, and dataloggers are protected by radiation and windshields (six-plate naturally-ventilated shields; 41303-5A).
The meteorological dataset spans 3652 days, with missing data comprising less than 5% of the total observations. These missing data points are distributed sporadically throughout the decade study across all stations, and thus, they were neglected in the analysis. Quality control was performed according to the protocols suggested by the World Meteorological Organization (WMO, 2023), which include the detection of outliers through statistical analyses, where data points significantly deviating from historical distributions are flagged. Additionally, consistency checks between related variables, such as air temperature and relative humidity, were conducted to ensure logical coherence. The dataset also underwent temporal coherence validation, ensuring no abrupt, unexplained measurement shifts. For spatial coherence, data across nearby stations were compared to detect inconsistencies.
2.3 Spatiotemporal analysis of the main meteorological variables
To investigate annual and daily meteorological cycles through the study period in our gradient, an hourly dataset was calculated based on the 5-min frequency measurements (n =12 per hour) and considering the 60 min after the hour. The values used here were hourly means, maximums, and minimums for all the variables but precipitation, for which hourly totals were calculated.
The diurnal cycle was estimated using the hourly dataset for the 24 h period starting and ending at 07:00 LST, except for SR, starting and ending at 00:00 LST, following the equation applied in several studies (Oki and Musiake, 1994; Poveda et al., 2005; Sklenár et al., 2015; Bedoya-Soto et al., 2019):
where I(h,m,y) represents the value of the climatic variable for the hour h of the day (h = 1,…,24) from a certain month m (m = 1,…,12), and a certain year y (y = 1,…,ny), and n(h,m,y) is the total amount of data for a specific hour, taking into account all months and years of the complete sample. The mean diurnal cycle of the climatic variable is estimated from the long-term average value for each hour (Dh). Rainfall is estimated as an average intensity and was calculated removing the zero values in hourly rainfall. Estimating the diurnal cycle excluding zeros is meaningful since it captures the dynamics whenever rain does actually occur. It has to be considered that calculations are less smooth and greater in magnitude when zero values are removed with respect to calculations including zeros (Bedoya-Soto et al., 2019).
We also estimated the monthly variation of the diurnal cycle of climatic variables. The long-term average value for each hour (h = 1,…,24) at a specific month (m = 1,…,12), was estimated as:
Additionally, we estimated the monthly diurnal cycle as a percentage of total rainfall in each month, which indicates the percentage of rainfall for each hour at each month scaled by the accumulated daily rainfall for each month as:
The denominator represents the daily precipitation accumulated in each month.
3. Results and discussion
3.1 Precipitation
The mean annual cycle of precipitation in the study area exhibits a trimodal (TM) regime, consistent with previous research in high-altitude mountains (above 3000 masl) located within the transition zones between the Interandean Depression and the Amazon and Pacific basins (Célleri et al., 2007). As shown in Figure 2, the rainfall seasonality in the study region is characterized by three distinct peaks throughout the year. A similar trimodal precipitation regime has also been determined in a previous study conducted by Campozano et al. (2016) in the same geographic area. This seasonal regime is characterized by three intervals, from March to May (MAM), October, and from December to January (DJ), and three less humid periods, in February, from August to September (AS), and in November. Globally, rainfall seasonality near the equator is mainly bimodal (BM), with rainfall occurring between March-May and September-November associated with the double passage of the ITCZ around the equinoxes, and with local variations due to a combination of microphysics, dynamics, and thermodynamics of the airflow with the geometry of the terrain (Basalirwa, 1995; Basalirwa, et al. 1999; Poveda et al., 2001; Campozano et al., 2016).
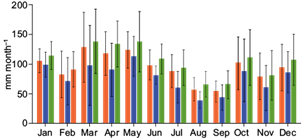
Fig. 2 Long-term mean (2013-2023) of the rainfall annual cycle at UE (orange), ME (blue), and LE (green). Error bars represent the standard deviation of the mean.
In contrast to the BM regime, which supports more efficient agricultural and water management, the TM regime observed in the study area introduces greater water availability variability, complicating agricultural practices, and posing challenges to local biodiversity. While the less humid periods of the trimodal regime may not cause severe droughts, reduced rainfall can still impact crop growth and disrupt ecosystems. Recognizing these differences is crucial for developing strategies that optimize water management and biodiversity conservation in regions with distinct climatic patterns (Buytaert et al., 2005).
To explain the rainfall dynamics of the seasonal regime in the study area, the driving macro- and mesoscale mechanisms must be considered. The precipitation behavior during wetter seasons (MAM and October) is related to the ITCZ position around the equinoxes; thus, higher cloud formation and rainfall of convective nature are expected (Wang, 1994; Campozano et al., 2016). The enhancement of rainfall in the third wetter season (DJ) is due to the orographic lifting of air on the windward side of the western cordillera, forcing convection and rainfall (Campozano et al., 2016). On the other hand, in JJA, there is subsidence due to an intensified Walker circulation, producing advective low clouds at windward slopes of the eastern Andes rather than the formation of deep convective activity, accounting for the less humid season for the TM regime (Laraque et al., 2007; Campozano et al., 2016).
The diurnal cycle of average rainfall intensity is shown in Figure 3. The stations recorded average intensity values ranging from 0.34 to 1.13 mm h-1. An unimodal diurnal cycle characterizes local precipitation, with one precipitation maximum at 14:00 LST at UE, 15:00 LST at ME, and 16:00 LST at LE; a minimum of precipitation occurs at 06:00 LST in every site. Most of the rainfall intensity occurs between 12:00 and 17:00 LST and is mainly explained by the formation of local thermally-driven convection in the noon and afternoon, related to the effect of solar insolation received by high terrain (Bendix et al., 2006b, 2009; Houze, 2012).
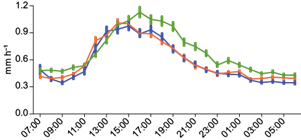
Fig. 3 Long-term mean (2013-2023) diurnal cycle of rainfall intensity from rain gauges at UE (orange), ME (blue), and LE (green) in local time (UTC-5). Error bars represent the standard error of the mean.
On the other hand, the distribution of precipitation in the study area is determined by the thermodynamics of air rising over the mountain slopes, influenced by the saturation vapor pressure of the atmosphere that decreases exponentially with temperature. The most intense afternoon and evening precipitation is generated at lower levels (Barros and Lang, 2003; Barstad and Smith, 2005; Houze, 2012). Consequently, total precipitation is also higher at LE, relative to UE and ME.
Figure 4 shows the dynamics of the diurnal cycle of hourly rainfall throughout the year as a percentage of total daily rainfall. Several features can be noted along the gradient: (a) the existence of an afternoon-evening maximum of thermal convection for each position, 14:00 for UE, 15:00 for ME and 16:00 for LE, that markedly enhanced shortly after the equinoxes in March and October; (b) in the less wet season JJA, the precipitation occurs rather uniformly throughout the day at all stations, with small peaks from 06:00 to 08:00 LST, 14:00 to 17:00 LST, and around 00:00 LST in August; (c) the wet season in MAM is characterized by rainfall of lower intensity and longer duration, with a maximum percentage of daily precipitation in March for UE and ME, and April for LE, and (d) from October to January it is characterized by rainfall of higher intensity and shorter duration, with a maximum percentage of daily precipitation in October and November for UE and ME, and December for LE.
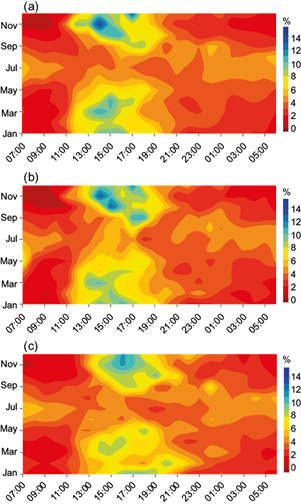
Fig. 4 Average diurnal cycle of hourly rainfall through the annual cycle as a percent of total daily rainfall at the UE (a), ME (b), and LE (c) weather stations in LT (UTC-5).
The observed patterns are consistent with previous studies in the tropical Andes and other mountainous regions, highlighting the importance of topography, solar heating, and large-scale atmospheric circulation in shaping the diurnal and seasonal precipitation variability. For example, Houze et al. (2015) reviewed the influence of orography on precipitation processes, emphasizing the role of daytime heating in triggering convection, and Trachte et al. (2010) and Zuluaga and Houze (2015) investigated the interaction between large-scale systems and local convection in the Andes, demonstrating the seasonal modulation of precipitation patterns.
3.2 Incident solar radiation
Figure 5 shows the mean daily incident solar radiation per month. Near the equator, the sun shines almost uniformly for 12 h per day year-around. Extraterrestrial radiation (Ra) presents a distinct annual cycle, with higher incidence around the equinoxes (March and October) and lower incidence in the austral winter (June to September), so a uniform annual cycle in solar radiation measured at the surface is expected (Emck, 2007; Córdova et al., 2015). However, SR is relatively constant throughout the year at UE and ME because of the compensating effect of the lack of cloud cover during the austral winter when Ra is low, unlike LE, which presents greater variability due to the presence of cloud cover in this period. Thus, the records of total daily radiation in the study area were higher during November (ranging between 142.3 to 159.9 W m-2) and lower in July (ranging between 89.1 to 130.9 W m-2), with a variation in the temporal pattern throughout the year between sites.
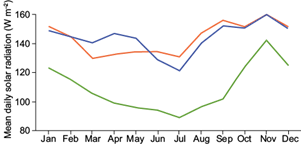
Fig. 5 Annual cycle of mean daily incident solar radiation at the UE (orange), ME (blue), and LE (green) weather stations.
In particular, in November, the SR reached its maximum values at every site due to the almost perpendicular incidence of irradiance at the equinox and the greater probability of the daily cycle of incident solar radiation, as shown in Figure 6. A well-defined diurnal cycle is observed over the study area, and the SR peak is at 11:00 at the lowest elevations. The values range between 363.8 to 465.4 W m-2 at LE and ME, respectively. On the contrary, there is a temporal difference of one 1 h between the maximums observed at ME and LE with respect to UE, which recorded the SR peak at 10:00 LST. According to Brauman et al. (2010), rainfall clouds block solar radiation; therefore, cloudiness and precipitation are determining factors in the dynamics of maximum SR along the gradient. The presence of rainfall clouds, influenced by the saturation vapor pressure of the atmosphere that exponentially decreases with height, generates cloud cover resulting from upward air motion and microphysical growth (a process by which water particles in clouds grow through condensation and coalescence, forming larger raindrops). This cloud cover is denser at lower levels (Houze, 2012). In our study area, the cloud cover percentage is 75.8% of days (Montenegro-Díaz et al., 2023), and there is a greater contribution of precipitation during daytime hours. Consequently, an increase in rainfall clouds is likely to occur in ME and LE during the hour of maximum SR recorded in UE.
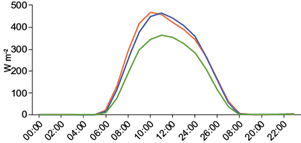
Fig. 6 Daily cycle of mean incident solar radiation at the UE (orange), ME (blue), and LE (green) weather stations in LT (UTC-5).
In general, the incident solar radiation increases with altitude, and values greater than zero are recorded from 05:00 to 19:00 LT.
3.3 Air temperature
Figure 7 and Table II show each station’s monthly mean, absolute maximum, and absolute minimum daily air temperature. High Andean locations typically experience relatively little temperature changes through the course of the year (Hardy et al., 1998; Córdova et al., 2016); as a result, in our study area, seasonal differences of monthly mean temperature varied from 4.0 to 6.1 ºC at UE, 5.5 to 7.4 ºC at ME, and 7.5 to 9.5 ºC at LE. Temperatures followed the annual cycle of angle solar radiation; the more direct sunlight near the austral summer (December to March) produced more heating than the more slanted rays of the austral winter (June to September), with a mean maximum temperature in November (highest SR) of 12.4 ºC at UE, 13.2 ºC at ME, and 16.0 ºC at LE, and a mean minimum in August (less SR) of 1.1 ºC at UE, 1.5 ºC at ME, and 3.7 ºC at LE. The differences in the intensity of solar radiation between the austral summer and winter is primarily due to the tilt of the Earth’s axis in relation to its orbit around the sun.
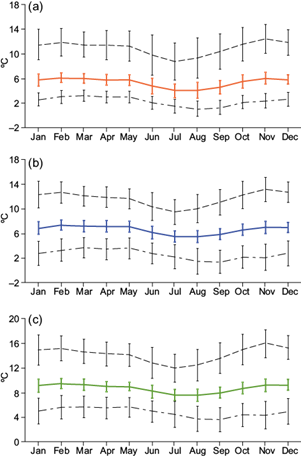
Fig. 7 Seasonal variation of the mean minimum (dot-dash curve), mean (solid curve), and mean maximum (long dash curve) air temperatures at the UE (a), ME (b), and LE (c) weather stations. Error bars represent the standard deviation of the mean.
Table II Means and extreme hourly values of air temperature at the study area.
| Automatic weather station | Absolute minimum (ºC) | Mean minimum (ºC) | Mean (ºC) | Mean maximum (ºC) | Absolute maximum (ºC) |
| UE | -3.2 | 2.4 | 5.4 | 11.0 | 17.2 |
| ME | -4.2 | 2.8 | 6.6 | 11.6 | 17.9 |
| LE | -2.9 | 4.8 | 8.7 | 14.2 | 21.0 |
UE: Toreadora (upper elevation); ME: La Virgen (middle elevation); LE: Chirimachay (lower elevation).
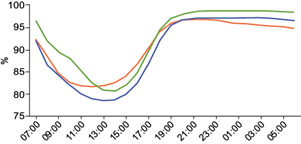
The daily cycle of air temperature for each station is shown in Figure 8. During daytime, solar radiation passes through the atmosphere, is received on the ground and is converted to sensible heat flux, which increases the air temperature adjacent to the surface, leading to the development of the convective boundary layer (Whiteman, 2001; Yang and Slingo, 2001; Seo and Dirmeyer, 2022). Thus, temperature reaches its maximum between 12:00 and 13:00 LT at UE (8.30 ºC), 13:00 LST at ME (9.85 ºC), and 14:00 LST at LE (12.27 ºC). On the other hand, temperatures are lowest from 04:00 to 06:00 LT in every site.
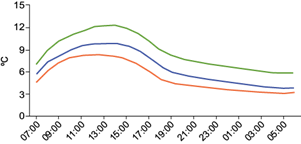
Fig. 8 Daily cycle of mean air temperature at the UE (orange), ME (blue), and LE (green) weather stations in LT (UTC-5).
Daytime temperatures become lower with increasing elevation, as the summed hour-degrees (07:00-18:00 LST) yield values of 84.59 at UE compared to 102.24 and 127.09 at the middle and lower elevations, respectively. Furthermore, air temperature increases after 05:00 LST due to increasing solar irradiance in the study area.
3.4 Relative humidity
The humidity of the atmosphere in the study area varies and remains relatively high throughout the year, as evidenced in the monthly mean values of RH in Figure 9 and the three-site mean of daily minimums at 90% (Table III). High humidity during the MAM season is mainly associated with continental air masses (moisture-laden) from the eastern side (Amazon), resulting from the meridional oscillation of the ITCZ (Bendix et al., 2006a; Emck, 2007; Campozano et al., 2016). Through the drier months of August-September, the mean RH is greater than 88% and remains high due to easterly winds that influence the study area throughout the year (Campozano et al., 2016). Regarding the seasonal variation along the gradient, November is characterized by a less humid atmosphere at all sites due to a seasonal decrease in cloudiness (Montenegro-Díaz et al., 2023).
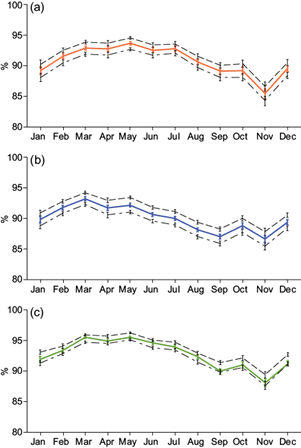
Fig. 9 Seasonal variation of the absolute daily minimum (dot-dash curve), mean daily (solid curve), and the absolute daily maximum (long dash curve) relative humidity at the UE (a), ME (b), and LE (c) weather stations. Error bars represent the standard error of the mean.
Table III Means and extreme hourly values of relative humidity at the study area.
| Automatic weather station | Absolute minimum (ºC) | Mean minimum (ºC) | Mean ºC) | Mean maximum (ºC) | Absolute maximum (ºC) |
| UE | 15.9 | 89.8 | 90.8 | 91.8 | 100.00 |
| ME | 34.5 | 88.9 | 89.9 | 91.1 | 100.00 |
| LE | 37.1 | 92.1 | 93.2 | 93.5 | 100.00 |
UE: Toreadora (upper elevation); ME: La Virgen (middle elevation); LE: Chirimachay (lower elevation).
The daily cycle of RH for each station is shown in Figure 10. In the study area, RH reaches its maximum value at night and before sunrise (when the air temperature is the lowest) and its minimum value around noon (when the air temperature is the highest, i.e., the diurnal cycle of RH is inversely related to temperature). Moreover, the increase in atmospheric relative humidity from noon onwards contributes to the afternoon-evening maximum in the frequency of occurrence of stratiform precipitation (such as drizzle and non-showery precipitation) (Dai, 2001; Whiteman, 2001). In general, there is a diurnal variation of RH at every site, which is explained by the fact that the saturation water vapor content that air can hold depends on air temperature (and hence on elevation) while actual water vapor content does not, which is evident in the night hours, when the air temperature drops and remain relative steady (Fig. 8).
3.4 Wind speed and direction
To analyze the variability of wind throughout the year in the study area, the mean annual cycle of wind speed and the prevailing wind direction as a percentage of the number of hours occurring each month are shown in Figures 11 and 12, respectively. In mountainous terrain, wind speed and direction are a combination of synoptic and valley-scale circulation (Whiteman, 2001); furthermore, the wind regime is one of the decisive factors affecting the transport of moisture, formation of clouds, and occurrence of precipitation (Singh et al., 2007). The results show a marked variability in the annual wind speed cycle, especially at the highest elevation site, which is mainly explained by the northward shift of the ITCZ from April to July. The strong trade winds increase the WS, which in turn increases the advection of moisture during this season (Emck, 2007; Campozano et al., 2016; Wodzicki and Rapp, 2016).
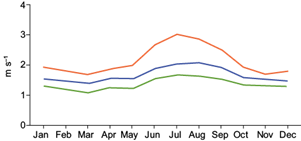
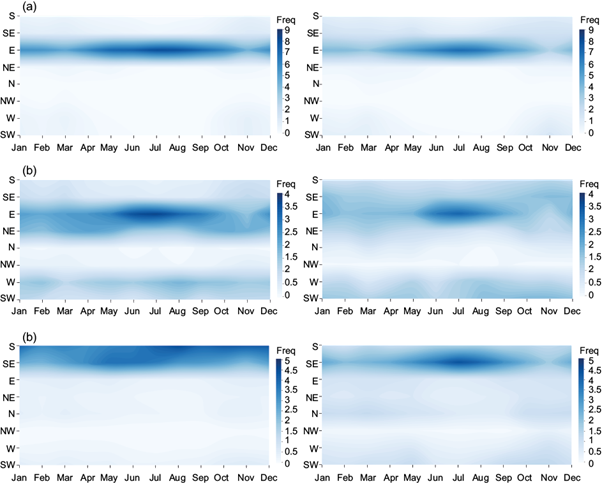
Fig. 12 Change in the prevailing wind direction through the course of the year (relative frequency). Wind direction observations are made during the day (05:00 to 19:00 LST) (left) and night (19:00 to 05:00 LST) (right) at the UE (a), ME (b), and LE (c) weather stations. The relative frequency scale (right-hand y-axis) varies across the three sets of plots.
The highest mean monthly wind speed recorded was 3.0 m s-1 in July at UE, and mean monthly wind speeds rose above 2.0 and 1.6 m s-1 between July and August at ME and LE, respectively.
Figure 12 shows the wind direction measured at the surface in each station. Wind blows predominantly from the east at UE and ME and most frequently between April-October and June-August, respectively. On the contrary, the wind direction at LE is mainly from the southeast because the airflow at the station is influenced by the high-altitude mountains in the southwest and northeast directions, which causes a forced channeling of synoptic-scale winds (east) (Fig. 12c). Furthermore, from the evening transition period to the morning transition period (Fig. 12b, c), the southwesterly wind direction is observed more and less frequently in ME and LE, respectively. This suggests that katabatic winds of nearby mountains in the southwesterly direction influence the stations, i.e., nocturnal radiation brings a cooling of the mountain slopes, resulting in cooler air blowing down the valley in this direction (Whiteman, 2001; Singh et al., 2007; Shea et al., 2015). From these results, we can state that the observed patterns reflect the effect of a combination of synoptic and valley-scale circulations in the study area.
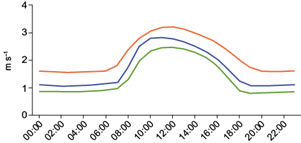
Fig. 13 Daily cycle of mean wind speed at the UE (orange), ME (blue), and LE (green) weather stations in LST (UTC-5).
During the daytime, currents rise from the valley floor, sidewalls, and ridge tops and form a deep maximum convective boundary layer that, as mixing occurs within it, produces fairly uniform wind speed throughout the layer and usually peaks around noon (Whiteman, 2001). Thus, the daily cycle of wind speed in our study area shows that stronger winds blow during the daytime, being at a maximum of 3.2 m s-1 at 12:00 LST in UE, 2.8 m s-1 at 11:00 LST in ME, and 2.5 m s-1 at 12:00 LST in LE (Fig. 13). In general, wind speed increases with altitude and during the morning transition period that begins shortly after sunrise (05:00 LST).
4. Conclusions
Meteorological stations located in the Macizo del Cajas play a fundamental role in observing and studying the characteristics of the high-elevation tropical humid climate. They provide a unique set of high-temporal-resolution meteorological data that allows for capturing short-term fluctuations in the main meteorological variables. These are influenced by several factors, such as the time of day, season, topography, and the occurrence of clouds or wind, and can significantly impact atmospheric processes, biodiversity, and water management (Shahgedanova et al., 2021). It is important to note that these changes could go unnoticed without high-resolution records. In addition, the location of the three AWS at different altitudes allowed for capturing differences in diurnal to seasonal meteorological cycles along an equatorial gradient of the Andes. Among these three Macizo del Cajas sites, some differences in the patterns and cycles of measured meteorological variables are as follows:
Precipitation tends to be higher in LE than in UE and ME because the amount of moisture available for cloud formation and precipitation is greater at lower elevations. Due to favorable conditions such as topography, orography, and wind patterns, UE generates more total precipitation than ME. The high-altitude Andes mountains at UE intercept moisture-laden easterly winds from the Amazon basin, enhancing cloud formation and precipitation through orographic lifting.
The amount of solar radiation that reaches the Earth’s surface varies partially as a function of altitude. In general, incident solar radiation is higher in UE and ME because the atmosphere is thinner at high altitudes and has less cloud cover, allowing more solar radiation to reach the surface. Conversely, as altitude decreases, the amount of received solar radiation decreases due to the greater presence of clouds and the lower intensity of sunlight.
Air temperature is higher in LE compared to UE and ME due to the greater presence of clouds affected by the atmospheric saturation vapor pressure, which decreases exponentially with altitude. Consequently, at night, the presence of clouds contributes to an increase in surface air temperature due to the greenhouse effect they create by reflecting and emitting part of the longwave radiation back to the Earth’s surface. On the other hand, during the day, as air ascends the mountain slopes, it cools adiabatically, which can locally increase RH due to the decreased capacity of the air to retain water vapor at lower temperatures. Nevertheless, the air tends to have a lower absolute amount of water vapor at higher altitudes due to the reduction in atmospheric pressure. Additionally, the lower air density at higher altitudes contributes to a reduced capacity to absorb solar radiation, which also results in a decrease in surface air temperature.
RH remains high at all sites but is higher in LE and decreases slightly as altitude increases. This is because the amount of saturation vapor that the air can hold decreases as the air temperature decreases with altitude.
Topography significantly influences wind speed and direction along the elevational gradient. Particularly, in UE, the winds are stronger due to the greater influence of the free atmosphere, whose movement is barely affected by friction with the site’s orography. Wind circulation in the study area is a determining factor in the dynamics of the climate, affecting moisture transport, cloud formation, and precipitation occurrence.
It is recommended that future researchers delve into the effects of identified meteorological patterns on key ecological processes, such as biodiversity dynamics, distribution of endemic species, and the evolution of páramo ecosystems. Additionally, it is necessary to assess how these patterns impact local socioeconomic activities, including agriculture, water resource management, and tourism. Moreover, findings can be applied to improve weather forecasting, optimize agricultural practices, and guide conservation strategies. These studies and applications are vital for developing adaptive measures to climate change and ensuring the sustainable management of natural resources of the region.

