nueva página del texto (beta)
 Inglés (pdf)
 Artículo en XML
 Referencias del artículo
 Enviar artículo por email
 Citado por SciELO
  Similares en
SciELO
Similares en
SciELO 
 Permalink
1. Introduction
Precipitation is the most closely monitored component of the water cycle because of its relevance for agriculture (Ramírez-Villegas and Challinor, 2012), water availability (Guo et al., 2004), and catastrophic hydrometeorological events (Furl et al., 2018). As water evaporates, it separates from the dissolved components and eventually condenses as aerosol particles present in the atmosphere to form liquid droplets, which might precipitate if they reach a size of ca. 1.0 mm (CONAGUA 2003). Precipitation comprises all the water released from the atmosphere, of which rain is the component that reaches the earth’s surface; it is measured as the total amount of precipitation received and accounted for in a device, commonly a rain gauge (Davie, 2008). Rainwater is considered a weakly acidic, dilute solution (Hiscock, 2005); it may be a source of calcium, potassium, ammonium, nitrate, chloride, sodium, magnesium, and sulfates from terrestrial or marine origin; such components (in addition to other insoluble particles and gases) precipitate with rain (Hiscock, 2005). Heavy rainfall events have been associated with pollutants and particle washout; for its part, long-duration low-intensity rain might remove fine particles (Oduber et al., 2020). Although aerosol particles are essential for cloud formation and, hence, precipitation development, they can be removed from the atmosphere by wet deposition (below-cloud scavenging). This removal is more efficient for ultrafine and coarse particles and is strongly linked to droplet size and the environment’s relative humidity (Ladino et al., 2011).
Some of the most important changes in rainwater chemistry are associated with dust blow, natural biomass burning fires, and anthropogenic pollution. For instance, Oduber et al. (2020) observed that wildfires acidified precipitations, whereas Saharan dust has been associated with high Si, Al, and Ca values. Zhang et al. (2007) attributed the dominance of sulfate, ammonium, and nitrate to contamination from human activities. Due to its acidic nature, rainwater enhances dissolution and influences cave formation (Beddows, 2004); owing to this, it is important to have a thorough knowledge of the water chemistry to understand the initial part of the autogenic recharge process in karstic aquifers, as it is in the case of the Yucatan peninsula. In Mexico, several studies have assessed rainfall chemistry. Báez et al. (1997, 2007) and Pérez-Suárez et al. (2006) obtained the chemical composition (nutrients and major elements) of rain samples in Mexico’s central plateau (2600 masl) while exploring the spatial and temporal variation of wet deposits in the metropolitan zone of Mexico City. They found that a large part of the whole of nitrate, ammonium, and sulfate has an urban origin and that rain is important because it dilutes the ionic concentration and also enters pollutants into forest ecosystems. Ramírez et al. (2010) described the chemical composition of rainwater in the largest city in northeastern Mexico (i.e., Monterrey, 500 masl) and found a strong anthropogenic influence from quarry hills and factories, both sources of atmospheric pollution. Bravo et al. (2000) and Cerón et al. (2002) studied the chemical composition of rain on the Caribbean coast in Puerto Morelos (Quintana Roo), 40 km south of Cancún. Not only did the studies above find clear influence from marine aerosols, but also enrichment from crustal and anthropogenic sources, particularly sulfates and nitrates, attributed to atmospheric contamination from Caribbean islands or biomass burning. Despite previous research works in Mexico that have reported on rainfall chemistry, there is still a void regarding rainwater monitoring stations in this area of the world, which would assist in identifying regional and local meteorological phenomena. We aim to contribute with knowledge that helps answer the question regarding the origin of ions and their relationship with isotopic patterns and the origin of rainwater’s moisture, which may also be useful in groundwater recharge estimates, understanding dust nuisances, and providing information on water quality for rainwater harvesting. In this paper, we describe the chemical composition in terms of the major ions and the isotopic composition of rainwater in the Caribbean coastal zone of Mexico. Moreover, the most probable sources were identified by analyzing the chemical composition and source of air parcels considering the three main seasons in this area.
2. Materials and methods
The rainwater sampling took place once a month: for the chemical analyses from November 2018 to December 2019 and for the stable isotope analyses between November 2018 and February 2021. Four locations were chosen for the present study, all in the State of Quintana Roo, no further than 20 km from the coastline of the Mexican Caribbean (Table I). The sampling protocol was performed as described in Cejudo et al. (2022): rainwater from events longer than 20 min (≈ 20 mL) was collected and then transferred into a 4-L plastic container that stored all the water, which represented the accumulated monthly precipitation in composed samples. Finally, 30 mL sub-samples were transferred to high-density polyethylene bottles (HDPE) for later analyses at the University of Waterloo-Environmental Isotope Laboratory (UW-EIL).
Table I Seasonal precipitation variability in the study area.
| Rainy season | Cold-front season | Dry season | |
| Days | ≈150 | ≈120 | ≈90 |
| Mean ± SD | 181 ± 18 | 61 ± 30 | 64 ± 45 |
| Annual rain (%) | 67 | 18 | 14 |
| Daily rain (mm) | 6 | 2 | 2 |
SD: standard deviation.
2.1 Meteorological data
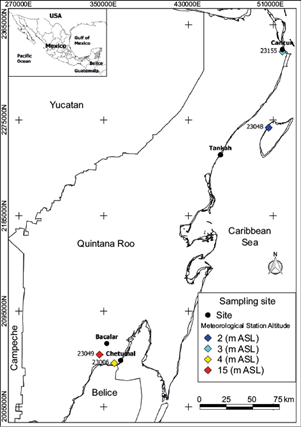
Data on monthly accumulated precipitation were retrieved from the historical database of the Sistema de Información Hidrológica (Hydrological Information System; SIH) of Mexico (SIH, 2023). The data were related to four stations, those closest to the sampling sites (Fig. 1), from November 2018 to March 2021. For characterizing seasonal trends, we defined three seasons based on historical data (1951-2010), as shown in Table I; thereby, the following were proposed: rainy (June to October, ≈ 900 mm precipitation), cold-front (November to February, ≈ 250 mm precipitation), and dry (March to May, <200 mm precipitation).
2.2 Hydrochemistry
The chemical composition of rainwater is represented by the major ions (i.e., sodium, magnesium, potassium, calcium, nitrite, nitrate, sulfate, phosphate, and chloride) measured with an 882 Compact IC Plus ion chromatograph (Metrohm) with a conductivity detector. The samples were stored at room temperature for up to three months, then filtered and analyzed. The anions were quantified under the following conditions: Metrosep A4 250/4 column with a pre-column Metrosep R2 Guard 3.5, mobile phase 12.6 mM Na2CO3/11.9 mM NaHCO3. For their part, conditions for cations were Metrosep C4 250/4 column with a pre-column Metrosep R2 Guard 3.5, mobile phase nitric acid 2.7 mM, and dipicolinic acid. Each sample was analyzed twice with the detection limit of 0.01 mg L-1.
The data normality was evaluated with a Shapiro-Wilk test. Samples that did not have a normal distribution were analyzed with a Kruskal-Wallis test. The rainwater results were analyzed using the volume-weighted mean (VWM) in microequivalents (µeq L-1). The VWM of the various species present in the rainwater samples were calculated using Eq. (1):
where C i is the concentration of any given ion (µeq L -1 ) and P i is the precipitation for the event (mm). For our purposes, each precipitation event comprises the total monthly precipitation, as all analyses were completed in composed water samples accumulated by month, i.e., all the rain events that occur in one calendar month. It is important to note that for the Bacalar sampling site, the chemistry data were only available for five months (i.e., from July to November 2019).
A Pearson correlation was completed for the measured ions. The ion ratio SO4 2-+NO3 -/ Ca2++Mg2+ was used for assessing the acidity source, where values lower than one (< 1) represent the dominance of alkali ions, and values greater than one (>1) suggest acidic dominance. The NO3 -+Cl-/SO4 2- ratio relates to the contribution of either acidic source (nitric or sulfuric); values <1 suggest sulfuric acid-derived acidity, while >1 indicate nitric acid-derived acidity (Salve et al. 2008). The neutralization factor per cation (NF x ) was calculated using Eq. (2) following Oduber et al. (2020):
where C x is the concentration of each cation, and CSO 4 2- and CNO 3 - are the sulfate and nitrate concentrations (µeq L-1), respectively. We also calculated the ratios between the concentration of elements in the sample (Cx/C r sample ) with C x for all elements calculated and C r as the concentration of the reference element. To distinguish the source or origin of the elements in precipitation, we used two sets of calculations; the first ones are seawater (Eq. [3]) and crust (Eq. [4]) enrichment factors (EF), as follows:
The enrichment factors evaluate the same elements in crust (C x /C r crust ) and seawater (C x /C r sea water ) relative to the reference concentrations in each of these reservoirs. Conventionally, Na is the reference element for seawater, assuming marine origin (Sp/Na; Keene et al., 1986); whilst Ca is the lithophilic reference element for continental crust (Sp/Ca; Zhang et al., 2007). The concentrations utilized in the EF calculations above are expressed in μeq L-1.
The calculations for the contribution of the second source were performed with the sea salt fraction (%SSF, Eq. [5]) and a non-sea salt fraction (%NSSF, Eq. [6]); the former related to the percentage of seawater from sea spray, and the latter to crustal fractions (i.e., terrestrial dust; Zhang et al., 2007). The calculations were as follows:
A non-natural or anthropogenic fraction (Eq. [7]) is commonly assumed as the remnant contribution after computing seawater and crust, expressed as the difference from 100%.
Lastly, a comparison between some rainwater sampling stations worldwide was run to provide the present results with a context.
2.3 Isotopes
The δ2H δ18O isotopes were measured at the University of Waterloo Environmental Isotopes Laboratory using a Los Gatos Research (LGR) liquid water isotope analyzer (LWIA), model T-LWIA-45-EP instrument with published precisions of δ2H = ± 0.3 ‰ and δ18O = ± 0.1‰.
The d-excess parameter was obtained as a function of δ18O by finding d in a line of slope = 8 in the d-space (Gat, 2005; Eq. [8])
Negative or close to zero values for d-excess indicate a possible loss of light isotopes or fractionation of rainwater by evaporation; in this way, two rain samples with a negative value of d-excess were eliminated so that the final number of samples was 100 for subsequent analyses. We carried out a Kolmogorov-Smirnov test for normality. For normally distributed data, we used a two-way ANOVA and a Kruskal-Wallis for non-normally distributed data.
2.4 Backward air parcel trajectories
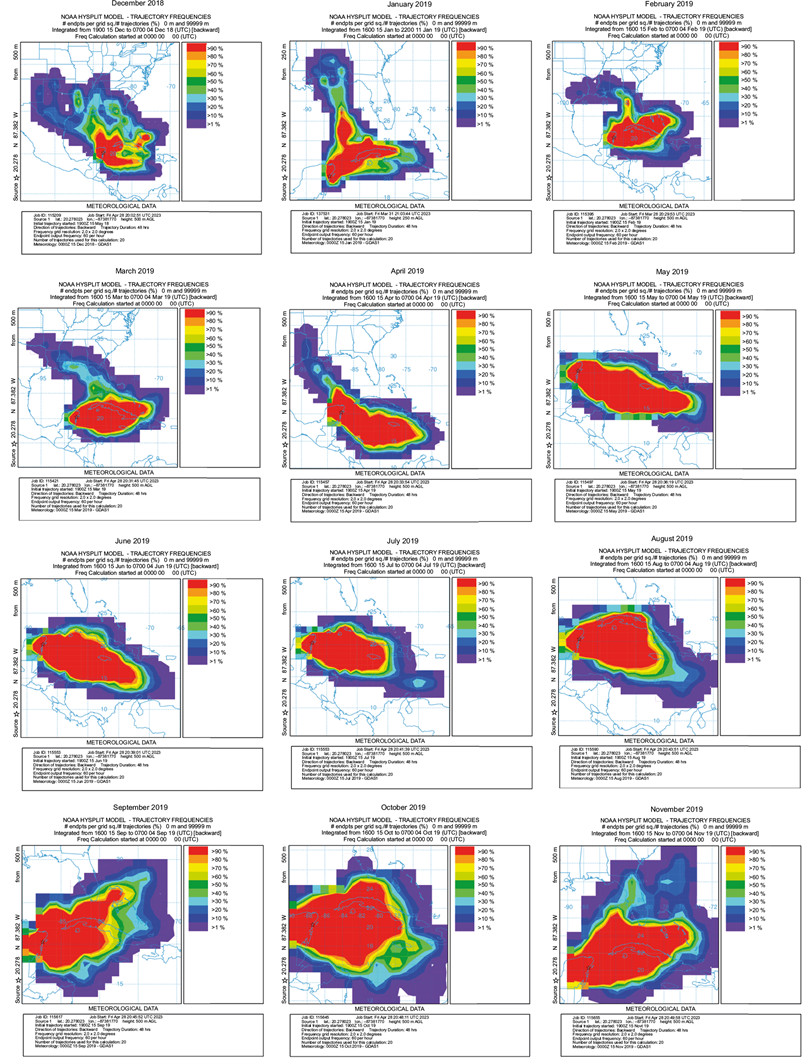
We used the Hybrid Single Particle Lagrangian Integrated Trajectory model (HYSPLIT; Stein et al., 2015) to obtain the backward trajectories of the air masses to relate moisture sources with the chemical and isotopic composition of the rainwater samples (Burnett et al., 2004). For the present study, and based on our season’s classification, we selected September, January, and May as representative months for each season (i.e., rainy, cold-front, and dry season, respectively) to explain the trajectory models. We used the trajectory ensemble mode with a 144-h time window between the days 10 to 15 of each of the selected months (mid-month) at three altitudes (250, 500, and 1000 m above the ground), assuming that the cloud base level in the Yucatan peninsula is around 1000 m (Nuijens et al., 2014; NOAA, 2024). The endpoint of the trajectories corresponds to each sampling location. The seasonal differences in rainwater chemistry, stable isotopes, as well as air parcels were explored based on the year division shown in Table I.
3. Results and discussion
3.1 Hydrochemistry
From the chemical analysis, we found that nitrites (NO2 -) and phosphates (PO4 3-) were always below the detection limit (< 0.01 mg L-1) in all four sites and that magnesium (Mg2+) was also below such limit in Cancún. Figure 2 shows the results of ion concentrations by sampling site and climatic season; the complete dataset is presented in Table SI in the supplementary material. The anion deficiency associated with the exclusion of HCO3 - does not seem very relevant (cations vs. anions correlation coefficient, R2= 0.9508) and might not have had a significant contribution (Keresztesi et al., 2019).
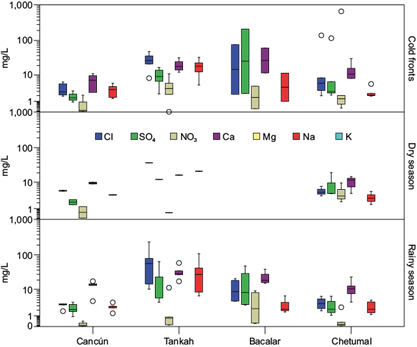
Fig. 2 Box plot of ion concentrations (mg L-1) at each sampling site. Missing values were below the detection limit (< 0.01 mg L-1). Chemical species appear without charge. The Shapiro-Wilk normality test indicated that none of the ions had a normal distribution (p < 0.001); therefore, the Kruskal-Wallis test showed that data from November 2018 to December 2019 was different by site, not by season, as shown in Table II.
Table II Summary of Kruskal-Wallis test analyses.
| Site | ||||||
| Cl- | SO4 2- | Ca2+ | Mg2+ | Na+ | K+ | |
| χ2 | 22.33 | 19.74 | 20.52 | 26.81 | 23.11 | 19.44 |
| df | 3 | 3 | 3 | 3 | 3 | 3 |
| p | 0.0001 | 0.0002 | 0.0001 | 0.00001 | 0.00004 | 0.0002 |
| Season | ||||||
| χ2 | 0.4 | 0.52 | 3.66 | 0.81 | 0.47 | 0.82 |
| df | 2 | 2 | 2 | 2 | 2 | 2 |
| p | 0.82 | 0.77 | 0.16 | 0.67 | 0.79 | 0.66 |
Numbers in bold indicate a statistical difference (α = 0.05).
The calculated VWM values are shown in Table III. According to these concentrations, the anions in Cancún, Tankah, and Chetumal have the following trend: Cl- > SO4 2- > NO3 -; whereas in Bacalar, chloride, and sulfate switch order (SO4 2- > Cl- > NO3 -). For cations, Tankah and Chetumal have the trend Ca2+ > Na+ > Mg2+ > K+, Cancún Ca2+ > Na+ > K+ > Mg2+, and Bacalar Ca2+ > Mg2+ > Na+ > K+. In all cases, Ca2+ was the predominant cation. Given that soil dust contains calcite minerals from calcium carbonates present in the soil of the region (Bravo et al., 2000), our results reflect the presence of calcium-rich dust in the Yucatan peninsula’s atmosphere (Báez et al., 1997; Galloway and Lickens, 1978). Since the calculation of the ion ratio SO4 2- + NO3 -/Ca2+ + Mg2+ was found to be < 1, it points to alkali dominance (from calcium and magnesium). Despite the alkaline dominance, the small acidity present in the rainwater samples showed dominance from nitric acid (NO3 - + Cl-/SO4 2- > 1); only Bacalar has sulfuric acid-dominant acidity (Table III).
Table III Volume-weighted mean (meq) measured in rainwater in the coastal zone of Quintana Roo, Mexico.
| VWM (meq) | SO4 2- | Cl- | NO3 - | HCO3 - | Ca2+ | Mg2+ | Na+ | K+ | SO4 2-+NO3 -/ Ca2++Mg2+ | NO3 -+Cl-/ SO4 2- |
| Cancún | 0.037 | 0.098 | 0.006 | 0.335 | 0.362 | 0.000 | 0.107 | 0.010 | 0.053 | 2.684 |
| Bacalar | 0.409 | 0.300 | 0.060 | 0.800 | 1.188 | 0.187 | 0.135 | 0.134 | 0.647 | 0.795 |
| Tankah | 0.224 | 0.941 | 0.039 | 1.086 | 1.105 | 0.322 | 0.818 | 0.082 | 0.582 | 4.246 |
| Chetumal | 0.067 | 0.112 | 0.020 | 0.522 | 0.517 | 0.060 | 0.126 | 0.022 | 0.165 | 1.683 |
The correlation coefficients shown in Table IV suggest that potassium might originate from both sea spray and anthropogenic emissions such as biomass burning (Oduber et al., 2020; Raga et al., 2021). Even though potassium feldspars are present in the carbonaceous shale of this area (Lefticariu et al., 2006), we consider this to be the lesser contribution as it is mainly buried below the actual surface level. Calcium is considered to come from two sources: seawater (the least) and crustal inputs such as soil dust (Bravo et al., 2000); however, calcium can also be incorporated into the atmosphere via fertilizers (Zeng et al., 2020), supported by its correlation with NO3 - (r = 0.954) and sulfates (r = 0.928). The correlation coefficient between SO4 2- and NO3 - (r = 0.98) suggests a common anthropogenic source due to SO2 and NOX in the atmosphere (Zhang et al., 2007; Oduber et al., 2020). There are other ion ratios with good correlation coefficients: Ca2+ and SO4 2-; Ca2+ and NO3 -; Mg2+ and Cl-; all of them have a common origin that exists in rainwater as a result of atmospheric chemical reactions of acids such as H2SO4, HNO3, and HCl with alkaline compounds rich in calcium and magnesium, found in the atmosphere from wind-blown dust (Chandra et al., 2005; Salve et al., 2008).
Table IV Correlation coefficients between the major ions measured in rainwater. Numbers in bold indicate a statistical difference (α=0.05)
| SO4 2+ | Cl- | NO3 - | HCO3 - | Ca2+ | Mg2+ | Na+ | K+ | |
| SO4 2+ | 1 | |||||||
| Cl- | 0.380 | 1 | ||||||
| NO3 - | 0.984 | 0.441 | 1 | |||||
| Ca2+ | 0.928 | 0.688 | 0.954 | 0.898 | 1 | |||
| Mg2+ | 0.652 | 0.938 | 0.717 | 0.998 | 0.887 | 1 | ||
| Na+ | 0.181 | 0.978 | 0.253 | 0.831 | 0.527 | 0.855 | 1 | |
| K+ | 0.997 | 0.453 | 0.989 | 0.726 | 0.954 | 0.711 | 0.259 | 1 |
According to the neutralization factor (NF) results (Table V), high NF values for the alkali element Ca2+ (from 2.5 to 8.5) are associated with the transport of soil dust with a large quantity of calcite and dolomite due to the calcareous soil of the study area (Peikam and Jalali, 2021).
Table V Neutralization factor calculated for calcium, magnesium, sodium, and potassium for the four sites
| NF | Ca2+ | Mg2+ | Na+ | K+ |
| Cancún | 8.510 | 0 | 2.506 | 0.235 |
| Bacalar | 2.530 | 0.398 | 0.287 | 0.285 |
| Tankah | 4.201 | 1.226 | 3.108 | 0.311 |
| Chetumal | 5.944 | 0.685 | 1.451 | 0.248 |
The enrichment factors of the rainwater samples EFcrust <1 suggest that the element is mainly from crustal origin; values >1 are associated with other sources, either seawater or anthropogenic origin. The EFseawaters for SO4 2-, Ca2+, Mg2+, and K+ were found to be >1, which indicates enrichment or impacts by sources other than marine; for example, soil or anthropogenic sources (Table VI).
Table VI Summary of the calculated enrichment factors
| SO4 2- | Cl- | NO3 - | Ca2+ | Mg2+ | Na+ | ||
| EFseawater | Cancún | 2.7 | 0.8 | 2843.3 | 77.4 | 0 | 4.3 |
| Bacalar | 24.3 | 1.9 | 22407.6 | 200.6 | 6.1 | 45.5 | |
| Tankah | 2.2 | 1 | 2403.2 | 30.8 | 1.7 | 4.6 | |
| Chetumal | 4.3 | 0.8 | 7736.3 | 93.3 | 2.1 | 7.8 | |
| EFcrustal | Cancún | 5.4 | 87 | 5.4 | 0.5 | 0 | 71.8 |
| Bacalar | 18.3 | 81.5 | 18.3 | 0.2 | 0.3 | 17.6 | |
| Tankah | 10.8 | 274.8 | 10.8 | 1.3 | 0.5 | 26.8 | |
| Chetumal | 6.9 | 70 | 6.9 | 0.4 | 0.2 | 47.5 |
The correlation between Ca and Mg (r = 0.88) indicates crustal origin. In the case of Cl- its correlations were found to be ≤ 1 in Cancún, Tankah, and Chetumal, indicating an important contribution from seawater. This last correlation is consistent with the relationship between Cl- and Na+ ions (r = 0.97), whose values are very close to those found in seawater (1.2; Möller, 1990). In sum, our results indicate that chloride, sulfate, sodium, and magnesium are mostly from the sea-salt fraction in the coastal stations (Table VII).
Table VII Sea salt (SSF) and non-sea salt fraction (NSSF) contribution.
| SO4 2- | Cl- | NO3 - | Ca2+ | Mg2+ | K+ | ||
| %SSF | Cancún | 36.53 | 126.61 | 38.34 | 1.29 | - | 23.22 |
| Bacalar | 4.12 | 52.12 | 4.86 | 0.50 | 16.37 | 2.20 | |
| Tankah | 45.68 | 100.76 | 45.36 | 3.25 | 57.56 | 21.79 | |
| Chetumal | 23.39 | 130.50 | 14.09 | 1.07 | 48.09 | 12.75 | |
| %NSSF | Cancún | 63.47 | -26.61 | 61.66 | 98.71 | - | 76.78 |
| Bacalar | 95.88 | 47.88 | 95.14 | 99.50 | 83.63 | 97.80 | |
| Tankah | 54.32 | -0.76 | 54.64 | 96.75 | 42.44 | 78.21 | |
| Chetumal | 76.61 | -30.50 | 85.91 | 98.93 | 51.91 | 87.25 |
Despite being present in other coastal locations, Mg in Cancún was always below the detection limit. This element has been considered a continental ion tracer linked with economic activities (Bravo et al., 2000). Despite having material extraction sites in the study area, the thickness of the exposed geological formations and the elevated content of calcium carbonate (Smart et al., 2006) might overshadow Mg. Accordingly, calcium is mostly of crustal origin. Potassium, nitrates, and sulfates largely have a non-natural origin (Table VIII); that is, anthropogenic activities in the Yucatan peninsula (Bravo et al., 2000; Raga et al., 2021).
Table VIII Non-natural or anthropogenic fraction
| SO4 2- | Cl- | NO3 - | Na+ | Mg2+ | K+ | |
| Cancún | 44.8 | -27.8 | 87.3 | -94.5 | - | 75.4 |
| Bacalar | 90.4 | 46.7 | 95.8 | -401.6 | -272.8 | 92.1 |
| Tankah | 45.0 | -1.1 | 93.7 | 19.9 | -149.8 | 74.5 |
| Chetumal | 62.2 | -31.9 | 94.3 | -134.1 | -434.9 | 85.1 |
Variable wet and dry deposition has been previously observed in tropical coastal environments (Palani et al., 2012), which can be attributed to meteorological factors such as extreme rain events and air and moisture parcel trajectories (Mullaugh et al., 2013). The coastal sites have chloride and sodium from the sea salt fraction, whereas sulfates, calcium, magnesium, potassium, and nitrates also have a non-sea salt origin. Similar results were reported by Cerón et al. (2002), who found potassium, calcium, and sulfate predominant from the non-sea salt fraction; these authors also stated that nitrate is strongly associated with wind direction and elevated nitrates are related to biomass burning (forest fires); however, supported on the published literature, we consider that sulfate and potassium are the ions most related to biomass burning (Oduber et al., 2020; Raga et al., 2021). Some aerosol particles, such as metals and metal oxides, as well as airborne microorganisms, pose risks to human health (Rodríguez-Gómez et al., 2020) or the environment (Rahim et al., 2019), whereas hurricanes might represent additional entrance of ions, potentially posing dangerous wet deposition into the ecosystem (Qiu and Felix, 2021).
Table IX shows the chemical composition of rainwater in some stations located in tropical and subtropical zones. Notice, on one side, the great contribution of chloride and sodium in Tankah due to the marine influence, and on the other, the unusual nitrate in Chetumal, which may come from fertilizers (Zunckel et al., 2003). Hence, we can conclude that rainwater chemistry experienced a rather local influence from sea-salt spray, land-blown dust, and anthropogenic impacts such as agriculture and biomass burning.
Table IX Comparison of the chemical composition of rainwater in selected locations (chemical species in µM).
| pH | NO3 - | Cl- | SO4 2- | NH4 + | Na+ | Mg2+ | K+ | Ca2+ | |
| Hamedan, Iran. 34º 40’ N, 48º 30’ E (Peikam and Jalali, 2021) | 6.8 | 20 | 370 | 175 | NA | 110 | 205 | 40 | 275 |
| BBSR, Bermuda. 32 º35 ‘N, 8º 25’ W | 5 | 2.9 | 88.2 | 35.8 | 8 | 58.2 | 3.1 | 2.6 | 6.9 |
| Zhejiang, China 28º 35’ N, 120º 0’ E (Zhang et al., 2007) | 4.54 | 31.2 | 8.5 | 47.6 | 81.1 | 6.27 | 1.8 | 4.7 | 23.9 |
| Monteverde, Costa Rica. 10º 18’ N, 84º 47’ W (Vásquez et al., 2012) | N.A. | 14 | 58 | 13 | 4.7 | 66 | 10 | 10 | 50.5 |
| Mexico City, Mexico. 19º 18’N, 99º 10’ W (Báez et al., 1997) | N.A. | 41.5 | N.A. | 65.5 | N.A. | N.A. | 4.8 | N.A. | 35.2 |
| Puerto Morelos, Mexico. 20º 50’ N, 86º 52’ W (Bravo et al., 2000) | 5.35 | 11.4 | 150.7 | 12.7 | 6.4 | 128 | 14.3 | 5.8 | 8.9 |
| Bacalar | 5-6 | 56.1 | 581.8 | 494.4 | N.A. | 192.6 | 252.6 | 121.4 | 680.2 |
| Cancún | 5-6 | 7 | 98.1 | 20.7 | N.A. | 131.4 | N.A. | 23.7 | 231.9 |
| Chetumal | 5-6 | 842.8 | 414.9 | 137.6 | N.A. | 119.2 | 53.3 | 21.1 | 307.6 |
| Tankah | 5-6 | 52.4 | 1401.5 | 164.7 | N.A. | 1173.2 | 232.6 | 109.5 | 629.6 |
Locations in italics show the results obtained in this research.
N.A.: not available; BBSR: Bermuda Biological Station for Research.
3.2 Isotopes
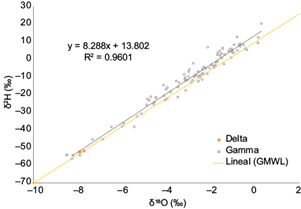
The local meteoric water line (LMWL) for the coast of Quintana Roo is shown in Figure 3. In comparison with the Global Meteoric Water Line (GMWL), its slightly higher slope (13.802) suggests a greater δ2H enrichment due to evaporative losses (Clark and Fritz, 1997; Sun et al., 2021). Not surprisingly, the LMWL showed an amount effect (Dansgaard, 1964); that is, an inverse correlation with the amount of rainfall (r = -0.48). Note that the altitude effect is not relevant because all sampling stations are at similar altitudes. We also observed that some samples (Bacalar, October 2019 and June 2020; Cancún, October 2020, Chetumal, May 2019 and June 2020; Table SII in the supplementary material) have a depleted isotopic composition, similar to the water precipitated with hurricanes Delta and Gamma, which comes to show that some monthly accumulated precipitation samples are isotopically similar to tropical storms.
The high d-intercept value indicated different moisture sources and local climatic patterns (Modon et al., 2022). Some of the most depleted values correspond to hurricanes Delta and Zeta (-8‰ in δ18O), which were reported as category 2 hurricanes (Sánchez-Murillo et al., 2019). The other main source of moisture comes from North America during the cold-front season (see section 3.3). The local climatic patterns are likely related to convective rains and mixing between two or more air parcels. In coastal locations, convective rains are generally formed from vertically moved ocean-evaporated moisture with high δ18O (relative to its correspondent δ2H) and have been associated with specific microphysical conditions of rain formation (Aggarwal et al., 2016). The mixing between two or more air parcels does not fit the conventional Rayleigh distillation curve; because of this, the resulting isotopic ratios in tropical and subtropical air parcels are not easily distinguished (Galewsky and Hurley, 2010).
The slope value of the LMWL is slightly greater than those reported for the Cholulteca River basin in Honduras (García-Santos et al., 2022) and the Limbang River basin in Borneo (Modon et al., 2022), which indicates that moisture-generating rain in this area of the world is not formed in equilibrium conditions. The moisture originates in the Caribbean Sea and the Gulf of Mexico with no apparent inputs from the Pacific.
The isotopic composition of each sampling location is shown in Table X. The Kolmogorov-Smirnov test for normality showed that the isotopic composition of the analyzed rainwater samples did not have a normal distribution (p < 0.001), whereas d-excess distribution was normal (K - S = 0.067; p = 0.2). The Kruskal-Wallis test for δ2H and δ18O reported that the isotope composition was not different by site (δ18O ‰ p = 0.277 and δ2H ‰ p = 0.425) though it was different by season though (δ18O ‰ p = 0.012 and δ2H ‰ p = 0.0003), a result opposed to that of the water chemistry, which was different by site, but not by season. This difference is because water chemistry and isotope composition respond to different factors and effectors. Water chemistry responds to the local conditions of the air column below the cloud; thus, when precipitation falls, the aerosols and suspended particles reflect the local conditions, with a large influence of marine aerosols and natural and non-natural dust. On the other hand, the isotope composition of moisture has a lesser local influence since its origin (air parcel trajectory) and the physical condition in which water evaporates and condenses are the most relevant factors for variable isotope composition through the seasons.
Table X Rainwater isotope composition in each sampling location.
| Site | Parameter | δ18O ‰ | δ2H ‰ | d-excess |
| Cancún | Mean | -2.76 | -7.99 | 13.7 |
| Min-Max | -4.8, -1.02 | -25.7, 4.8 | 9.6, 19.5 | |
| Tankah | Mean | -1.69 | -1.24 | 12.4 |
| Min-Max | -4.4, 0.12 | -21.4, 9.4 | 6.7, 24.1 | |
| Bacalar | Mean | -3.48 | -16.31 | 12.3 |
| Min-Max | -7.3, -0.98 | -45.2, 3.8 | 5.5, 20.2 | |
| Chetumal | Mean | -3.11 | -10.44 | 13.6 |
| Min-Max | -8.2, -0.74 | -56.2, 8.4 | 8.7, 18.3 |
The d-excess results showed an average of 13.0 ± 3.2 (5.5 to 24.1), similar to other values reported in Central America (García-Santos et al., 2022). The two-way ANOVA for the d-excess showed differences only by season (F = 12.27, p < 0.001). The post-hoc test Tukey HSD showed that the cold-front season is different (q = 14.77, p < 0.001). When d-excess values are greater than 10‰, they represent potential re-evaporation of precipitation (Fig. 4); however, such precipitation has also been associated with rain events from cold fronts (García-Santos et al., 2022). It also shows enhanced terrestrial recycled or evaporative moisture sources with similar d-excess. Depleted precipitation due to recycled precipitation has also been reported in Nicaragua (García-Santos et al., 2022).
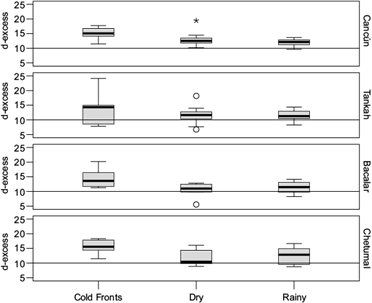
Fig. 4 Deuterium excess values (d-excess) in ‰. The horizontal line in 10 indicates the mean global d-excess value.
Differences in d-excess vary in response to the event type (frontal systems or low-pressure events) or vertical mixing in convective systems rather than seasonal temperature changes (Guan et al., 2013). The elevated d-excess measured in the present study suggests that clouds may be formed in evaporative conditions, and there is mixing of advective condensation in convective rain systems with moisture from the ocean and probably other sources. This phenomenon might be especially relevant in Bacalar, where, based on the lake’s water isotope composition, an important amount of moisture may evaporate from Bacalar Lake, condense, and precipitate again (Evans et al., 2018).
3.3 Backward air parcel trajectories
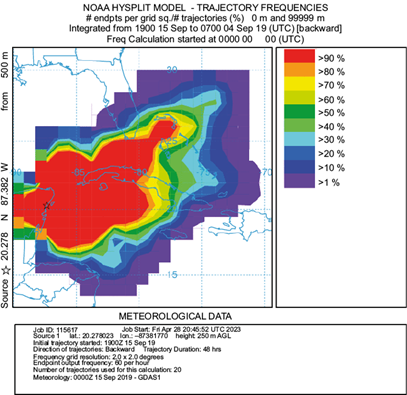
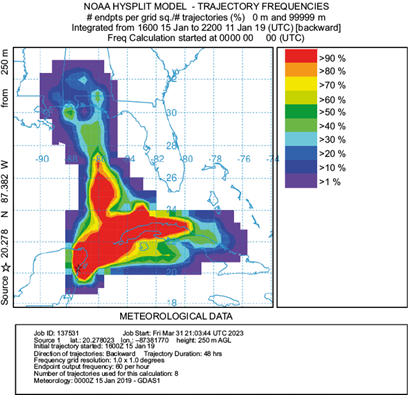
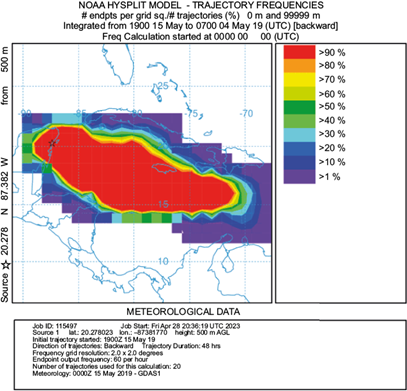
Air parcel trajectories were obtained for the entire sampling period (Fig. S1 in the supplementary material). However, in terms of seasonality, we selected for this study three months (September, January, and May) to represent each of the distinctive seasons in the Yucatan peninsula. Mid-September’s rainy season trajectory frequencies (Fig. 5) showed the dominance of east winds from the Caribbean and the mid-Atlantic, passing over Florida and Cuba. These winds probably convey moisture from the mid-Atlantic and the Caribbean into the Yucatan channel, including tropical storms and hurricanes, frequent in this season. The cold-front season trajectory frequencies are exemplified by mid-January in Figure 6, which shows the influence of both north and east winds. The former results from polar air masses moving from the Arctic through North America into the Gulf of Mexico, introducing moisture from the Midwest USA and the Gulf of Mexico into the Yucatan peninsula. This season is characterized by a slightly greater δ2H (and d-excess) than the other two seasons. Cold-front enriched rains have been previously reported by Sánchez-Murillo et al. (2019) and García-Santos et al. (2022) in the Caribbean. Finally, the dry season trajectory frequencies (mid-May, Fig. 7) depict dominance of east winds from the Caribbean again, but from the east-southeast direction, moving south of Cuba, from the Greater Antilles and the Yucatan basin. These backward air mass movement trajectories suggest that the predominant air mass that reaches the Yucatan peninsula comes from the Caribbean with contributions of terrestrial sources from the islands; consequently, the rain chemistry retains sea salt influence, while a large part of the ions in precipitation moves from the Caribbean most of the year. We acknowledge that the El Niño-Southern Oscillation (ENSO) and the Pacific Decadal Oscillation (PDO) play an important role in rainwater precipitation at a regional scale; yet, a long record is necessary to find significant changes in rainfall patterns (Díaz and Giambelluca, 2012), which is out of the scope of this research.
As previously observed in the central Mexican highlands, there is continuous and uniform air parcel movement from the Caribbean Sea (González Ríos, 2022). As there are no topographic barriers, rainfall isotopic pulses are associated with moisture origin (García-Santos et al., 2022) with no isotopic effect due to altitude. This variation in air mass movements is also responsible for variations in rain events, changes in sources of atmospheric moisture, and various evaporation effects, as shown by the isotopic composition.
In addition to the back trajectories of air parcels as tools for exploring moisture sources, atmospheric bulk deposition measurement may be assisted or accompanied by remote sensing (e.g., MODIS) or modeling atmospheric transport; these complementary methods of direct measurement can produce information regarding local or long-distance sources of minerals and contaminants (Das et al., 2013).
4. Conclusions
Chloride, sulfate, sodium, and magnesium are mostly from the sea spray, whereas calcium is mostly crustal. Potassium, nitrates, and sulfates also have a non-natural origin. The rainwater chemistry displayed a local influence from sea-salt spray, land-blown dust, and anthropogenic impacts such as agriculture and biomass burning. The isotope data point to rain not formed in equilibrium conditions, influenced by evaporative losses, different sources of moisture, and local climatic patterns. Our main finding is that water chemistry retains the influence of local conditions such as sea salt, calcium-rich dust, and burnt biomass, whereas the isotope composition showed a less important local influence. The most relevant factors for the observed isotope composition are moisture origin and the physical condition in which water condenses and evaporates. Combined approaches such as the one presented here, with rain chemistry and back trajectories, are of great assistance for more accurate field measurements of nutrient deposition from atmospheric, land, and seaborne sources; also, they are essential supplies for climate change studies and can be useful to perform groundwater recharge estimations and water quality assessments for rainwater harvesting.