


 nueva página del texto (beta)
 Inglés (pdf)
 Artículo en XML
 Referencias del artículo
 Enviar artículo por email
 Citado por SciELO
  Similares en
SciELO
Similares en
SciELO 
 Permalink
1. Introduction
Research on living conditions and quality of life based on subjective measures has achieved popularity in economics. Once neglected, it has proven an interesting and solid line of research. From the behavioral approach to economics, subjective well-being measures bring sounder psychological grounds to individual decision-making and, from the policy-making point of view, can help in the evaluation of alternative policies (Frey and Stutzer, 2002). Interdisciplinary research on the so called “Easterlin paradox” -which shows that the increase in material living standards during the twentieth century was accompanied by fairly constant average happiness- brought new insights to economic analysis. Recent literature has shown that individuals are the best judges of their own well-being, and that subjective well-being might be an appropriate way of measuring happiness or quality of life in several aspects of an individual’s life, such as religion, marriage, sports, work and leisure (Boes and Winkelmann, 2006; Diener, Oishi and Lucas, 2003). This approach may be especially suitable to study human activities and conditions such as leisure (Ateca-Amestoy, 2011). From the economic point of view, leisure is a commodity that has to be produced and consumed at the same time by the individual. According to Becker, this time-intensive commodity has to be produced by the optimal allocation of the individual’s own resources: time, money, personal characteristics and social relations (Becker, 1965; Osberg, 2008). Measurements of well-being and quality of life are based on a multidimensional definition, which also includes leisure time indicators, such as participation in activities like sports, cultural events and recreation (Stiglitz, Sen and Fituossi, 2009).
The relation between participation in cultural activities and quality of life, either at the individual or at the societal level, has not been very much explored by cultural economics. It is through cultural policy that subjective well-being measures enter into cultural analysis. Public programs oriented towards assessment of the impact of culture in its many dimensions, such as the English CASE, have taken into consideration the beneficial aspects of cultural participation on individual well-being and on societal outcomes (DCMS, 2010).
Cross-country analysis on cultural participation poses some challenges, and this is further increased when considering that the effects of cultural participation on well-being may depend on cultural and institutional factors (Iwasaki, 2007 Schuster, 2007; Katz-Gerro, 2011). A well-studied fact is that subjective evaluation depends on contextual factors. How an individual evaluates his financial satisfaction, for instance, may well depend on his personal experience, his aspirations and his relative standing in the income distribution of some relevant peer-group. Accordingly, we should use models that account for the strong presence of unobserved heterogeneity. For some countries, there is evidence that leisure could be more oriented to the fulfillment of the need for autonomy, thus favoring solitary leisure engagement. For others, the community-belonging aspects of leisure seem more relevant, so individuals derive more enjoyment from social leisure.
In this paper, we explore the relationship between cultural engagement and quality of life at a macro level. To do so, we consider the links between more- and less-active ways of cultural participation using self-reported happiness as an indicator of quality of life. This allows us to contribute to the literature on leisure in two dimensions. First, we explicitly identify alternative cultural activities in terms of the UNESCO 2009Framework of Cultural Statistics, recognizing that the production and enjoyment of pleasant cultural experiences can take several forms, each of them involving different combinations of personal, cultural and social resources. Second, we analyze international evidence, using data from 30 countries, and account for the effect of religion and religious practices, as well as political self-adscription.
Using the data from the 2007 International Social Survey that contains a special module on leisure activities, we estimate ordered probit models to explain the correlates of happiness in 30 countries and identify the marginal effect of each cultural practice on individual well-being. We present the conceptual framework and previous findings in the next section. In section 3, we describe the data, focusing on cultural participation variables and on happiness. In section 4, we present the estimation methods. In section 5, we analyze all the results and, in section 6, we conclude.
2. Subjective well-being and cultural activities
Although microeconomic models always assume that individual well-being can be related to utility maximization, with utility determined over consumption and leisure bundles, leisure is generally absent from empirical studies of happiness (Wang and Wong, 2011). This is rather surprising, as the leisure experience appears to be a particular good candidate for studies aiming to apply happiness research to the valuation of intangibles (Ateca-Amestoy, 2011). Leisure is a complex human need that is fulfilled by the production and consumption of individually defined pleasant experiences. Our concept of leisure is an action that takes place at a given time, develops an identifiable activity and is perceived as a pleasant experience by the actor (Kelly, 1982).
Behind the relationship between well-being and leisure, two theories can be identified: psychological needs theory and activity theory (Rodriguez, Látková and Sun, 2008). Psychological needs theory is based on the fact that satisfaction of the individual’s human needs maintains or increases well-being (Diener and Lucas, 2000). Activity theory suggests that a higher degree of participation and intimacy related to the performed activity influences well-being as well (Lemon, Bengston and Peterson, 1972).
Cultural participation, which is related to an individuals well-being, is seen as a symbol of self-presentation and helps define socio-economic status. In addition to maintaining group boundaries and social inequalities, cultural preferences also define individual identities (Bordieu, 1984; Lamont and Molnar, 2001; Skeggs, 1997). Leisure activities define the aspirations of different reference groups and are, in the end, positional goods (in the sense of Veblen, 1899). Several studies have analyzed the impact that cultural and leisure activities have on the subjective well-being of different populations with the same results: culture has a relevant role in psychological well-being and/or in life satisfaction (Becchetti, Ricca and Pelloni, 2012; Frey, 2008; Grossi et al., 2010; Hampshire and Matthijsse, 2010; Merz and Scherg, 2013; Michalos, 2005; Michalos and Kahlke, 2010; Iwasaki, 2007; Borgonovi, 2004).
Cultural participation can range from museums, music, dance and literature to gardening and pottery; and relates to the consumption and production of cultural experiences by different means (UNESCO, 2009). In terms of the means for that consumption and production, researchers consider differences between attendance at live events (cinema going, performing arts, museum visits), consumption through the media (books and magazines, watching television, listening to music records, digital engagement), and active practice (singing in a choir or participating in carnivals). Although each of those means differ in the social component or their demand of a specific kind of cultural capital and skill (the one needed to enjoy a piano sonata compared to the one needed to play a piano sonata), they have in common their pleasant and discretionary nature. In particular, cultural activities are regarded as having a positive and significant impact on self-reported happiness. However, most of the evidence comes from the analysis of data at the country or regional level and, many times, from convenience sampling or research on particular groups of the population, as in some epidemiologic studies. Furthermore, many studies concentrate on one type of cultural participation, not considering the fact that many individuals engage in other cultural activities, or that the effect of different means of engagement may be different.
For example, Uhrig (2005) analyzes the effects of cinema on self-reported happiness and depression using data from the British Household Panel Survey. He finds that cinema going promotes, in general, a positive response. The result is radically different when researchers consider the most popular leisure activity in terms of spent time: watching television. Many people report a lower level of enjoyment compared with other leisure activities and admit that they watch more TV than they would consider optimal (Frey, Benesch and Stutzer, 2007). It is an easily accessible leisure alternative with low cultural, cognitive, material and social input requirements (Bruni and Stanca, 2008). Television viewing does not maximize satisfaction, according to Gui and Stanca (2010), because television viewing is an overconsumed commodity, with consumers regretting afterwards the immediate satisfaction watching television brings. This affects well-being negatively, as it does not reflect the individuals’ true preferences. Therefore, it seems that leisure activities may also have different effects depending on whether they are active or passive activities (Kahneman et al., 2006), and on the degree of social interaction or introspection.
3. Data description
The data source is the module on Leisure and Sports, carried out by the International Social Survey Program (ISSP) in 2007. The fieldwork includes the same questionnaire and methodology for 33 countries, of which 30 are considered in this paper.1 This enables us to overcome some of the problems that traditionally arise when doing cross-country comparisons on cultural participation (Schuster, 2007; O’Hagan and Castiglione, 2010; Katz-Gerro, 2011). Some of these problems are: the different goals of the studies, their different boundaries of analysis, differences in the dependent variable, the harmonization performed at the explanatory variables, and the design of the questions.
The ISSP 2007 survey asks respondents their opinions on a great variety of issues.2 For our analysis, we consider answers regarding the frequency of leisure activities in the respondents’ free time; main purpose of free time activities; enjoyment from reading books, getting together with friends, taking part in physical activities, and watching TV or DVDs. The survey also contains information on social and political participation; trust in people; interest in politics; perception of happiness; estimation of personal health, and information on a number of individual and household characteristics (age, gender, education, household income, religion and others).3
We use the variables measuring the intensity of cultural participation as explanatory variables in our study. The questions from the ISSP 2007 used in this paper allow us to distinguish three types of cultural participation. With the exception of listening to music, where no specification of the means is asked in the survey, we can match each question with a type of cultural engagement, from more introspective to more active and social. Home-based activities: i) Reading Books, ii) Watching TV, DVD, videos, iii) Listening to music; Attendance-based activities: i) Listening to music, ii) Going to movies, iii) Attending cultural events; Participation-based activities: Participating in cultural associations or groups.
The frequency of each activity takes five possible values. We rearranged the values so that higher values represent higher intensity of participation.
Our dependent variable is the happiness assessment of the individual. This corresponds to the answer to the question “How happy or unhappy do you feel, in general, these days?”. The values of this variable (also recoded in an ascending scale) are: Not at all happy, not very happy, fairly happy and very happy.
We further control for individual and household characteristics. For personal characteristics, we consider sex, age, education, marital status, labor status, political adscription, religion and religious habits, self-assessed health status. For household characteristics, we include household type and household income.
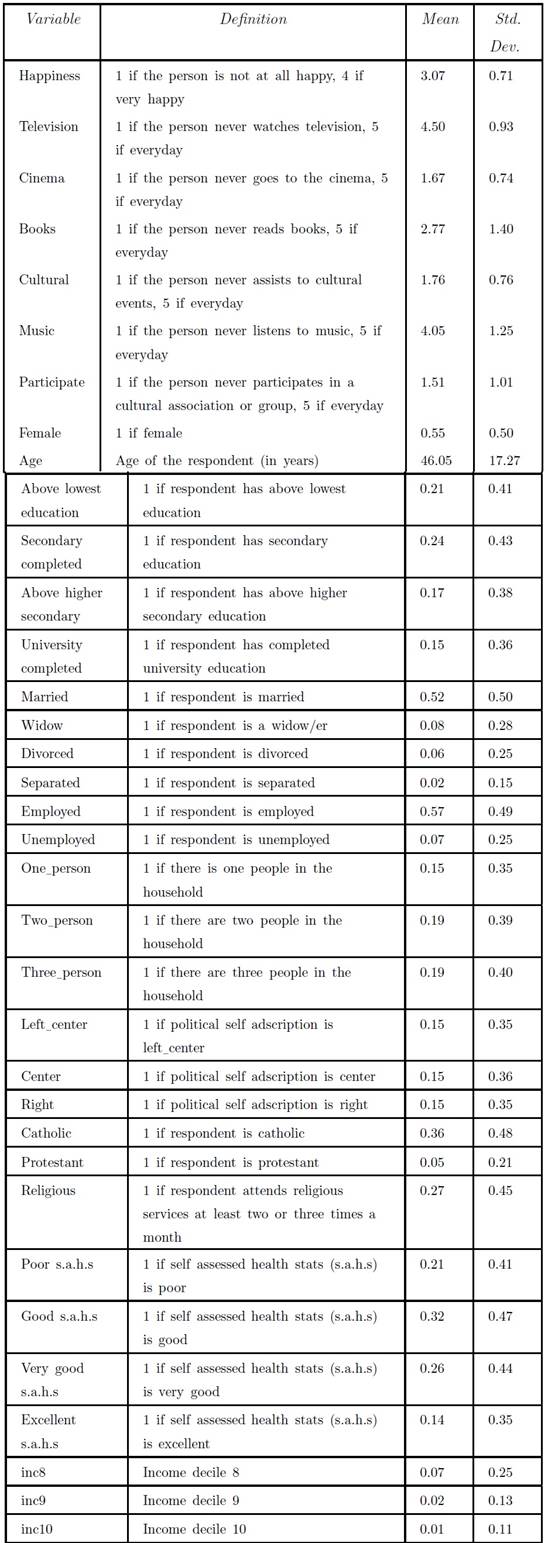
Table 1 includes the basic descriptive statistics for the variables of interest.
4. Methodology
Since our dependent variable is an ordered outcome, where higher values represent higher levels of happiness (ranging from not at all happy to very happy), we briefly present the ordered response models to be estimated.
There are two methodological questions that we need to address. First, happiness is estimated as a function of observable individual, household and context variables, but individual unobserved heterogeneity is also important. The individual error term contains unobservable traits but, given that our dataset is derived from a cross-section study of 30 countries, we cannot apply longitudinal analysis to control for unobserved individual or household characteristics that are invariant, such as personality traits and intra-household arrangements and norms. Second, country-level factors (in the form of culture, values and social norms) can have a strong influence on the determinants of happiness. We control for them in the error term of our models, allowing for observations from the same country to be correlated among each other, and uncorrelated with observations coming from a different country (clustered error terms at the country level are considered in our estimations). We also estimate models with country fixed-effects, and the results do not vary substantially.
Ordered response models are the standard way of modeling subjective well-being estimations. In such models, individuals make an evaluation of their utility and classify it under one of the categories at their disposition. Results using ordered models have been proved to be close to the results derived from OLS regressions when the dependent variable range over a large scale, which is not our case, since we have only four values. For our study, we therefore favor ordered response models (for an overview of methods and implications, see Ferrer-i-Carbonell and Frijters, 2004).
In an ordered probit model, the individual response is related to a latent process, which is unobserved. The response belongs to an ordered set that takes as many values as possible answers (k categories). We assume the existence of an underlying process, and that individual response is related to that process in the sense that individuals report a given value if their value in the latent process lies in a given interval, determined by some unobservable thresholds. That latent process depends linearly on the observable characteristics (dependent variables) and unobservable factors (captured in the error term). If we assume that the error term is normally distributed, then we can estimate an ordered probit model. Regression parameters and k-1 threshold parameters are jointly estimated.
The estimated coefficients are interpreted differently from the OLS. Thus, a positive coefficient indicates that satisfaction increases with a given covariate. We further compute the marginal effects and discuss the evaluation at the highest level of happiness (fourth category), in order to compare the magnitude of the estimated marginal effects.
5. Results
Table 2 presents the results of the ordered probit estimation as well as the marginal effects for the highest category of the dependent variable (“very happy”). In line with the literature, leisure activities have a positive and significant effect on self-reported happiness. This means that individuals who take part in leisure activities are more likely to report themselves as happy than those who do not consume any cultural goods, such as watching television, going to the cinema, listening to music or reading books. Our results reinforce the findings by Uhrig (2005), Iwasaki (2007), Borgonovi (2004) and others, and they further allow us to conclude that more active types of cultural engagement contribute more to happiness.
Table 2 Ordered probit regression and marginal effects for happy = 4 (“very happy”)
| Variable | Happiness | Marginal effects (evaluated at happiness = 4) |
|---|---|---|
| Television | 0.025* | 0.008* |
| Cinema | 0.042*** | 0.013*** |
| Books | 0.026*** | 0.008*** |
| Cultural | 0.039*** | 0.012*** |
| Music | 0.035*** | 0.011*** |
| Participate | 0.009 | 0.003 |
| Female | 0.015 | 0.005 |
| Age | -0.019*** | -0.006*** |
| Age2 | 0.000*** | 0.000*** |
| Above¯lowest¯educ | -0.05 | -0.015 |
| Secondary¯completed | -0.035 | -0.011 |
| Above¯higher¯secondary | -0.104*** | -0.032*** |
| University completed | -0.051 | -0.015 |
| Married | 0.278*** | 0.085*** |
| Widow | 0.000 | 0.000 |
| Divorced | -0.025 | -0.008 |
| Separated | -0.091 | -0.028 |
| Employed | -0.022 | -0.007 |
| Unemployed | -0.187*** | -0.057*** |
| One¯person | -0.198*** | -0.060*** |
| Two¯person | 0.032 | 0.010 |
| Three¯person | -0.010 | -0.003 |
| Center | 0.036 | 0.011 |
| Left¯center | -0.012 | -0.004 |
| Right | 0.096*** | 0.029*** |
| Catholic | 0.026 | 0.008 |
| Protestant | 0.112*** | 0.034*** |
| Religiosity | 0.123*** | 0.038*** |
| Poor s.a.h.s | -0.513*** | -0.156*** |
| Good s.a.h.s | 0.325*** | 0.099*** |
| Very good s.a.h.s | 0.653*** | 0.199*** |
| Excellent s.a.h.s | 1.227*** | 0.374*** |
| inc2 | 0.059 | 0.018 |
| inc3 | 0.234** | 0.071** |
| inc4 | 0.316*** | 0.096*** |
| inc5 | 0.422*** | 0.129*** |
| inc6 | 0.489*** | 0.149*** |
| inc7 | 0.510*** | 0.155*** |
| inc8 | 0.542*** | 0.165*** |
| inc9 | 0.699*** | 0.213*** |
| inc10 | 0.882*** | 0.269*** |
| Observations | 25 870 | |
Note: *Significant at 10%; **Significant at 5%; ***Significant at 1%. Country-effects were included in all models but not in the tables.
Participating in cultural activities has a positive and significant effect. This is also related to Kahneman et al. (2006), who proposed that the effects are different for active and passive activities. Watching television and reading books have a lower impact on self-reported happiness when compared with other leisure activities, such as attending cultural events or going out to the cinema. In fact, the more frequently individuals perform the latter activities, the happier they describe themself. The highest impact on happiness comes from the variable cinema, and we could argue that going to the cinema is a mix of both active and passive activities, given that cinema goers have to travel to the cinema complex (the active side) and sit through a movie afterwards (the passive side). It is surprising that we find a positive effect for TV watching, though we should acknowledge that our variable combines the passive use of television with the more active and intrinsically motivated use of television as a medium to watch desired contents from DVDs or videotapes. We do not find a statistically significant effect for participation in cultural groups or associations. A possible reason for this is that the variable encompasses many different, possibly heterogeneous, activities. Cultural groups could include dance, research, music and philosophy organizations among others, and could differ as to the degree of activity and involvement expected from participants.
Our control variables also hold important results. Gender does not have a significant impact on reported happiness, but age does. We find the same convex profile as in the literature, namely, happiness declines with age, reaching a minimum at 45 years. One possible explanation for the U-shape is that people learn to adapt to their strengths and weaknesses, and in adulthood quell those aspirations that are not achievable.
The relationship between happiness and education was not clear. The degree of happiness associated with low levels was not found to be significantly different compared to the lowest level (omitted, in accordance with methodology for interpreting ordered response models), while having above higher secondary education decreases by 3.2 percentage points the probability of being happy. But then the degree of happiness associated with university completed education was not significantly different from the lowest education level either. These mixed results might be a consequence of our having included income variables in the model, since the influence of education on happiness is often due to its strong relationship with income variables.4 But in our study this proxy relationship does not hold, since both income variables are significantly different form zero. This means, simply, that our study indicates that richer people have a higher probability of being happy, compared to the poor.
Being married or cohabiting increases the probability of being happy compared to being single, which is in line with international empirical evidence. A number of other studies have shown that average happiness levels are higher for married people, and that the effect is positive and long lasting (Cunningham and Knoester, 2007; Mookherjee, 1997; Shapiro and Keyes, 2008).
Also related to socioeconomic status, being unemployed appears as significant with a marginal effect of great magnitude (-14.7 percentage points). This is a stylized fact in the literature (Carroll, 2007; Krueger and Mueller, 2012, Winkelmann, 2009), which finds that unemployment is one of the events with the most adverse effects on happiness and one of the most difficult to adapt to, with individuals being potentially less happy even when they re-enter the workforce.
With regard to religion, there is a significant increase in the degree of happiness of the not-so-practicing and practitioners compared to those who are not religious, with marginal effects of 7.0 and 6.8 pp respectively, in line with previous empirical evidence (Green and Elliot, 2010; Ismail and Deshmukh, 2012). Type of religion is also seen as an important factor: Protestants are 7.7 percentage points less likely to be happy compared to Catholics.
Health status also has a significant impact on subjective well-being. Good health status has a positive impact on happiness, while poor health status has a negative impact. This is in line with previous authors findings, which suggest that people with lower levels of subjective well-being tend to report more severe symptoms of illness and take worse care of themselves (Binder and Coad, 2013).
In terms of interacting with other people, individuals living by themselves are more likely to report lower levels of happiness. This reinforces the idea that less social interactions which would be implied by, among other things, living alone- lead to lower levels of subjective well-being and satisfaction with life (Nezlek et al., 2002), and that living alone increases the chances of being depressed and feelings of loneliness (Lim and Kua, 2011).
Lastly, when comparing reported happiness and political affiliation, only those individuals who self-report their political affiliation as right wing seem to report higher levels of happiness (Dreher and Öhler, 2011; Bjørnskov, Dreher and Fischer, 2008). Center and left-center affiliation do not seem to be significantly different from left (omitted).
6. Conclusion
Our results lead us to conclude that well-being, measured as self-reported happiness, has many determinants, which range from gender to income and political affiliation, and that these determinants vary greatly in the degree to which they impact happiness. In regards to culture and happiness, attending cultural activities or consuming leisure (such as watching television or reading books) has a significant impact in the levels of reported happiness, which is in line with the research of Stiglitz, Sen and Fitoussi (2009).
Using an ordered probit regression approach we were able to quantify the likelihood of being more or less happy in relation to their participation in different types of leisure activities, concluding that leisure or cultural activities such as going to the cinema or going to concerts increase the probability of self-reporting a higher level of well being. This supports the previous literature stating that artistic activities, cinema going, and other active activities have a positive impact on happiness, while the impact of passive activities, such as watching television, is lower. Our approach has the advantage of being able to consider all these activities at the same time, accounting for the impact of each of these activities on individual happiness levels.

