


Servicios Personalizados
Revista
Articulo
 texto en
  Inglés (pdf)
 Artículo en XML
 Referencias del artículo
 Enviar artículo por email
Indicadores
-
 Citado por SciELO
 -
 Accesos
Links relacionados
-
 Similares en
SciELO
Similares en
SciELO
Compartir

 Permalink
Contaduría y administración
versión impresa ISSN 0186-1042
Contad. Adm vol.69 no.2 Ciudad de México abr./jun. 2024 Epub 10-Oct-2025
https://doi.org/10.22201/fca.24488410e.2024.4996
Articles
Social factors determining sustainable consumption behavior in the Querétaro metropolitan area
1 Universidad Tecnológica de Querétaro, México.
2 Universidad de Huelva, España.
3 Secretaría de Educación del Estado de Querétaro, México.
The objective of this research is to identify the social factors that determine sustainable consumption behavior in Mexico. The study presents a cross-sectional empirical study that obtained results through an integrated PLS-SEM model. A questionnaire with 26 indicators was administered to a probability sample of 244 respondents. A theoretical model indicates that 50.8% of the variance in sustainable consumption behavior is explained by education and information, social pressure, market conditions, social environment influence, and demographic variables. This model offers guidance for designing strategies, programs, and interventions that support society’s transition toward sustainability, since there are elements for the pertinent design of strategies, programs, solutions and any other action aimed at this end.
JEL Code: M31; Q01; Q56
Keywords: sustainable consumer behavior; sustainability; social factors; PLS-SEM
El objetivo de esta investigación es definir los factores sociales que son determinantes en el comportamiento del consumo sustentable de las personas en México. El estudio presenta un diseño empírico estadístico de corte transversal que obtuvo resultados a través de un modelo integrado PLS-SEM. Se aplicó un cuestionario con 26 indicadores a una muestra probabilística de 244 elementos. Se partió de un modelo teórico que concluyó que el 50.8% de la varianza de la variable comportamiento de consumo sustentable, está explicada por los factores educación e información, presión social, condiciones del mercado, influencias del entorno social y variables demográficas. Este modelo provee información para quienes quieren participar de la transición de la sociedad a la sustentabilidad, toda vez que se cuenta con elementos para el diseño pertinente de estrategias, programas, soluciones y cualquier otra acción encaminada a este fin.
Código JEL: M31; Q01; Q56
Palabras clave: comportamiento sustentable del consumidor; sustentabilidad; factores sociales; PLS-SEM
Introduction
Planet Earth is currently experiencing a generalized crisis that must be addressed. The environmental problem is manifested in the intensification of precipitation and droughts, the continuous increase in sea level, the impact on ecosystems, floods, and protracted and intense heat waves in cities (Intergovernmental Panel on Climate Change, 2021). Likewise, several studies have addressed the crisis from a social and economic perspective, which is global and systemic, where growing inequalities and widespread poverty occur as a characteristic of contemporary societies and recurrent global economic crises, social, political, and gender violence, famine, lack of health care, wars, militarization of the population, forced displacement, and organized crime, among other situations are observed (Hernández, 2018; Curiazi & Cajas Guijarro, 2019; Lang, 2021).
Given this discouraging context, sustainability, understood as the way to meet the needs of the present without compromising the ability of future generations to meet their own needs (Brundtland, 1987), has emerged as an alternative for action to counteract this civilizational crisis. One must possess broad, deep, and holistic knowledge to understand how economic, social, and environmental systems interact (Stibbe, 2009; Roberston, 2014, cited in Heeren et al., 2016). To this end, it has become important to develop research on the subject, which is approached from a multi- and transdisciplinary perspective and addresses contents from diverse approaches, ranging from environmental to social, economic, and behavioral issues (Acuña-Moraga & Severino-González, 2018). Thus, sustainable action is recognized as a tripartite responsibility among governments, companies, and consumers that enables real changes in people’s lifestyles (Franco Crespo, 2017). Considering that such collaborative participation should be studied separately, this paper refers only to the participation of consumers in the transformative drive toward sustainability and particularly to the social factors that affect this task.
Background
The sustainable consumer has been defined from various angles, recognizing, for example, their growing demand for information on sustainable products, the origin of raw materials and their forms of distribution, concern for the environmental and social impacts generated by their consumption, and their trend to purchase ecological products and services, even at higher prices than traditional ones (Shao et al., 2016). Sustainable consumption is related to how a person thinks about their purchasing decisions, reflecting on the social and environmental impacts of such decisions and recognizing that the current production and distribution of goods and services are inadequate for a sustainable world. Therefore, this consumer also accepts that the changes in their consumption patterns transform their surroundings’ social and environmental aspects (Villa Castaño et al., 2018). Engagement occurs at emotional, cognitive, and behavioral levels; greater commitment is associated with more desirable behavioral change (Piligrimiene et al., 2020).
From a more orthodox perspective, the sustainable consumer is located within the solidarity economy, respectful of the environment and local culture, which promotes situations of fair trade, cooperation, community work, and sustainable consumption, seeking forms of production that do not harm people or animals (Gadotti, 2016). This current involves collective action for constructing an alternative economic system governed by ethical principles for the development of life (Coraggio, 2016). Likewise, an almost utopian alternative is the theory of Good Living, where the consumer is open to new forms of relations of life in the community, where individualism has no place, consumption is determined solely by need, and the recovery of cultural identity and age-old heritage is privileged (Schlemer Alcántara, 2017).
Recently, Salgado Beltrán (2019) identified two distinct segments declared the existence of two differentiated segments in the sustainable consumption behavior of people: environmentally participatory and environmentally consistent. In the first case, a group is categorized as mainly composed of middle-income young people who, although carrying out environmentally positive activities, are not consistent due to poorly consolidated environmental values and beliefs. Conversely, the environmentally consistent group, which is smaller, is fully aware of how their actions affect the environment and act accordingly. They are economically active and of medium-high socioeconomic level. In recent decades, various studies have prior studies identify internal and external determinants of sustainable consumption behavior (SCB). To this end, it has been shown that behavior can be affected by external factors that transform or limit behaviors derived from a change in people’s values and beliefs. Therefore, it is important to consider that individual factors also include environmental variables and the context in which a person decides (Jagers et al., 2016; Piligrimiene et al., 2020). To explain SCB, as early as 1974, Kinnear, Taylor, and Ahmed determined two ecological and conscious behavior dimensions: attitudes and buying behaviors (Yarimoglu & Binboga, 2018).
In terms of what this study aims to demonstrate, the authors present different approaches to explain sustainable consumption behavior derived from factors external to the individual, in this case, social factors: the influence of the social environment was found in the literature as a trigger for more responsible consumption behaviors (Villa Castaño et al., 2018; Wang et al., 2019; Lubowiecki-Vikuk et al., 2021). Likewise, social pressure is a factor that forces consumers to act according to politically correct premises regarding their consumption decisions (Heeren et al., 2016; Yarimoglu & Binboga, 2018). On the other hand, it has also been claimed that government policies on sustainability promotion positively impact consumers (Heeren et al., 2016; Wang et al., 2019; Garcia-Machado et al., 2020; Piligrimiene et al., 2020; Lubowiecki-Vikuk et al., 2021). Likewise, market conditions such as price, for example, turn out to act as motivating or limiting factors for consumers of green, organic, fair trade, or sustainable products, so they are considered to be determinants of this behavior (Acuña-Moraga & Severino-Gonzalez, 2018; Villa Castaño et al., 2018; Yarimoglu & Binboga, 2018; Miranda-de la Lama et al. 2019; Salgado Beltrán, 2019; Piligrimiene et al., 2020; Lubowiecki-Vikuk, et al., 2021).
In addition, it has been concluded in several studies that education is a generator of habits and interests in favor of sustainability (Salgado Beltrán, 2019; Wang et al., 2019; García-Ruiz et al., 2022). In the case of demographic variables such as age, gender, and educational level, although they do not always manifest the same behavior as this depends on the context studied, it has been shown that they do influence people’s sustainable behaviors (Tabernero et al., 2015; Acuña-Moraga & Severino-González, 2018; Acuña-Moraga et al., 2022).
With this theoretical foundation and to identify the social factors that determine the sustainable behavior of consumers in Mexico, this paper, which is the last in a series of three investigations conducted in Poland (García-Machado et al., 2020) and Spain (Figueroa-García et al., 2018), aims to define how these factors contribute to and promote the sustainable consumption behavior of their populations in different economic, social and cultural contexts, which will be analyzed in a fourth study that will bring together the results.
Methodology
We conducted an explanatory quantitative study in the Querétaro metropolitan area, formed by the municipalities of Querétaro, Corregidora, and El Marqués. The instrument was a 26-item questionnaire operationalizing the endogenous construct sustainable consumption behavior (SCB) and the exogenous constructs: demographic factors (DEM_VAL), environmental influence (ENV_INF), education and information (E&I), social pressure (SO_PRE), market conditions (MKT_C), and government actions (GOV_A). The study’s hypotheses were built from the literature review carried out on this occasion and the two previous ones (García-Machado et al., 2020; Figueroa-García et al., 2018), also shown in Figure 1. The definition of the indicators can be found in Table 1.
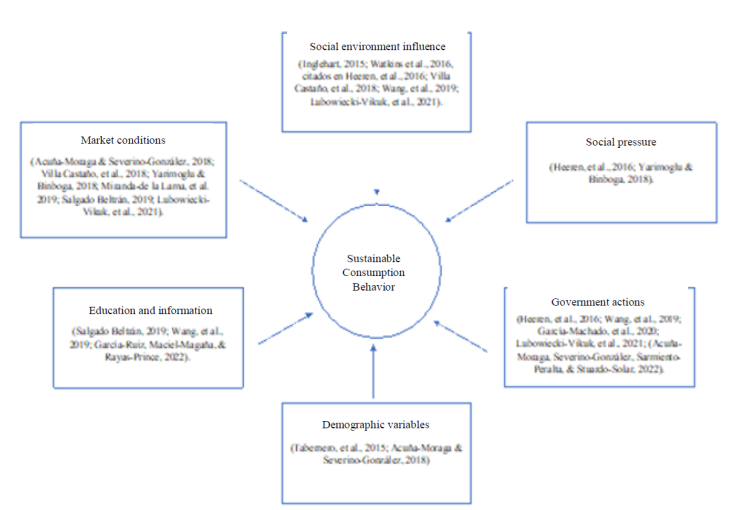
Table 1 Indicators for measurement model constructs
| Indicator variable | Definition |
|---|---|
| Demographic variables (DEM_VAL) | |
| DEMVAL_1 | Age |
| DEMVAL_2 | Gender |
| DEMVAL_3 | Educational level |
| Sustainable Consumption Behavior (SCB) | |
| SCB_1 | Carry out daily activities to care for and preserve the environment. |
| SCB_2 | Carry out concrete activities to promote human rights and social justice. |
| SCB_3 | Consume local products to support your community’s economy. |
| SCB_4 | How motivated do you feel to make changes in your life in pursuit of more responsible consumption? |
| SCB_5 | How would you rate your responsible consumption behavior? |
| Social environment influence (ENV_INF) | |
| ENVI_1 | Someone in my family or friends motivates me to follow in their footsteps in caring for the environment. |
| ENVI_2 | I have participated as a volunteer in social work or environmental organizations. |
| ENVI_3 | I take advantage of the fact that organic or ecological products are now in the supermarket to buy them. |
| ENVI_4 | Caring for the environment is a tradition in my family. |
| ENVI_5 | Where I live, it is normal to separate garbage for recycling. |
| ENVI_6 | My house has enough space to have a vegetable garden. |
| Education and Information (E&I) | |
| E&I_1 | I have attended a course, workshop, or lecture on environmental issues or responsible consumption. |
| E&I_2 | A family member, friend, or acquaintance has taught me some activities to be more responsible in consuming resources (water, electricity, energy). |
| E&I_3 | I am informed about sustainability (environmental) issues. |
| E&I_4 | I have information about the negative effects of my products on the environment. |
| Social Pressure (SO_PRE) | |
| SOPRE_1 | I have felt pressured by my friends to do something to benefit the environment. |
| SOPRE_2 | I feel compelled to belong to the group of people who are pro-environmental. |
| Market Conditions (MKT_C) | |
| MKTC_1 | Organic products give me more confidence than conventional ones. |
| MKTC_2 | I am familiar with the advertising campaigns for organic products. |
| MKTC_3 | I believe there are many places where environmentally friendly products can be found. |
| MKTC_4 | I choose an organic product as an alternative to a traditional one, even if it is more expensive. |
| Government actions (GOV_A) | |
| GOVA_1 | In my city, the government does enough to motivate more responsible behaviors toward equality and social justice. |
| GOVA_2 | The government takes care of what is necessary for me to do things for the environment. |
Source: created by the authors
For the application of the instrument, simple random probability sampling was used to determine a sample of 244 respondents. The sample distribution was 66% female and 34% male; the age range of the respondents was 18 to 69 years, with a mean of 37 years and a mode of 19. 25% had a high school or technical education, 43% had a university degree, and 30% had a postgraduate degree. Two percent reported another level of education. The survey was carried out by 6 interviewers who conducted the questionnaire in public squares, universities, parks, and homes.
Theoretical model estimation
As mentioned above, the starting point is a theoretical model based on the existing literature, with references in Figure 1.
Based on the authors referred to in Figure 1, who explain sustainable consumption behavior based on social factors, a theoretical model is proposed that presents the exogenous latent variables mentioned as causal constructs of the endogenous construct of sustainable consumption behavior (SCB), forming the PLS pathway model explained in Figure 2.
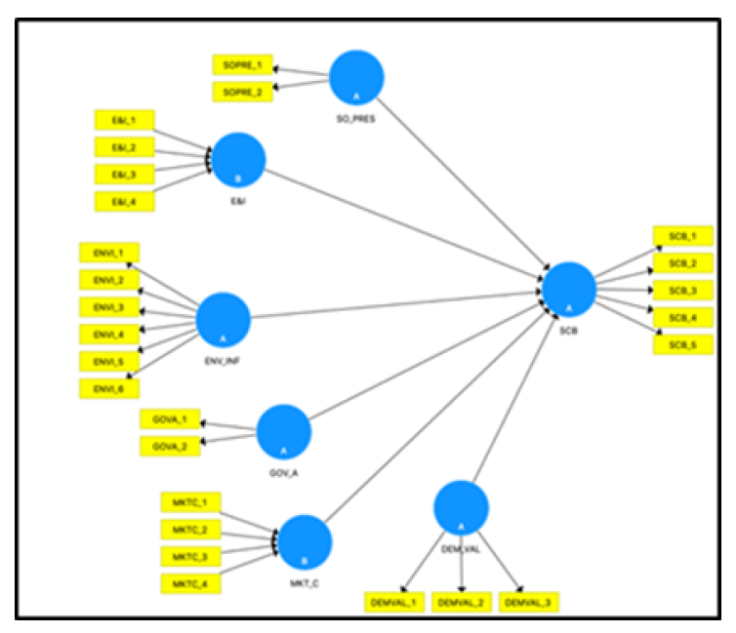
In this context, Table 2 shows the hypotheses on the possible social determinants of a person’s sustainable consumption behavior, according to the model in Figure 2.
PLS analysis
The partial least squares (PLS) technique was used to evaluate this model using the SmartPLS v. 3.3.3 software (Ringle et al., 2015). This technique is a structural equation modeling (SEM) approach suitable for complex models that handle many variables, indicators, and relationships. Furthermore, both the structural model (relationships between constructs) and the measurement models (relationships between indicators and their corresponding constructs) can be tested simultaneously (Barclay et al., 1995). Moreover, in the SEM context, two types of measurement models are proposed: common factor models (reflective measurement - Mode A), where the indicators are a reflection of the variable, and causal indicator models (formative measurement - Mode B), where they are presented as a cause of the variable (Sarstedt, M., 2016).
The database used to perform the PLS-SEM empirical analysis consisted of 244 observations. Three relevant theoretical references were reviewed to verify whether this sample size meets the criteria required in PLS-SEM for a probability sample representative of the population size. In the first instance, Cohen (1992) recommends for OLS multiple regression analysis, 106 or 130 observations, to detect R2 values around 0.10, assuming significance levels of 10% or 5%, respectively, with a statistical power of 80%. According to Nitzl (2016), to detect a mean effect size of 0.15 with the same significance levels and statistical power, 98 or 135 observations are necessary, respectively. Furthermore, Green (1991) recommends 97 observations for the same level of analysis, with a significance level of 5%. Therefore, the sample meets all three recommendations for minimum sample size in PLS-SEM.
Results
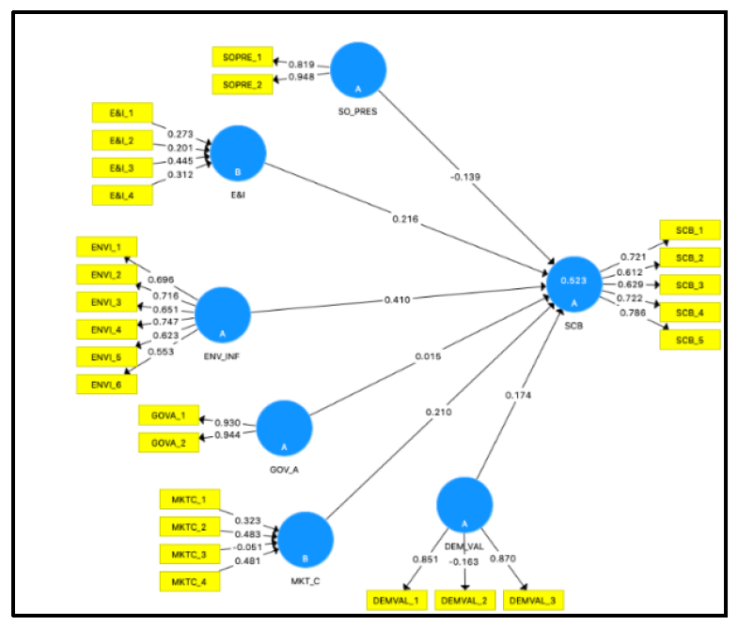
For the presentation of the results, once the PLS path model is determined, the evaluation of the measurement models begins. Figure 3 shows the loadings and external weights of the indicators for the measurement models in Mode A and Mode B, the path or regression coefficients for the relationships of the structural model, and the R2 values for the endogenous latent variable. Preliminary estimates suggest that ENV_INF (0.410) has the strongest effect on SCB, followed by E&I (0.216) and MKT_C (0.210). On the other hand, 52% of the variance of the dependent variable is explained by the 6 exogenous constructs. It will be necessary to determine whether the connection between the constructs is statistically significant, for which it is important to consider the path coefficient’s size. Notwithstanding these first observations, evaluating the measurement and structural models is necessary to make definitive statements about the coefficients’ meanings and the overall model’s goodness of fit.
Evaluation of A-mode measurement models
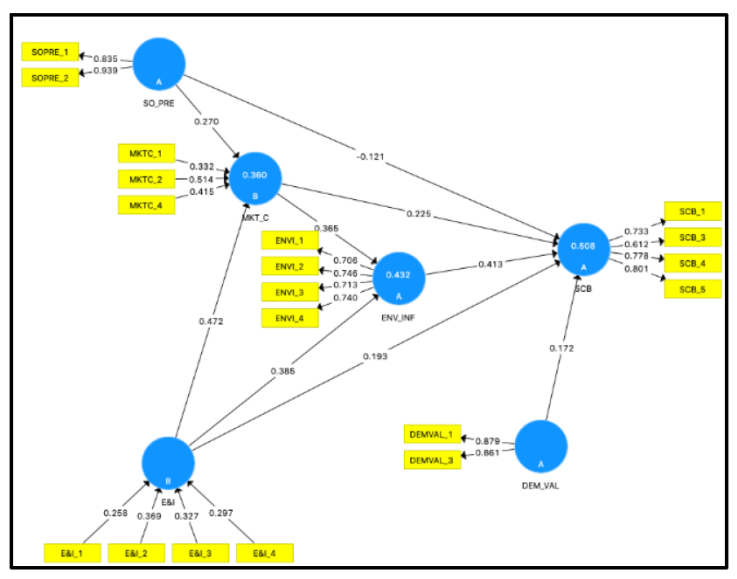
The evaluation of reflective measurement models is performed by testing the reliability and validity of each construct, which is necessary to confirm its inclusion in the model (Hair et al., 2019). The indicators observed in this assessment are indicator reliability, composite reliability, convergent validity (average variance extracted, AVE), and discriminant validity. For a construct indicator to be reliable, external loadings above 0.708 are sought; nevertheless, keeping indicators with loadings below this figure is subject to consideration since if their permanence implies an increase in composite reliability and AVE remains above the suggested threshold value, it is advisable to keep them (Hair et al., 2019). To improve the initial pathway model shown in Figure 3, and after several tests and adjustments, 7 of the 26 indicators originally proposed were eliminated since they did not reach an acceptable level of reliability (Figure 4). Therefore, from the initial hypotheses, H3:GOV_ASCB was eliminated since its only two indicators had undesirable composite reliability values, constituting an invalid measure of the construct as they are redundant (Hair et al., 2019). Likewise, new links were created between the constructs, generating new hypotheses that will be tested: H2:E&I→ENV_INF, H3:E&I→MKT_C, H6:MKT_C→ENV_INF, and H8:SO_PRE→MKT_C
Regarding the reliability and validity results obtained through the evaluation of the reflective measurement models, Table 3 shows that almost all the external loadings of the reflective constructs are above the threshold value of 0.708. On the other hand, the reliability indicators reveal what part of the variance of an indicator is explained by the construct and considering that, as a general rule, a latent variable should explain at least 50% of the variance of each indicator (Hair et al., 2021), it can be said that, except for ENVI_1 and SCB_3 whose reliability value is below this threshold, all the results of the analysis meet this criterion. In order to determine convergent validity at the construct level, the average variance extracted (AVE) was used, equivalent to a construct’s commonality (Hair et al., 2021). The requested threshold value is 0.50; in the proposed model, the results are above that value in all constructs, i.e., more than half of the variance of their indicators is explained: DEM_VAL (0.757), ENV_INF (0.527), SO_PRES (0.789) and SCB (0.540), which means that the measures for the four constructs have high levels of convergent validity.
Table 3 Summary of results for reflective measurement models
| Convergent validity | Internal consistency | |||||
|---|---|---|---|---|---|---|
| Indicators | Loads | Reliability indicator | AVE | Composite reliability | Cronbach’s alpha | |
| DEM_VAL | DEMVAL_1 DEMVAL_3 | 0.879 0.861 | 0.773 0.741 | 0.757 | 0.862 | 0.679 |
| ENV_INF | ENVI_1 | 0.706 | 0.498 | 0.527 | 0.817 | 0.702 |
| ENVI_2 | 0.746 | 0.557 | ||||
| ENVI_3 | 0.713 | 0.508 | ||||
| ENVI_4 | 0.740 | 0.548 | ||||
| SO_PRES | SOPRES_1 | 0.835 | 0.697 | 0.789 | 0.882 | 0.745 |
| SOPRES_2 | 0.939 | 0.901 | ||||
| SCB | SCB_1 | 0.733 | 0.537 | 0.540 | 0.823 | 0.713 |
| SCB_3 | 0.612 | 0.375 | ||||
| SCB_4 | 0.778 | 0.605 | ||||
| SCB_5 | 0.801 | 0.642 | ||||
Source: created by the authors
In addition to using Cronbach’s alpha, composite reliability was used to evaluate internal consistency, which assumes that the indicators have different weights (Chin, 1998). For reflective constructs, Cronbach’s alpha was ≥ 0.70 in almost all cases, which is the recommended value (Cronbach, 1951). Reliability values between 0.70 and 0.90 can be qualified as satisfactory (Nunally & Bernstein, 1994, cited in Hair et al., 2014; Frías-Navarro, 2022). As seen in Table 3, the reliability values of all reflective measurement model constructs show values above the suggested lower limit. This means all indicators for the three latent variables are above the minimum level required for external loads and composite reliability. Regarding the variable DEM_VAL that shows a Cronbach’s alpha coefficient below the threshold value, it was decided to keep it in the model since it has been shown that Cronbach’s alpha underestimates the magnitude of reliability when there are items with less than five indicators as is the case of this variable (Zumbo et al., 2007, cited in Contreras & Novoa-Muñoz, 2018). It is not always effective when used exclusively (Cervantes, 2005), so, supported by the value obtained by the composite reliability indicator, it was decided to retain it (Contreras & Novoa-Muñoz, 2018).
In order to confirm the validity of the measures of a construct, the criteria of convergent validity and discriminant validity are used. In the first case, a high correlation is sought between measures of the same construct, while for the second, this correlation must be higher than that existing between measures of a different construct (Campbell & Fiske, 1959, cited in Martínez-García & Martínez-Caro, 2009). In the evaluation of the measurement models in Mode A, the discriminant validity will be reviewed, for which the Heterotrait-Monotrait correlations ratio (HTMT) is used, whose threshold value, according to Henseler et al. (2015), is 0.90. As can be seen in Table 4, the discriminant validity criterion is satisfied in all the constructs, being presented below the threshold value.
Evaluation of B-mode measurement models
In this case, it was not possible to assess the convergent validity analysis in evaluating the formative measurement models because the necessary data for a reflective measurement of the two formative constructs are unavailable. Nevertheless, the two formative constructs (E&I and MKT_C) have the expected signs in the structural model, meeting the weakest criterion for convergent validity assessment (Avkiran, 2018). The variance inflation factor (VIF) provides an index that measures how much the variance of an estimated regression coefficient increases due to collinearity. As can be seen in Table 5, all VIF values of the formative and reflective constructs are below the threshold (<3), with a range between 1.20 and 2.05, meaning that this criterion is fully met (Hair et al., 2019).
Table 5 Diagnosis of collinearity. VIF tolerance values for the measurement model
| Predictors | VIF | Predictors | VIF | ||
|---|---|---|---|---|---|
| DEM_VAL | DEMVAL_1 | 1.359 | MKT_C | MKTC_1 | 1.575 |
| DEMVAL_3 | 1.359 | MKTC_2 | 1.228 | ||
| E&I | E&I_1 | 1.874 | MKTC_4 | 1.585 | |
| E&I_2 | 1.598 | SCB | SCB_1 | 1.322 | |
| E&I_3 | 2.051 | SCB_3 | 1.200 | ||
| E&I_4 | 1.518 | SCB_4 | 1.455 | ||
| ENV_INF | ENVI_1 | 1.323 | SCB_5 | 1.557 | |
| ENVI_2 | 1.393 | SO_PRE | SOPRE_1 | 1.546 | |
| ENVI_3 | 1.260 | SOPRE_2 | 1.546 | ||
| ENVI_4 | 1.382 |
Source: created by the authors
Tables 6 and 7 show the results of the bootstrap analysis of the measurement model for the formative constructs, which enables the determination of the significance of the estimated path coefficients by evaluating the relevance of the magnitude of the regression weights (external weights) and the relation weights (external loadings). It is required that both indicators be significantly different from zero and that the external loadings exceed the threshold value of 0.5.
Table 6 Significance and relevance of path coefficients (external weights)
| Original sample (O) | Sample mean (M) | Bias | Lower limit | Upper limit | |
|---|---|---|---|---|---|
| E&I_1 → E&I | 0.258 | 0.258 | 0.000 | 0.059 | 0.449 |
| E&I_2 → E&I | 0.369 | 0.365 | -0.004 | 0.182 | 0.550 |
| E&I_3 → E&I | 0.327 | 0.324 | -0.003 | 0.075 | 0.552 |
| E&I_4 → E&I | 0.297 | 0.293 | -0.004 | 0.097 | 0.520 |
| MKTC_1 → MKT_C | 0.332 | 0.328 | -0.004 | 0.152 | 0.522 |
| MKTC_2 → MKT_C | 0.514 | 0.509 | -0.005 | 0.352 | 0.674 |
| MKTC_4 → MKT_C | 0.415 | 0.416 | 0.001 | 0.210 | 0.596 |
Note: Bootstrapping results were obtained using accelerated bias-corrected bootstrap approach (BCa), 10 000 subsamples, no sign changes, bilateral test, 95% confidence interval.
Source: created by the authors
Table 7 Significance and relevance of the path coefficients (external loadings)
| Original sample (O) | Sample mean (M) | bias | Lower limit | Upper limit | |
|---|---|---|---|---|---|
| E&I_1 → E&I | 0.804 | 0.796 | -0.008 | 0.699 | 0.893 |
| E&I_2 → E&I | 0.798 | 0.789 | -0.009 | 0.682 | 0.890 |
| E&I_3 → E&I | 0.852 | 0.843 | -0.009 | 0.751 | 0.931 |
| E&I_4 → E&I | 0.737 | 0.730 | -0.007 | 0.595 | 0.854 |
| MKTC_1 → MKT_C | 0.768 | 0.762 | -0.006 | 0.650 | 0.864 |
| MKTC_2 → MKT_C | 0.800 | 0.794 | -0.006 | 0.685 | 0.894 |
| MKTC_4 → MKT_C | 0.806 | 0.802 | -0.004 | 0.669 | 0.897 |
Note: Bootstrapping results were obtained using accelerated bias-corrected bootstrap approach (BCa), 10 000 subsamples, no sign changes, bilateral test, 95% confidence interval.
Source: created by the authors
For this test, a 95% bootstrap analysis was run (10 000 subsamples, two-tailed test, and BCa method), which shows that all external loadings of the formative constructs of the model are relevant with a 95% confidence interval. Furthermore, all external loadings are greater than 0.5 and statistically relevant.
Evaluation of the structural model
In order to begin the structural model analysis, the algorithm has to be run in PLS-SEM, and the VIF tolerance values arising from the collinearity diagnosis have to be defined. The evaluation was performed on the three dependent constructs with their predictors. According to Table 8, all VIF values are below 3, so the structural model does not present collinearity problems (Hair et al., 2019).
Table 8 Collinearity diagnosis. VIF tolerance values for the structural model
| Endogenous latent variables | ||||
|---|---|---|---|---|
| Predictors | E&I | ENV_INF | MKT_C | SCB |
| DEM_VAL | 1.018 | |||
| E&I | 1.413 | 1.069 | 1.675 | |
| ENV_INF | 1.804 | |||
| MKT_C | 1.413 | 1.750 | ||
| SCB | ||||
| SO_PRE | 1.069 | 1.213 | ||
Source: created by the authors
To analyze the relationships that arise between the latent variables and that are expressed in the hypotheses of the research model, the R2 values of the endogenous latent variables were reviewed, which were used to evaluate the predictive accuracy of the model, verifying what part of the variance of the endogenous constructs is explained by all the exogenous constructs (Hair et al., 2014). This value should be greater than 0.1, but high R2 values are sought, considering that PLS-SEM maximizes these values of the endogenous latent variables in the path model (Falk & Miller, 1992).
The PLS-SEM algorithm showed moderate values for the three endogenous latent variables (Hair et al., 2019), explaining 43.2% of the variance of the variable environmental influences (ENV_INF), 36% of the variable market conditions (MKT_C), and 50.8% of the variable sustainable consumption behavior (SCB). These values also meet the criteria of Falk and Miller (1992), described above (Table 9).
Table 9 Explained variance
| Endogenous latent variables | R2 |
|---|---|
| ENV_INF | 0.432 |
| MKT_C | 0.360 |
| SCB | 0.508 |
Source: created by the authors
A bootstrap analysis was performed with 10 000 samples to test whether the path coefficients of the structural model are statistically significant. The bootstrap procedure was performed for a two-tailed test with a 95% confidence interval. In this analysis, the coefficient estimates form an initial distribution approximating the sampling distribution (Hair et al., 2019).
According to the results obtained in the p-value analysis (Table 10), all the path coefficients proposed in the model shown in Figure 4 were significant, with all the causal relationships being significant at a 99% confidence level.
Table 10 Significance test results for the path coefficients of the structural model
| Paths | Path coefficients | t Value | Significance levels | p-value | Standard error | Bias-corrected confidence intervals | |
|---|---|---|---|---|---|---|---|
| Lower limit | Upper limit | ||||||
| DEM_VAL → SCB | 0.172 | 3.745 | *** | 0.000 | 0.046 | 0.078 | 0.258 |
| E&I → ENV_INF | 0.385 | 6.200 | *** | 0.000 | 0.062 | 0.255 | 0.497 |
| E&I → MKT_C | 0.472 | 9.016 | *** | 0.000 | 0.052 | 0.355 | 0.562 |
| E&I → SCB | 0.193 | 3.095 | *** | 0.002 | 0.062 | 0.068 | 0.312 |
| ENV_INF → SCB | 0.413 | 6.925 | *** | 0.000 | 0.060 | 0.295 | 0.530 |
| MKT_C → ENV_INF | 0.365 | 5.842 | *** | 0.000 | 0.062 | 0.234 | 0.479 |
| MKT_C → SCB | 0.225 | 3.631 | *** | 0.000 | 0.062 | 0.103 | 0.348 |
| SO_PRE → MKT_C | 0.270 | 5.477 | *** | 0.000 | 0.049 | 0.173 | 0.366 |
| SO_PRE → SCB | -0.121 | 2.945 | *** | 0.003 | 0.041 | -0.199 | -0.040 |
Note: NR = Not significant. ** p < 0.05, *** p < 0.01; (based on t(55), two-tailed test). Bootstrap confidence intervals for 5% probability of error (α = 0.05)
Source: created by the authors
Evaluation of the hypotheses
In order to evaluate the hypotheses, the empirical t-value (Student’s t) was compared with the critical value, considering that if the former is greater than the latter, it can be concluded that the coefficient is statistically significant under a certain level of significance (Hair et al., 2019). Considering how the hypotheses are stated, the null hypothesis is rejected when zero does not fall in the confidence interval, accepting the alternative hypothesis. The analysis of those hypotheses that had been originally established (except for the hypothesis that was eliminated in the model fit) and those that were generated in constructing new links between the variables in the adjusted model are presented, so the original numbering changed. The results are presented in Table 11.
Table 11 Hypothesis testing
| Hypothesis | Suggested effect | Path coefficient | t-Value (Bootstrap) | Confidence intervals | H Is it accepted? | |
|---|---|---|---|---|---|---|
| Lower limit | Upper limit | |||||
| H1:DEM_VAL → SCB | (+) | 0.172 | 3.745 | 0.078 | 0.258 | Yes*** |
| H2:E&I → ENV_INF | (+) | 0.385 | 6.200 | 0.255 | 0.497 | Yes *** |
| H3:E&I → MKT_C | (+) | 0.472 | 9.016 | 0.355 | 0.562 | Yes *** |
| H4:E&I → SCB | (+) | 0.193 | 3.095 | 0.068 | 0.312 | Yes *** |
| H5:ENV_INF → SCB | (+) | 0.413 | 6.925 | 0.295 | 0.530 | Yes *** |
| H6:MKT_C → ENV_INF | (+) | 0.365 | 5.842 | 0.234 | 0.479 | Yes *** |
| H7:MKT_C → SCB | (+) | 0.225 | 3.631 | 0.103 | 0.348 | Yes *** |
| H8:SO_PRE → MKT_C | (+) | 0.270 | 5.477 | 0.173 | 0.366 | Yes *** |
| H9:SO_PRE → SCB. | (-) | -0.121 | 2.945 | -0.199 | -0.040 | Yes*** |
Note: ***t (0.01) = 2.57; **t (0.05) = 1.96; *t (0.10) = 1.65; (+) = Positive ratio
Source: created by the authors
Considering that the t-values of all the contrasted hypotheses were higher than the critical value of 2.57, all the proposed alternative hypotheses were accepted with a confidence level of 99% (Ritchey, 2008). A significant finding is that the hypothesis SO_PRE→ SCB was negative, a situation that will be discussed later. To assess the relevance of these significant relationships in the model, PLS-SEM identifies meaningful and significant effects on the coefficients by assessing the indirect effects generated by the mediating constructs, which is done by aggregating the direct and indirect effects to measure the total effect (Hair et al., 2014).
Table 12 shows that the total effect of SO_PRE on SCB was not significant (p = 0.667). The rest of the total effects are significant at 99%.
Table 12 Results of the significance test for total effects
| Path | Total effects | t Value | Sig. level | p-value | Standard error | Confidence intervals | |
|---|---|---|---|---|---|---|---|
| Lower limit | Upper limit | ||||||
| H1:DEM_VAL SCB→ | 0.172 | 3.745 | *** | 0.000 | 0.046 | 0.078 | 0.258 |
| H2:E&I → ENV_INF | 0.557 | 11.780 | *** | 0.000 | 0.047 | 0.450 | 0.638 |
| H3:E&I → MKT_C | 0.472 | 9.016 | *** | 0.000 | 0.052 | 0.355 | 0.562 |
| H4:E&I → SCB | 0.529 | 10.126 | *** | 0.000 | 0.052 | 0.410 | 0.620 |
| H5:ENV_INF → SCB | 0.413 | 6.925 | *** | 0.000 | 0.060 | 0.295 | 0.530 |
| H6:MKT_C → ENV_INF | 0.365 | 5.842 | *** | 0.000 | 0.062 | 0.234 | 0.479 |
| H7:MKT_C SCB→ | 0.376 | 5.925 | *** | 0.000 | 0.063 | 0.248 | 0.497 |
| H8:SO_PRE MKT_C→ | 0.270 | 5.477 | *** | 0.000 | 0.049 | 0.173 | 0.366 |
| H9:SO_PRE → SCB | -0.019 | 0.431 | NR | 0.667 | 0.045 | -0.104 | 0.069 |
Note: NR = not significant. ** p < 0.05, *** p < 0.01; (based on t(55), two-tailed test). Bootstrap confidence intervals for 5% probability of error (α = 0.05)
Evaluation of model goodness of fit
To quantify the discrepancy between the empirical correlation and the correlation matrices implicit in the model, seeking to normalize the difference between the observed and predicted correlations, the goodness of fit analysis for the model was performed using the SRMR (Standardized Root Mean Square Residual) absolute fit measure, obtained by running the PLS bootstrap. The smaller the SRMR, the better the theoretical model fit (Henseler et al., 2009). A zero value means a perfect fit, and a value below 0.08 is considered a good fit (Hu & Bentler, 1999). Other authors accept values below 0.10 for this criterion (Hair et al., 2019). Table 13 shows the results of this analysis, where, SRMR values for both saturated (0.071) and estimated (0.073) models are below the 0.08 threshold, indicating acceptable fit (Hair et al., 2019).
Discussion
The study concluded that the demographic variables education and information, social pressure, social environment influence, and market conditions explain 50.8% of the endogenous latent variable SCB variance. Likewise, new hypotheses were accepted that establish other relationships: on the one hand, 43.2% of the variance of the ENV_INF variable is explained by the E&I and MKT_C constructs. On the other hand, the E&I and SO_PRE variables explain 36% of the variance of the MKT_C variable. According to the results reviewed, all the hypotheses tested were accepted with a confidence level of 99%. The model demonstrates that the variables posed in the corrected model are positively and significantly related to people’s sustainable consumption behavior. In the case of education and information, it was possible to affirm that this social factor does determine SCB (hypotheses E&I→ENV_INF; E&I→MKT_C and E&I→SCB). Although it has been concluded that, by itself, educating on sustainability issues does not necessarily imply an increase in pro-environmental behaviors, it has also been stated that the lack of knowledge on the subject is one of the main causes of unsustainable behaviors since people do not know how such behaviors affect society (Heeren et al., 2016).
Moreover, it is considered an opportunity for environmental education to be the means to raise people’s awareness, especially of the effects of their consumption on environmental deterioration (Salgado Beltrán, 2019). On the other hand, as a measure to respond to the planet’s environmental problems, the generation of knowledge must be guaranteed, integrating the issue of sustainability into educational and research programs (Geng et al., 2013). Consumers can modify their consumption behaviors if the awareness of sustainability is developed in them through educational programs (Wang et al., 2019).
It is also confirmed that the influence of the social environment is a determinant of SCB (ENV_INF(SCB hypothesis). On the subject, Villa Castaño et al. (2018) also presented evidence of the influence of socioeconomic and cultural environments on responsible consumer behavior. Likewise, the authors report that sustainable consumption is possible, from which cultural values, which focus on satisfying basic needs, are transformed into values that seek the common welfare. Similarly, it is recognized that the political factor can influence the degree of responsibility of a consumer (Lubowiecki-Vikuk, et al., 2021). On the other hand, there are negative environmental factors, such as corruption, inequality, and poverty, which limit sustainable consumption and, in this context, economics, politics, and cultural diversity are also elements that intervene in the definition of sustainable consumption patterns in countries (Wang et al., 2019). Undoubtedly, it can be stated that the social environment strongly influences consumer awareness regarding their responsibility to create a more sustainable society.
Likewise, it is demonstrated that market conditions greatly influence consumers to be more responsible and aware, recognizing that there is a direct and meaningful cause-and-effect relation (hypotheses: MKT_C→ENV_INF and MKT_C→SCB). Thus, the strategies used by marketing to educate and inform consumers about responsible consumption are essential to achieve the purchase of products that correspond to their values. Likewise, evidence has been found that such consumers encounter limitations deriving from poorly made marketing decisions, such as high prices, incorrect labeling, and certification not known or not supported by the government (Miranda-de la Lama et al., 2019). Given this reality, markets are challenged to create less harmful products and services, which are communicated to consumers so that they change their consumption habits in favor of a sustainable lifestyle (Acuña-Moraga & Severino-González, 2018). It has also been recognized that marketing factors reinforce sustainable lifestyles (Lubowiecki-Vikuk et al., 2021).
In another aspect, social pressure is a predictor of sustainable consumption behavior. Through social norms, this variable has been recognized as a determinant of sustainable behavior in several areas (consumption behavior, waste management, and environmental risks) (Heeren et al., 2016). Also, social pressure, from the perception of subjective norms, is part of the indicators used to measure behavioral intention (Yarimoglu & Binboga, 2018). Given this situation, social pressure was expected to influence sustainable behavior positively (SO_PRE→SCB hypothesis); nevertheless, this model produced a negative value, considered an important finding. As social beings, individuals respond to contextual norms, so they tend to act consistently with the norms of the groups to which they belong, so the pressure can be positive or negative, as the case may be (Tabernero et al., 2015). In this regard, Alonso and Ildefonso (2012) state that if the consumer does not belong to a group with values and symbols compatible with their own, the pressure this group exerts on them may be contrary or non-existent.
Regarding demographic variables (DEM_VAL→SCB hypothesis), it has been shown that gender or age plays a role in responsible consumer behavior, causing meaningful differences in the measured dimensions in certain contexts (Acuña-Moraga & Severino-González, 2018). Nevertheless, some contradictions indicate that these variables are unrelated to such behavior (Tabernero et al., 2015). The present study concluded that age and educational level have a positive and significant relation with SCB, but gender does not exhibit a significant association with SCB in this sample.
On the other hand, it has been recommended that governments, at all levels, should be involved in promoting responsible behaviors in consumers based on information through incentives for purchasing sustainable products (Lubowiecki-Vikuk et al., 2021). Likewise, it has been concluded that, both in developed and developing economies, governments, through their policies, strategies, and programs, should actively participate in achieving sustainable consumption and production systems (Wang et al., 2019). Notwithstanding the above, this study could not prove that government actions determine sustainable consumption behavior in Mexico since there was redundancy in its indicators, and the construct had to be eliminated. Nevertheless, studies in other countries, such as Poland, conclude that government actions explain sustainable consumption behavior (García-Machado et al., 2020).
Conclusions
This research was based on a theoretical model that proposed that 6 social factors are determinants of people’s sustainable consumption behavior. This research concludes that these factors are crucial in determining sustainable consumption behavior. The influence of these social factors on how people purchase and use products and resources cannot be underestimated. As society continues toward greater environmental and social awareness, it is essential to recognize and encourage these factors as key drivers to promote more responsible and sustainable consumption. Collaboration between individuals, communities, and governments plays a key role in creating an enabling environment for more ethical and equitable consumption behavior.
On the other hand, sustainable consumption behavior is an increasingly important trend in today’s society. As environmental and social concerns continue to grow, people are taking a more conscious and responsible approach toward what they buy and how they use it. This approach benefits the environment by reducing waste and ecological footprint and promotes a more balanced and ethical lifestyle. The widespread adoption of sustainable consumption habits is essential to address global challenges and ensure a healthier and more sustainable future for future generations. The model resulting from this research enables the motivators of sustainable consumption behavior to be identified, which provides elements to encourage this behavior in people through the formulation of programs, strategies, guidelines, and any other relevant action for this purpose. This way, governments, companies, educational institutions, associations, and citizens can become managers and actors in society’s transition toward sustainability and the common good.
Limitations
The limitations of this study are mainly related to the geographic area analyzed since, by focusing this research on the Querétaro metropolitan area, the results and conclusions may be limited to similar contexts. Likewise, as a future line of research, stratified sampling is suggested to compare results based on differentiated demographic criteria through a multigroup analysis.
REFERENCES
Acuña-Moraga, O., & Severino-González, P. (2018). Sustentabilidad y comportamiento del consumidor socialmente responsable. Opción. Revista de Ciencias Humanas y Sociales, 34 (87), 299-324. Disponible en: Disponible en: https://produccioncientificaluz.org/index.php/opcion/article/view/23881 Consultado: 12/01/23. [ Links ]
Acuña-Moraga, O., Severino-González, P., Sarmiento-Peralta, G., & Stuardo-Solar, C. (2022). Consumo sustentable en Chile: una aproximación a los objetivos de desarrollo sostenible (ODS). Información Tecnológica, 33(4), 181-190. http://dx.doi.org/10.4067/S0718-07642022000400181 [ Links ]
Alonso, J., & Ildefonso, E. (2012). Comportamiento del consumidor. Decisiones y estrategias de marketing. México: Alfaomega. [ Links ]
Avkiran, N. K. (2018). Rise of the Partial Least Squares Structural Equation Modeling: An Application in Banking. En N. K. Avkiran, & C. M. Ringle (eds.), Partial Least Squares Structural Equation Modeling. 1-29 Springer, Cham. https://doi.org/10.1007/978-3-319-71691-6_1 [ Links ]
Barclay, D., Thompson, R., Higgins, C. (1995). The Partial Least Square (PLS) Approach to Causal Modelling: Personal computer adoption and use as an illustration. Technology Studies, 2(2), 285-309. Disponible en: Disponible en: https://www.researchgate.net/publication/313137896_The_partial_least_squares_approach_to_causal_modeling_Personal_computer_adoption_and_use_as_an_illustration Consultado: 23/02/23. [ Links ]
Brundtland, G.H. (1987). Nuestro Futuro Común. Informe de la Comisión Mundial sobre el Medio Ambiente y el Desarrollo. Naciones Unidas. Oslo: Naciones Unidas. Disponible en: Disponible en: http://www.ecominga.uqam.ca/PDF/BIBLIOGRAPHIE/GUIDE_LECTURE_1/CMMAD-Informe-Comision-Brundtland-sobre-Medio-Ambiente-Desarrollo.pdf y Consultado: 24/11/22 [ Links ]
Cervantes, V. H. (2005). Interpretaciones del coeficiente Alfa de Cronbach. Avances en Medición (3), 9-28. Disponible en: Disponible en: https://www.academia.edu/33218497/Interpretaciones_del_coeficiente_alpha_de_Cronbach y Consultado en: 15/10/22. [ Links ]
Chin, W.W. (1998). The Partial Least Approach to Structural Equation Modelling, en Marcoulides, A. Ed. Modern Methods for Business Research. New Jersey: Lawrence Erlbaum, p. 295-336. Disponible en: Disponible en: https://www.researchgate.net/profile/Wynne-Chin/publication/311766005_The_Partial_Least_Squares_Approach_to_Structural_Equation_Modeling/links/0deec533e0f7c00f59000000/The-Partial-Least-Squares-Approach-to-Structural-Equation-Modeling.pdf y Consultado en: 12/01/23. [ Links ]
Cohen, J. (1992). A power primer. Psychological Bulletin, 112(1), 155-159. https://doi.org/10.1037/0033-2909.112.1.155 [ Links ]
Contreras, S., & Novoa-Muñoz, F. (2018). Ventajas del alfa ordinal respecto al alfa de Cronbach ilustradas con la encuesta AUDIT-OMS. Revista Panamericana de Salud Pública (42), 1-6. https://doi.org/10.26633/RPSP.2018.65 [ Links ]
Coraggio, J.L. (2016). Movimientos sociales y economía. En J.L. Coraggio (coord.), Economía social y solidaria en movimiento (págs.. 15-38). Los Polvorines: Universidad Nacional de General Sarmiento. Disponible en: Disponible en: http://repositorio.ungs.edu.ar/handle/UNGS/266 Consultado: 2/9/22 [ Links ]
Cronbach, L.J., (1951). Coefficient alpha and the internal structure of tests. Psychometrika 16, 297-334. https://doi.org/10.1007/BF02310555 [ Links ]
Curiazi, R., & Cajas Guijarro, J. (2019). Crisis civilizatoria capitalista y “otras economías”: de la distopia a las alternativas. Revista de Sociología (29), 47-84. https://doi.org/10.15381/rsoc.v0i29.16973 [ Links ]
Falk, R.F. y Miller, N.B. (1992). A Primer for Soft Modelling, The University of Akron Press. [ Links ]
Figueroa-García, E. C., García-Machado, J. J., & Pérez-Bustamante Yábar, D. C. (2018). Modeling the Social Factors That Determine Sustainable Consumption Behavior in the Community of Madrid. Sustainability, 10 (8) 2811, https://doi.org/10.3390/su10082811 [ Links ]
Franco Crespo, A.A. (2017). Políticas públicas que modifican los hábitos de consumo como estrategia de protección medioambiental. Tesis Doctoral, 252. Quito, Ecuador: Universidad Andina Simón Bolívar. Disponible en: Disponible en: http://hdl.handle.net/10644/5579 y consultado: 23/02/23. [ Links ]
Frías-Navarro, D. (2022). Apuntes de consistencia interna de los ítems de un instrumento de medida. Valencia, España: Universidad de Valencia. Disponible en: Disponible en: https://www.uv.es/friasnav/AlfaCronbach.pdf y Consultado: 20/03/23. [ Links ]
Gadotti, M. (2016). Educación popular y economía solidaria. En J. L. Coraggio, & C. L. Social (Ed.), Economía social y solidaria en movimiento (pág. 232). Los Polvorines: Universidad Nacional de General Sarmiento. [ Links ]
García-Machado, J. J., Figueroa-García, E. C., & Jachowicz, A. (2020). Sustainable Consumption Behaviour in Poland Through a PLS-SEM Model. En W. Sroka (Coord.), Perspectives on Consumer Behaviour. Theoretical Aspects and Practical Applications (págs. 147-171). Switzerland AG: Springer. https://doi.org/10.1007/978-3-030-47380-8 [ Links ]
García-Ruiz, M., Maciel-Magaña, S., & Rayas-Prince, J. (2022). Actitudes ambientales favorables para fomentar un consumo sustentable en el futuro profesorado de primaria a través de temáticas socioambientales. TED Tecné, Episteme y Didaxis (53), 181 - 198. https://doi.org/10.17227/ted.num53-16564 [ Links ]
Geng, Y., Liu, K., Xue, B., & Fujita, T. (2013). Creating a “green university” in China: a case of Shenyang University. Journal of Cleaner Production, (61), 13-19. https://doi.org/10.1016/j.jclepro.2012.07.013 [ Links ]
Green, S.B. (1991). How many Subjects does it take to do a Regression Analysis? Multivariate Behavioral Research, 26 (3), 499-510. https://doi.org/10.1207/s15327906mbr2603_7 [ Links ]
Grupo Intergubernamental de Expertos sobre el Cambio Climático. (9 de Agosto de 2021). IPCC en español. Obtenido de Naciones Unidas: Obtenido de Naciones Unidas: https://www.ipcc.ch/site/assets/uploads/2021/08/IPCC_WGI-AR6-Press-Release-Final_es.pdf y Consultado: 15/01/23. [ Links ]
Hair, J.F., Hult, G.T., Ringle, C.M., Sarstedt, M. (2014). A Primer on Partial Least Squares Structural Equation Modelling (PLS-SEM). California: SAGE Publications, Inc. [ Links ]
Hair, J. F., Hult, G. T., Ringle, C. M., Sarstedt, M., Castillo Apraiz, J., Cepeda Carrión, G., & Roldán, J. L. (2019). Manual de Partial Least Squares Structural Equation Modeling (PLS-SEM). 2a. Ed. España: OmniaScience. https://doi.org/10.3926/oss.37 [ Links ]
Hair, J. F., Sarstedt, M., Ringle, C. M., Gudergan, S. P., Castillo Apraiz, J., Cepeda Carrion, G. A., & Roldán, J. L. (2021). Manual Avanzado de Partial Least Squares Structural Equation Modeling (PLS-SEM). Madrid: OmniaScience. https://doi.org/10.3926/oss.407 [ Links ]
Hair, J.; Sarstedt, M.; Ringle, C. (2019). Rethinking some of the rethinking of partial least squares. European Journal Marketing, 53, 566-584. https://doi.org/10.1108/EJM-10-2018-0665 [ Links ]
Heeren, A. J., Singh, A. S., Zwickle, A., Koontz, T. M., Slagle, K. M., & McCreery, A. C. (2016). Is sustainability knowledge half the battle? An examination of sustainability knowledge, attitudes, norms, and efficacy to understand sustainable behaviours. International Journal of Sustainability in Higher Education, 17(5), 613-632. http://dx.doi.org/10.1108/IJSHE-02-2015-0014 [ Links ]
Henseler, J., Ringle, C.M. y Sarstedt, M. (2015). A new criterion for assessing discriminant validity in variance-based structural equation modeling. Journal of the Academic of Marketing Science. 43(1), 115-135. https://doi.org/10.1007/s11747-014-0403-8 [ Links ]
Henseler, J.; Ringle, C.; Sinkovics, R. (2009). The Use of Partial Least Square Path Modeling in International Marketing. Advances in International Marketing (20), 277-319. https://doi.org/10.1108/S1474-7979(2009)0000020014 [ Links ]
Hernández, L. H. (2018). Crisis civilizatoria, energías limpias y gestión local. Ciencia Política, 13(25), 127-145. https://doi.org/10.15446/cp.v12n25.69338 [ Links ]
Hu, L. T., & Bentler, P. M. (1999). Cutoff Criteria for Fit Indexes in Covariance Structure Analysis: Conventional Criteria versus New Alternatives. Structural Equation Modeling, 6, 1-55. http://dx.doi.org/10.1080/10705519909540118 [ Links ]
Jagers, S., Martinsson, J., y Matti, S. (2016). The Environmental Psychology of the Ecological Citezen: Cmparing Competing Models of Pro-Environmental Behavior. Social Science Quarterly, 97 (5). 1005 - 1022. https://doi.org/10.1111/ssqu.12313 [ Links ]
Lang, M. (2021). Simulación e irresponsabilidad: el ‘desarrollo’ frente a la crisis civilizatoria. Miradas críticas desde los feminismos y el pensamiento decolonial sobre los Objetivos de Desarrollo Sustentable y la erradicación de la pobreza. Gestión y Ambiente (24), 131-152. https://doi.org/10.15446/ga.v24nsupl1.91899 [ Links ]
Lubowiecki-Vikuk, A., Dabrowska, A., & Machnik, A. (2021). Responsible consumer and lifestyle: Sustainability insights. Sustainable Production and Consumption (25), 91-101. https://doi.org/10.1016/j.spc.2020.08.007 [ Links ]
Martínez-García, J. A., & Martínez-Caro, L. (2009). Los test estadísticos y la evaluación de escalas: el caso de la validez discriminante. Investigaciones Europeas de Dirección y Economía de la Empresa 15(2), 15-24. https://doi.org/10.1016/S1135-2523(12)60086-0 [ Links ]
Miranda-de la Lama, G. C., Estévez-Moreno, L. X., Villarroel, M., Rayas-Amor, A. A., María, G. A., & Sepúlveda, W. S. (2019). Consumer Attitudes Toward Animal Welfare-Friendly Products and Willingness to Pay: Exploration of Mexican Market Segments. Journal of Applied Animal Welfare Science, 22(1), 13-25. https://doi.org/10.1080/10888705.2018.1456925 [ Links ]
Nitzl, C. (2016). The use of partial least squares structural equation modelling (PLS-SEM) in management accounting research: Directions for future theory development. Journal of Accounting Literature, 37, 19-35. https://doi.org/10.1016/j.acclit.2016.09.003 [ Links ]
Piligrimiene, Ž., Žukauskaite, A., Korzilius, H., Banytè, J., & Dovalienè, A. (2020). Internal and External Determinants of Consumer Engagement in Sustainable Consumption. Sustainability, 12(1349), 1-20. https://doi:10.3390/su12041349 [ Links ]
Ringle, C., Wende, S., & Becker, J. (2015). SmartPLS 3. (http://www.smartpls.com, Ed.) Boenningstedt, Boenningstedt: SmartPLS GmbH. [ Links ]
Ritchey, F. J. (2008). Estadística para las ciencias sociales. Colombia, Colombia: McGraw Hill. [ Links ]
Salgado Beltrán, L. (2019). Segmentación de los consumidores de alimentos orgánicos según sus actitudes, valores y creencias ambientales. Contaduría y Administración, 64(2), 1-22. http://dx.doi.org/10.22201/fca.24488410e.2018.1491 [ Links ]
Sarstedt, M., Hair, J.F., Ringle, C.M., Thiele, K.O., Gudergan, S.P. (2016). Estimation issues with PLS and CB-SEM: Where the bias lies! Journal of Business Research, 69(10), 3998-4010. https://doi.org/10.1016/j.jbusres.2016.06.007 [ Links ]
Schlemer Alcántara, L. (2017). Bem Viver: uma perspectiva (des)colonial das comunidades indígenas. Rupturas, 7(2), 1-31. http://dx.doi.org/10.22458/rr.v7i2.1831 [ Links ]
Shao, J., Taisch, M., y Ortega Mier, M. (2016). Influencing factors to facilitate sustainable consumption: from de experts viewpoints. Journal of Cleaner Production (142), 203-216. http://doi.org/10.1016/j.jclepro.2015.12.111 [ Links ]
Tabernero, C., Hernández, B., Cuadrado, E., Luque, B., & Pereira, C. (2015). A multilevel perspective to explain recycling behavior in communities. Journal of Environmental Management, 192-201. https://doi.org/10.1016/j.jenvman.2015.05.024 [ Links ]
Villa Castaño, L. E., Perdomo-Ortiz, J., Durán León, W. F., & Dueñas Ocampo, S. (2018). Measuring socially responsible consumption: a study of Colombia-Mexico. Academia Revista Latinoamericana de Administración, 31(3), 553-568. http://dx.doi.org/10.1108/ARLA-12-2016-0356 [ Links ]
Wang, C., Ghadimi, P., Lim, M. K., & Tseng, M.-L. (2019). A literature review of sustainable consumption and production: A comparative analysis in developed and developing economies. Journal of Cleaner Production, 206 (1), 741-754. https://doi.org/10.1016/j.jclepro.2018.09.172 [ Links ]
Yarimoglu, E., & Binboga, G. (2018). Understanding sustainable consumption in an emerging country: The antecedents and consequences of the ecologically conscious consumer behavior model. Business Strategy and the Environment, 28(4), 642-651. http://doi.org/10.1002/bse.2270 [ Links ]
Received: March 03, 2023; Accepted: September 28, 2023; Published: October 05, 2023
 Este es un artículo publicado en acceso abierto bajo una licencia Creative Commons
