Artículos
Omnichannel; Consistency in a retail brand's channel integration

-
Publication dates-
October 10, 2025
Apr-Jun , 2024
- Article in PDF
- Article in XML
- Automatic translation
- Send this article by e-mail
- Share this article +
Abstract
The rise of digital brands has forced traditional retail brands to introduce the digital channel in the purchase of goods and services. Traditional retail brands went from having only physical points to having digital channels and applications, becoming multichannel businesses, and more recently omnichannel. In Latin America, the adoption of the digital channel has intensified due to the increase in digital culture during the Covid 19 pandemic, however, at the beginning of the pandemic, consumers are still exploring digital channels as an option for purchase. of essential products. This article presents exploratory results on the use of retail brand channels in Colombia, specifically presenting the results on the perception of consistency between them and their relationship with retail brands of consumer products, this being one of the essential conditions of the integration. The data was collected during the months of April and May 2020 and is part of a study that seeks to understand the omnichannel purchasing behavior of consumers in emerging economies. Through the approach of a model type SEM (Structural Equation Model) revised with the PLS software, the relationship between the concepts of consistency and brand value is analyzed. The results confirm the relationship between brand value and consistency between channels.
JEL Code::
N16, M31, M15
Keywords::
omnichannel, emerging countries, consistency, retail brand
Introduction
Omnichannel is a shopping experience where consumers can shift between the physical and digital channels offered by brands. It represents an integrated sales experience that combines the advantages of physical store shopping with online shopping (Rigby, 2011). Omnichannel integrates online and offline channels to satisfy the consumer. The consumer is expected to experience this satisfaction during the shopping journey and at every touchpoint where they encounter the brand (Verhoef et al., 2015). While multichannel (separate channel experience) and omnichannel (integrated channel experience) models emerged before the pandemic, the increase in digital culture and competition in the post-pandemic retail sector has put even more pressure on brands to offer consumers both online and offline channels, whether click-and-collect or delivery (Nielsen, 2020).
-
Rigby, 2011The future of shoppingHarvard Business Review, 2011
-
Verhoef et al., 2015From Multi-Channel Retailing to Omni-Channel Retailing: Introduction to the Special Issue on Multi-Channel RetailingJournal of Retailing, 2015
-
Nielsen, 2020covid-19 has flipped the value proposition of omnichannel shopping for constrained consumers, 2020
The progress from multichannel to omnichannel differs in all territories, depending on cultural, technological, and social factors. In Colombia, where this research occurred, consumers have traditionally preferred the physical channel. Nonetheless, consumers have been gradually adopting the digital channel, much more so after the pandemic, because they feel increasingly comfortable using technologies to choose and buy products, especially those that support the integration of online and offline channels and services (La Republica, 2022).
-
La Republica, 2022El uso de tecnología e Inteligencia Artificial en el sector del retail aumenta hasta 40% las ventas, 2022
Since omnichannel is not adopted in the same way in all countries (Piotrowicz & Cuthbertson, 2014), it is relevant to review how brands and consumers in different territories embrace it. Moreover, it is a key issue for the retail sector, which is one of the most important in the generation of jobs for the economy in Colombia, with an increase of 23.4% in sales between 2019 and 2023 and in employed personnel of 2.3% in the same period (DANE, 2023). Given the above, this study aims to shed light on the purchasing behavior of Latin American consumers in integrated channel environments. The goal is to test whether consistency among integrated channels influences retail brand equity in Colombia, understanding that integration is essential to an omnichannel strategy.
-
DANE, 2023Encuesta Mensual de Comercio, 2023
The article is structured as follows. In the introduction, the interests of the study and its rationale are presented; then, in the theoretical framework, the results of the bibliographic review leading to the hypothetical approach are presented. The methodology presents the data on the sample, the scales used for the study, and the data collection instruments, followed by an analysis and a discussion of the results. Finally, the paper concludes with the analysis and discusses the implications, limitations, and future lines of research.
Theoretical and conceptual framework
Differences between multichannel and omnichannel
In recent years, particularly after the pandemic, digital commerce and consumer isolation pressure have forced retailers to include the online channel, making them multichannel retailers (Frasquet et al., 2015). Multichannel focuses on the operation of channels, differentiating physical from digital (Melero et al., 2016; Piotrowicz & Cuthbertson, 2018). Nonetheless, just as retailers were forced to convert to multichannel, they must now integrate channels to respond to consumer demands and become omnichannel retailers.
-
Frasquet et al., 2015Identifying patterns in channel usage across the search, purchase and post-sales stages of shoppingElectronic Commerce Research and Applications, 2015
-
Melero et al., 2016Recasting the customer experience in today’s omni-channel environment [Redefiniendo la experiencia del cliente en el entorno omnicanal]Universia Business Review, 2016
Omnichannel is the evolution of multichannel. The main difference is that instead of operating the channels independently, the channels in the omnichannel are integrated, allowing the consumer to use them simultaneously (Lazaris & Vrechopoulos, 2014; Verhoef et al., 2015). In omnichannel, consumers can access the multiple products and services that brands offer from the comfort of their homes in an integrated shopping experience (Rigby, 2011). The synergy between channels empowers the consumer to interact with them and use them simultaneously (Verhoef et al., 2015). Table 1 shows the main characteristics and differences between omnichannel and multichannel from a brand and consumer point of view.
-
Lazaris & Vrechopoulos, 2014From Multichannel to “Omnichannel” RetailingReview of the Literature and Calls for Research, 2014
-
Verhoef et al., 2015From Multi-Channel Retailing to Omni-Channel Retailing: Introduction to the Special Issue on Multi-Channel RetailingJournal of Retailing, 2015
-
Rigby, 2011The future of shoppingHarvard Business Review, 2011
-
Verhoef et al., 2015From Multi-Channel Retailing to Omni-Channel Retailing: Introduction to the Special Issue on Multi-Channel RetailingJournal of Retailing, 2015
Table 1
Multichannel vs. omnichannel
Multichannel vs. omnichannel
| Multichannel strategy | Omnichannel strategy | |
|---|---|---|
| Concept | Division between channels | Extended channel integration |
| Level of integration | Partial | Total |
| Scope of the channel | Retail channels: store, website, and mobile channel | Retail channels: store, website, social media, consumer touchpoints |
| Consumer relation approach: brands vs. channels | Channel focus on the consumer | Consumer-retail channel-brand focus |
| Targets | Channel targets (sales per channel, experience per channel) | All channels are integrated to offer a holistic consumer experience. |
| Channel Management | By channel / Management of touchpoints between channels and consumers aimed at optimizing the experience with each one / Perceived interaction with the channel | Channel crossover/synergy in the management of channels/touchpoints toward the engagement of a holistic consumer experience/perception of brand integration |
| Consumers | Unable to trigger interaction / Use of parallel channels | Can trigger full interaction / Simultaneous channel usage |
| Retailers | It is not possible to control the interaction of the channels | Full control of the integration of all channels |
| Vendors | Does not adapt to purchasing behavior | Adaptation to purchase behavior depending on the needs of each consumer and product knowledge |
-
Juaneda-Ayensa, Mosquera, and Sierra Murillo (2016)Omnichannel customer behavior: Key drivers of technology acceptance and use and their effects on purchase intentionFrontiers in Psychology, 2016
The brand in omnichannel
The omnichannel experience is particularly related to the brand. A brand with the ability to integrate the different sales channels to offer the consumer a consistent experience in prices, services, products, promotions, information, and processes at each touchpoint during the shopping journey is considered an omnichannel brand. The success of omnichannel depends on the adequate management of the brand at each of the touchpoints (Verhoef et al., 2015).
-
Verhoef et al., 2015From Multi-Channel Retailing to Omni-Channel Retailing: Introduction to the Special Issue on Multi-Channel RetailingJournal of Retailing, 2015
The brand is the most sensitive element of communication of products and services in assessing the omnichannel experience, because it is where the purchase results are channeled. This is mainly because the brand represents the organization in the consumer's mind; hence, managers should be concerned about managing the brand properly (Neslin et al., 2014). Essentially, the challenge for omnichannel brand managers is to make the right choice of sales and communications channels to improve the experience in the shopping journey at each touchpoint the customer has with the brand.
-
Neslin et al., 2014The interrelationships between brand and channel choiceMarketing Letters, 2014
During the shopping journey, consumers encounter the brand at touchpoints, i.e., when they consult a product on the website and then decide to visit the store. In each of these moments, there is an opportunity to add value to the brand through the customer experience, resulting in an overexposure of the brand in the consumer's interaction with it at the different touchpoints (Neslin et al., 2014). Hence, managers must take advantage of consumers' individual assessments at each point to project that assessment throughout the omnichannel strategy (Keller, 2010).
-
Neslin et al., 2014The interrelationships between brand and channel choiceMarketing Letters, 2014
-
Keller, 2010Brand equity management in a multichannel, multimedia retail environmentJournal of Interactive Marketing, 2010
These repeated interactions between the consumer and the brand build an emotional bond and give the omnichannel brand a privileged position compared to online-only retail brands (Frasquet-Deltoro et al., 2021). In addition, they generate belonging, affiliation, and loyalty on the part of consumers, which contributes to positive Net Promoter Score (NPS) ratings (Almquist, Senior, & Bloch, 2016).
-
Frasquet-Deltoro et al., 2021Omnichannel retailer brand experience: conceptualisation and proposal of a comprehensive scaleJournal of Brand Management, 2021
-
Almquist, Senior, & Bloch, 2016The elements of valueHarvard Business Review, 2016
The concept of brand equity
Brand equity refers to the elements that define a brand that confer esteem and awareness in the minds of consumers that impact its economic value. Keller (1993) points out that brand equity levels can be broadly captured in 5 hierarchical aspects, in the following order from the lowest to the highest: brand awareness, brand associations, brand attitude, brand bonding, and brand activity. Aaker (1997) defines these dimensions as: loyalty, quality perception and leadership measures, associations and different measures, brand awareness, and market behavior measures.
-
Keller (1993)Conceptualizing, measuring, and managing customer-based brand equityJournal of Marketing, 1993
-
Aaker (1997)Dimensions of Brand PersonalityJournal of Marketing Research, 1997
In multichannel and omnichannel environments, brand equity is projected in the integrated experience of the channels. Therefore, the construction must be done from the various channels to the total brand strategy so the consumer adds value to the brand, not only from each touchpoint but from the overall consumer experience (Keller, 2010).
-
Keller, 2010Brand equity management in a multichannel, multimedia retail environmentJournal of Interactive Marketing, 2010
Notwithstanding, the generation of brand equity in omnichannel can occur in isolation, i.e., when the sale occurs without the influence of any other marketing measure such as promotions in other channels than the sales channel; or it can occur indirectly, i.e., when the consumer decides to buy due to the influence of communications and promotions in a channel other than the one where the purchase occurs (Keller, 2010). In other words, marketing measures for a specific purpose, such as promoting products, can affect brand equity at other times during the shopping journey. Hence, the complexity of omnichannel management lies in controlling the interactions between the customer, brand, and channel and in reviewing how each touchpoint with the customer affects the performance of the retail brand (Verhoef et al., 2015).
-
Keller, 2010Brand equity management in a multichannel, multimedia retail environmentJournal of Interactive Marketing, 2010
-
Verhoef et al., 2015From Multi-Channel Retailing to Omni-Channel Retailing: Introduction to the Special Issue on Multi-Channel RetailingJournal of Retailing, 2015
Consistency in channel integration
Cross-channel consistency is an essential condition defined as the ability of brands to provide an undifferentiated shopping experience across channels (Gao & Huang, 2021). It is evidenced in the uniformity of services provided in both physical and digital channels (Sousa & Voss, 2006), specifically in the uniqueness of products, prices, offers, communications, payment methods, and technological devices available in any of the company's channels (Rodriguez-Torrico et al., 2020).
-
Gao & Huang, 2021Quality of channel integration and customer loyalty in omnichannel retailing: The mediating role of customer engagement and relationship program receptivenessJournal of Retailing and Consumer Services, 2021
-
Sousa & Voss, 2006Service quality in multichannel services employing virtual channelsJournal of Service Research, 2006
-
Rodriguez-Torrico et al., 2020Have an omnichannel seamless interaction experience! Dimensions and effect on consumer satisfactionJournal of Marketing Management, 2020
It is considered that when there is consistency between sales channels, customers will perceive better quality in the degree of channel integration because they will have greater satisfaction in their shopping journey (Sousa & Voss, 2006). In fact, it is consumers who determine the quality of channel integration. Their perceptions of the company's ability to integrate its channels and their level of satisfaction derived from this ability finally allow them to classify channels as consistent or not (Neslin, 2022). This positive perception of consistency between channels gives consumers confidence, influences their purchasing decisions and therefore benefits brands (Huré et al., 2017; Jocevski et al., 2019).
-
Sousa & Voss, 2006Service quality in multichannel services employing virtual channelsJournal of Service Research, 2006
-
Huré et al., 2017Understanding omni-channel shopping value: A mixed-method studyJournal of Retailing and Consumer Services, 2017
-
Jocevski et al., 2019Transitions towards omni-channel retailing strategies: a business model perspectiveInternational Journal of Retail and Distribution Management, 2019
Companies should not only aim to achieve the greatest possible uniqueness of service experience across channels but also strive to constantly review consumer feedback on their shopping experience derived from consistency across channels to assess the quality of their integration and manage it accordingly.
Hypothesis
Relation between brand equity and perceived channel consistency
In omnichannel, experience satisfaction results from the perceived consistency of the retail mix across channels, i.e., that products, prices, promotions, and services are the same across channels (Huré et al., 2017). The perception of consistency across channels influences brand equity because in omnichannel the brand is exposed to the consumer's assessment in each interaction across channels during the shopping journey (Neslin et al., 2014). Consumers expect products, services, and communications offered and displayed in the different channels to be the same (Carlson et al., 2015). Consequently, the perceived consistency across channels can affect brand equity.
-
Huré et al., 2017Understanding omni-channel shopping value: A mixed-method studyJournal of Retailing and Consumer Services, 2017
-
Neslin et al., 2014The interrelationships between brand and channel choiceMarketing Letters, 2014
-
Carlson et al., 2015Assessing customers’ perceived value of the online channel of multichannel retailers: A two country examinationJournal of Retailing and Consumer Services, 2015
Research addressing the integration of digital and physical channels in multichannel and omnichannel contexts has confirmed that consistency is an essential factor because it positively influences the perception of the services offered (Sousa & Voss, 2006), the perception of channel fluidity (Rodriguez-Torrico et al., 2020; Shen et al., 2018), customer loyalty to the brand (Gao & Huang, 2021), and the service experience in the interaction with different channels (Rodriguez-Torrico et al., 2020). Therefore, it is considered that consistency influences brand equity; hence, the following hypothesis is proposed:
-
Sousa & Voss, 2006Service quality in multichannel services employing virtual channelsJournal of Service Research, 2006
-
Rodriguez-Torrico et al., 2020Have an omnichannel seamless interaction experience! Dimensions and effect on consumer satisfactionJournal of Marketing Management, 2020
-
Shen et al., 2018Channel integration quality, perceived fluency and omnichannel service usage: The moderating roles of internal and external usage experienceDecision Support Systems, 2018
-
Gao & Huang, 2021Quality of channel integration and customer loyalty in omnichannel retailing: The mediating role of customer engagement and relationship program receptivenessJournal of Retailing and Consumer Services, 2021
-
Rodriguez-Torrico et al., 2020Have an omnichannel seamless interaction experience! Dimensions and effect on consumer satisfactionJournal of Marketing Management, 2020
H1: Perceived consistency influences retail brand equity in an integrated channel environment.
Thumbnail
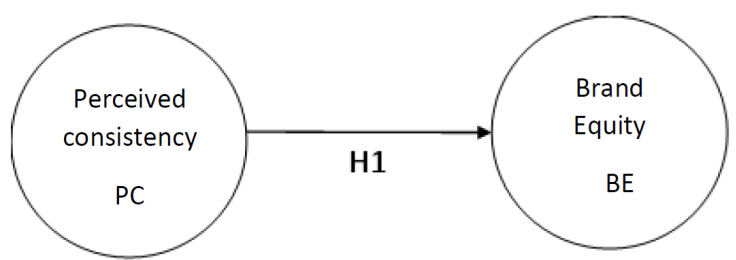
Figure 1
Hypothetical model proposed for the research
Hypothetical model proposed for the research
Methodological design
Context
The research was developed in the city of Bogota during the COVID-19 lockdown. Even during these months, consumers were still figuring out how to adapt to the new living conditions. Nevertheless, in 2020 a 387% growth in e-commerce penetration was reported (Espectador, 2020). However, Colombia is still in a multichannel period, and omnichannel is still growing in the Colombian retail market (Diaz-Pardo, 2020). According to the E-commerce Observatory, consumers visit an average of two channels to consult or search for products or services online (ACIS, 2021), and it is important to analyze how the process of adaptation to multichannel is progressing and whether it is ready for omnichannel.
-
Espectador, 2020Colombia-lidera-el-crecimiento-del-comercio-electronico-en-la-region, 2020
-
Diaz-Pardo, 2020Estudio de la omnicanalidad en el comercio minorista colombiano en el marco del comercio electrónico, 2020
-
ACIS, 2021La Cámara Colombiana de Comercio Electrónico presenta el informe de cierre sobre el comercio electrónico en 2020, 2021
Research, universe, and sampling method
The research design is descriptive in the collection of data. The population universe comprises women and men between 18 and 55 years old, inhabitants of Bogota, who use online and non-retail channels to purchase food and toiletries. The type of sampling carried out was that of convenience that allows selecting those accessible cases that agree to be included, based on the convenient accessibility and proximity of the subjects for the researcher (Otzen & Manterola, 2017), this being the most appropriate due to the lockdown circumstances of the time when the fieldwork was carried out-between April and May 2020.
-
Otzen & Manterola, 2017Técnicas de muestreo sobre una población a estudioInternational Journal of Morphology, 2017
Characteristics of the sample
While 361 observations were collected, only 83 observations were used (those that complied with the condition of using multiple channels). The population universe was made up of inhabitants of Bogota. 41% of the respondents were men and 59% were women. The respondents ranged between 18 and 55 years old, with the majority being between 25 and 34 (42%), followed by people between 25 and 44 (33%). 67% of the respondents were employees, 23% were students, 7% were self-employed, and 3% were unemployed. Table 2 shows the demographic characteristics of the sample population.
Table 2
Characterization of the population sample
Characterization of the population sample
| Gender | Absolute values | Percentage | ||||
| Men | 38 | 46% | ||||
| Women | 44 | 54% | ||||
| Total | 83 | 100% | ||||
| Age | Absolute values | Percentage | Activity | Absolute values | Percentage | |
| Between 18 and 24 | 12 | 14% | Employee | 47 | 56% | |
| Between 25 and 34 | 24 | 29% | Unemployed | 3 | 4% | |
| Between 35 and 44 | 32 | 39% | Pensioner | 2 | 2% | |
| Between 45 and 54 | 12 | 14% | Independent | 16 | 20% | |
| 55 or older | 3 | 4% | Student | 15 | 18% | |
| Total | 83 | 100% | Total | 83 | 100% | |
| Educational level | Absolute values | Percentage | Income | Absolute values | Percentage | |
| Baccalaureate | 4 | 5% | 1 to 3 minimum wages | 23 | 28% | |
| Undergraduate | 40 | 48% | 3 to 5 minimum wages | 26 | 31% | |
| Technical | 7 | 8% | 5 to 7 minimum wages | 18 | 22% | |
| Postgraduate | 32 | 39% | 7 to 9 minimum wages | 7 | 8% | |
| Over 9 minimum wages | 8 | 10% | ||||
| Less than one minimum wage | 1 | 1% | ||||
| Total | 83 | 100% | Total | 83 | 100% | |
Questionnaire items
The questionnaire items were taken from the consumer-based Multidimensional Brand Equity (MBE) scale developed by Yooa and Donthu (2001). The Omnichannel Shopping Value (Omnichannel SV) scale by Huré, Picot-Coupey and Ackermann (2017) was considered for the omnichannel items. Both scales are considered for their statistically proven and validated psychometric qualities. The items that proved most suitable for addressing the concepts of omnichannel, consistency, and brand equity were chosen.
-
Yooa and Donthu (2001)Developing and validating a multidimensional consumer-based brand equity scaleJournal of Business Research, 2001
-
Huré, Picot-Coupey and Ackermann (2017)Understanding omni-channel shopping value: A mixed-method studyJournal of Retailing and Consumer Services, 2017
The questionnaire design was tested by experts in questionnaire design and initially tested to verify the comprehension and clarity of the questions. It was then provided electronically. The operationalization of the variables was done with 5-point Likert-type scales related to the variables of interest.
Table 3
Scales and dimensions used in the questionnaire
Scales and dimensions used in the questionnaire
| PERCEIVED CONSISTENCY BETWEEN CHANNELS | AUTHOR | |
|---|---|---|
| PC-1 | Price: Do you consider that the prices of the products in the different sales locations of the brand you chose are: (Sales locations such as physical stores and online channels). | Huré, Picot-Coupey, and Ackermann (2017) |
| PC-2 | Offers: Do you consider that the offers of the products in the different sales locations of the brand you chose are: (Sales locations such as physical stores and online channels). | |
| PC-3 | Information: Do you consider that the information offered by the brand you have chosen in the different sales locations is: (Sales locations such as physical stores and online channels) | |
| PC-4 | Product diversity: Do you consider that the diversity of products offered by the brand you chose in the different sales locations is: (Sales locations such as physical stores and online channels). | |
| OMNICHANNEL BRAND EQUITY | Boonghee Yooa and Naveen Donthu (2001) | |
| DIMENSION: LOYALTY | ||
| LO-1 | I consider myself loyal to the brand I have chosen. | |
| DIMENSION: PERCEIVED QUALITY | ||
| PQ-1 | I consider that the brand I chose sells products of great quality! | |
| PQ-2 | I can trust that the brand I chose sells the products I want at the prices I'm looking for at the place that suits me! | |
| DIMENSION: BRAND RECALL AND ASSOCIATIONS | ||
| R-A-1 | I can recognize the brand I chose among other competing brands! | |
| R-A-2 | I quickly remember some characteristics of the brand I chose! | |
| R-A-3 | I can quickly remember the symbol or logo of the brand I chose! | |
| R-A-4 | I can bring to my mind the brand I chose with no problem! | |
-
Huré, Picot-Coupey, and Ackermann (2017)Understanding omni-channel shopping value: A mixed-method studyJournal of Retailing and Consumer Services, 2017
-
Boonghee Yooa and Naveen
Donthu (2001)Developing and validating a multidimensional consumer-based brand equity scaleJournal of Business Research, 2001
Analysis of the results
Psychometric characteristics
The psychometric characteristics of the scales were analyzed before contrasting the proposed hypotheses resulting from the theoretical and conceptual research. The proposed model is reflective in nature. According to the literature on brand equity and online channels, the relation of the variables is reflective (Christodoulides et al., 2006). The choice of measurement perspective (formative vs. reflective) is based on the literature findings (Diamantopoulos & Siguaw, 2006).
-
Christodoulides et al., 2006Conceptualising and Measuring the Equity of Online BrandsJournal of Marketing Management, 2006
-
Diamantopoulos & Siguaw, 2006Formative versus reflective indicators in organizational measure development: A comparison and empirical illustrationBritish Journal of Management, 2006
Thumbnail
 Source: created by the author
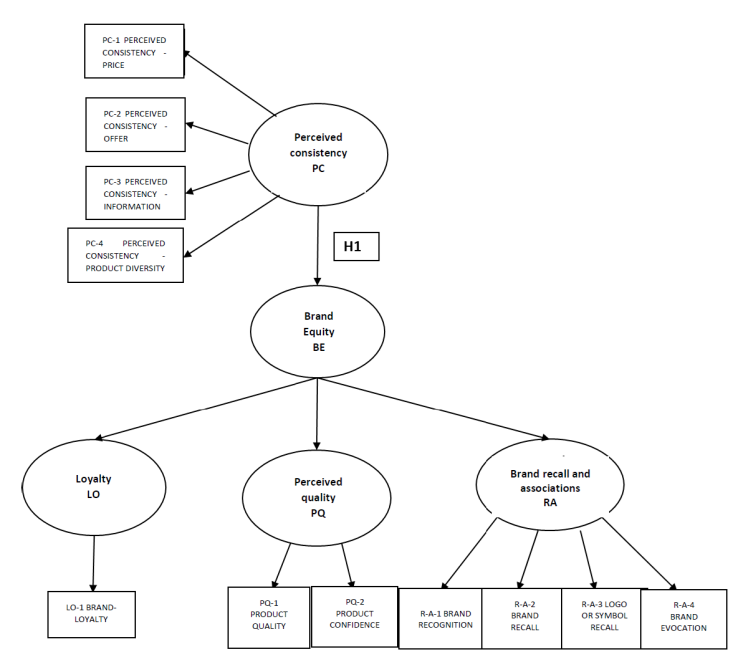
Figure 2
Structural model, variables, and indicators
Structural model, variables, and indicators
Subsequently, the structural equation model was verified using the Partial Least Squares (PLS) method. Internal consistency was checked with the result of p-values and loadings results. Hair et al. (2019) recommend loadings above 0.7 as they indicate that the construct explains more than 50 percent of the variance of the indicator, thus providing an acceptable element of reliability. The statistical significance of the p-values was <0.05, indicating 95% confidence and confirming what is indicated by the theory.
-
Hair et al. (2019)When to use and how to report the results of PLS-SEMEuropean Business Review, 2019
The loading data were revised. After the first estimation of the model in PLS, indicator PC-2 (Perceived Consistency 2) was removed from the PC factor (perceived consistency). This improved the reliability and validity results. As for BE (Brand equity), although the Loyalty (LO) dimension loadings and p-values do not meet these conditions, it is not removed since it is essential to measure the factor. As Manzano and Jimenez (2017) pointed out, the researcher must be aware that automatically removing any indicator with a loading lower than 0.7 may decapitalize content validity.
Cronbach's Alpha (CA) was tested for all latent variables. The CA explains the proportion of the scale's total variance attributed to the latent variable (Manzano & Jimenez, 2017). Values greater than 0.70 demonstrate a good consistency of the construct, which was the case of the results obtained. Consistency was tested with the composite reliability (CR) indicator. According to Hair, Ringle, and Sarstedt, (2011), it should be higher than 0.70 (in exploratory research, 0.60 and 0.70 are considered acceptable). The results obtained show values between 0.80 and 0.90. Table 4 shows the results of the measurement instruments' reliability and convergent validity tests.
-
Manzano & Jimenez, 2017Análisis multivariante aplicado con R., 2017
-
Hair, Ringle, and Sarstedt, (2011)PLS-SEM: Indeed a silver bulletJournal of Marketing Theory and Practice, 2011
Table 4
Reliability, internal consistency, and convergent validity coefficients
Reliability, internal consistency, and convergent validity coefficients
| FACTORS | CONVERGENT VALIDITY | RELIABILITY | |||||
|---|---|---|---|---|---|---|---|
| PERCEIVED CONSISTENCY PC | Item | Loadings | t-values | p-values | CA | CR | AVE |
| PC-1 | 0.755*** | 4.946 | 0.000 | 0.717 | 0.828 | 0.618 | |
| PC-3 | 0.721*** | 4.573 | 0.000 | ||||
| PC-4 | 0.873*** | 12.813 | 0.000 | ||||
| BRAND EQUITY BE | LO | 0.518** | 2.282 | 0.023 | 0.703 | 0.810 | 0.599 |
| PQ | 0.857*** | 6.969 | 0.000 | ||||
| BRA | 0.890*** | 6.567 | 0.000 | ||||
Convergent validity and discriminant validity of the scales
An AVE was used to determine discriminant validity. The Fornell and Larcker criterion and the HTMT coefficient were reviewed. The AVE values must exceed 0.50 (Manzano & Jiménez, 2017). All latent variables yielded a result greater than 0.50 (see Table 1). The Fornell and Larcker coefficient is observed in Table 5 at the square root of the AVE of the latent variables (diagonal values). The AVE should be greater than the correlations of that variable with the rest of the variables (Hair et al., 2011). Table 5 shows the coefficients and correlations of the first-order variables. The square root of the AVE is shown in black.
-
Hair et al., 2011PLS-SEM: Indeed a silver bulletJournal of Marketing Theory and Practice, 2011
Table 5
Fornell-Larcker criterion
Fornell-Larcker criterion
| FACTORS | CORR | AVE |
|---|---|---|
| PERCEIVED CONSISTENCY PC | 0.283 | 0.786 |
| BRAND EQUITY BE | 0.293 | 0.774 |
The HTMT coefficient was obtained by bootstrapping. Values above 0.90 demonstrate problems in discriminant validity. In this respect, all latent variables yield results below 0.90. The HTMT value cannot exceed 0.90 (Manzano & Jiménez, 2017). For conceptually different constructs, HTMT <0.85 (Hair et al., 2019).
-
Hair et al., 2019When to use and how to report the results of PLS-SEMEuropean Business Review, 2019
Table 6
HTMT Index
HTMT Index
| Heterotrait-Monotrait Ratio (HTMT) | Value |
| FACTORS | |
| PC -> BE | 0.334 |
The factorial cross-loadings of indicators show that the loadings of indicators constituting a latent variable are higher on their own latent variable than the values of other variables (Henseler et al., 2009).
-
Henseler et al., 2009The use of partial least squares path modeling in international marketingAdvances in International Marketing, 2009
Table 7
Cross-loadings of the indicators
Cross-loadings of the indicators
| FACTORS | INDIC | PC | BE |
|---|---|---|---|
| PERCEIVED CONSISTENCY PC | PC-1 | 0.756 | 0.218 |
| PC-3 | 0.721 | 0.140 | |
| PC-4 | 0.874 | 0.284 | |
| BRAND EQUITY BE | LO | 0.084 | 0.519 |
| PQ | 0.225 | 0.858 | |
| B-R-A | 0.295 | 0.891 |
Hypothesis testing and predictability of the model
To review the causal relations between the constructs and test the theoretical model, p-values, t-values, and the Q² coefficient were tested, as proposed by Hair et al., (2019).
-
Hair et al., (2019)When to use and how to report the results of PLS-SEMEuropean Business Review, 2019
Hypothesis:
H1: Perceived channel consistency affects brand equity
The results of the t-values and p-values reflect hypothesis H1. The p-values less than 0.05 confirm that the proposed hypothesis is accepted and that there is a relation between consistency and brand equity, where brand equity is positively affected by consistency between channels. The Variance Inflation Factor (VIF) parameter showing the collinearity of the model is less than 3, indicating no collinearity problems (Joe F. Hair et al., 2014).
-
Joe F. Hair et al., 2014Partial least squares structural equation modeling (PLS-SEM): An emerging tool in business researchEuropean Business Review, 2014
Table 8
Hypothetical testing
Hypothetical testing
| Hypothetical relations | Hypothesis | t-values | P-Values | VIF(Col) |
|---|---|---|---|---|
| H1: Perceived consistency -> Brand equity | Accepted | 2.901 | 0.004 | 1.87 |
The Q² index confirms the prediction of the model. Specifically, the literature indicates that a value greater than zero is significant (Hair et al., 2019).
-
Hair et al., 2019When to use and how to report the results of PLS-SEMEuropean Business Review, 2019
Table 9
Stone-Geisser test as a criterion of Q²
Stone-Geisser test as a criterion of Q²
| FACTORS | Q² |
| BRAND EQUITY BE | 0.033 |
Conclusions
This research aimed to elucidate the relation between brand equity and the perception of consistency between sales channels in retail brands. The hypothesis was confirmed. It was possible to verify that there is an impact on brand equity when consumers perceive consistency between physical and virtual channels (website, mobile application, or physical store).
Consistency has been confirmed as essential for integrating retail brand channels in emerging countries. The aim is for consistent communication, distribution, logistics, and pricing across all available channels.
Omnichannel retailing ensures an integrated process that provides an integrated perspective of a product or service to the consumer in terms of purchase, return, and exchange in each channel (Chong, 2018, cited in Adivar et al., 2019, p. 258). Therefore, proper consistency management across channels contributes to the consumer's positive perception of the brand. This reinforces the findings of the work of Huré, Picot-Coupey, and Ackermann, who state that the consistency of an omnichannel experience is evaluated on three elements: product, price, and services, and any failure to meet these expectations is negatively perceived and resented by consumers (Huré, Picot-Coupey, & Ackermann, 2017, p. 321). Consistency immediately benefits retail consumers as it helps lower the perceived risks of the omnichannel experience (Quach et al., 2020).
-
Adivar et al., 2019, p. 258A quantitative performance management framework for assessing omnichannel retail supply chainsJournal of Retailing and Consumer Services, 2019
-
Huré, Picot-Coupey, & Ackermann, 2017, p. 321Understanding omni-channel shopping value: A mixed-method studyJournal of Retailing and Consumer Services, 2017
-
Quach et al., 2020Service integration in omnichannel retailing and its impact on customer experienceJournal of Retailing and Consumer Services, 2022
Implications
Omnichannel is a relevant topic that has advanced significantly but is still under exploration, especially in countries where omnichannel is recent. Practical and academic marketing research has been interested in reviewing how consumers respond in this new environment. Because of their relevance, some topics should be reviewed, such as brand equity (Keller, 2010; Verhoef et al., 2017). Considering that channel consistency is about comprehensive information across all channels, carefully managing the unified strategy across all channels is relevant to maintaining a positive brand equity.
-
Keller, 2010Brand equity management in a multichannel, multimedia retail environmentJournal of Interactive Marketing, 2010
-
Verhoef et al., 2017Consumer Connectivity in a Complex, Technology-enabled, and Mobile-oriented World with Smart ProductsJournal of Interactive Marketing, 2017
Consistency is an essential factor in channel integration studies since, according to research, it impacts consumer perceptions of trust and loyalty (Mainardes et al., 2020; Quach et al., 2020; Shen et al., 2018). Regarding brand equity, it is important to explore further the utility that arises for the consumer from a consistent brand experience across retail channels (Carlson, O'Cass, & Ahrholdt, 2015).
-
Mainardes et al., 2020Omnichannel strategy and customer loyalty in bankingInternational Journal of Bank Marketing, 2020
-
Quach et al., 2020Service integration in omnichannel retailing and its impact on customer experienceJournal of Retailing and Consumer Services, 2022
-
Shen et al., 2018Channel integration quality, perceived fluency and omnichannel service usage: The moderating roles of internal and external usage experienceDecision Support Systems, 2018
-
Carlson, O'Cass, & Ahrholdt, 2015Assessing customers’ perceived value of the online channel of multichannel retailers: A two country examinationJournal of Retailing and Consumer Services, 2015
During the shopping journey, the consumer interacts with the brand through touchpoints. The brand tracks the customers’ journey through these touchpoints, allowing it to determine which are the most important in generating value (Lemon & Verhoef, 2016). In the end, the moment of purchase is where it is concluded which of these points produces the most value for consumers and for the brand (Neslin et al., 2014). This way, retailers can take advantage of the tracking they do to the consumer during their shopping journey and develop strategies to benefit both (Blom et al., 2017). To this end, omnichannel brand managers should focus on developing brand equity in the communicative and strategic aspects to take advantage of the benefits brought by the constant interaction of the brand at each of the touchpoints and ensure that it is positive by providing a positive experience based on the consistency between shopping channels.
-
Lemon & Verhoef, 2016Understanding customer experience throughout the customer journeyJournal of Marketing, 2016
-
Neslin et al., 2014The interrelationships between brand and channel choiceMarketing Letters, 2014
-
Blom et al., 2017Omnichannel-based promotions’ effects on purchase behavior and brand imageJournal of Retailing and Consumer Services, 2017
Limitations
Colombia is still in the multichannel development stage, and omnichannel is only emerging. Although Colombia is a country that is working to improve its technological conditions, it is far behind advanced economies in terms of the value of ICT (Information and Communication Technologies) assets (MinTic-Colombia, 2019). Accordingly, the country is in a process of technological development that promotes the use of devices and technologies for its population. The development of omnichannel is not uniform throughout the world. Some markets and sectors are ahead, while others are trying to replicate the emerging model (Piotrowicz & Cuthbertson, 2019). This conditions the results of the study.
-
MinTic-Colombia, 2019Plan TIC 2018-2022, 2019
-
Piotrowicz & Cuthbertson, 2019Exploring omnichannel retailing: Common expectations and diverse realities. Exploring Omnichannel RetailingCommon Expectations and Diverse Realities, 2019
On the other hand, there is still no balance between the preference for digital and physical channels, and this was evidenced in the sample (only 83 people out of 361 answered the omnichannel experience filter questions correctly). The Ministry of Technologies and Communication in Colombia states that only 2 out of every 10 internet users over 15 years of age perform e-commerce (Buy and pay online) (MinTic-OE, 2019).
-
MinTic-OE, 2019Plan TIC 2018-2022, 2019
Future lines of research
Future lines of research regarding branding are linked to technological developments that support retailers’ branding strategies. Based on big data, leveraging consumer knowledge will be essential to take advantage of data generated at touchpoints and along the consumer journey. This will be the new way to find what consumers want to say about their experience in the various channels.
Referencias
- Aaker, J. L. (1997). Dimensions of Brand Personality. Journal of Marketing Research, 34(3), 347-356. https://doi.org/10.1177/002224379703400304 Links
- ACIS. (2021, April). La Cámara Colombiana de Comercio Electrónico presenta el informe de cierre sobre el comercio electrónico en 2020. https://acis.org.co/portal/content/noticiasdeinteres/la-c%C3%A1mara-colombiana-de-comercio-electr%C3%B3nico-presenta-el-informe-de-cierre-sobre-el-comercio . Consultado 2/02/2023 Links
- Adivar, B., Hüseyinoğlu, I. Ö. Y., & Christopher, M. (2019). A quantitative performance management framework for assessing omnichannel retail supply chains. Journal of Retailing and Consumer Services, 48(June 2018), 257-269. https://doi.org/10.1016/j.jretconser.2019.02.024 Links
- Aldas Manzano, J., & Uriel Jimenez, E. (2017). Análisis multivariante aplicado con R. (E. P. S.A. (ed.)). Links
- Almquist, E., Senior, J., & Bloch, N. (2016). The elements of value. Harvard Business Review, 94(9), 47-53. Links
- Blom, A., Lange, F., & Hess, R. L. (2017). Omnichannel-based promotions’ effects on purchase behavior and brand image. Journal of Retailing and Consumer Services, 39, 286-295. https://doi.org/10.1016/j.jretconser.2017.08.008 Links
- Carlson, J., O’Cass, A., & Ahrholdt, D. (2015). Assessing customers’ perceived value of the online channel of multichannel retailers: A two country examination. Journal of Retailing and Consumer Services, 27, 90-102. https://doi.org/10.1016/j.jretconser.2015.07.008 Links
- Christodoulides, G., De Chernatony, L., Furrer, O., Shiu, E., & Abimbola, T. (2006). Conceptualising and Measuring the Equity of Online Brands. Journal of Marketing Management, 22(7-8), 799-825. https://doi.org/10.1362/026725706778612149 Links
- DANE. (2023, March 15). Encuesta Mensual de Comercio (EMC). Links
- Diamantopoulos, A., & Siguaw, J. A. (2006). Formative versus reflective indicators in organizational measure development: A comparison and empirical illustration. British Journal of Management, 17(4), 263-282. https://doi.org/10.1111/j.1467-8551.2006.00500.x Links
- Diaz Pardo, L. (2020). Estudio de la omnicanalidad en el comercio minorista colombiano en el marco del comercio electrónico. (Doctoral dissertation, Universidad EAFIT). Links
- Espectador, E. (2020). Colombia-lidera-el-crecimiento-del-comercio-electronico-en-la-region. https://www.elespectador.com/especiales/colombia-lidera-el-crecimiento-del-comercio-electronico-en-la-region-articulo-919157/%0A . Consultado 14/09/2023 Links
- Frasquet-Deltoro, M., Molla-Descals, A., & Miquel-Romero, M.-J. (2021). Omnichannel retailer brand experience: conceptualisation and proposal of a comprehensive scale. Journal of Brand Management, 28, 388-401. https://doi.org/10.1057/s41262-021-00233-x Links
- Frasquet, M., Mollá, A., & Ruiz, E. (2015). Identifying patterns in channel usage across the search, purchase and post-sales stages of shopping. Electronic Commerce Research and Applications, 14(6), 654-665. https://doi.org/10.1016/j.elerap.2015.10.002 Links
- Gao, M., & Huang, L. (2021). Quality of channel integration and customer loyalty in omnichannel retailing: The mediating role of customer engagement and relationship program receptiveness. Journal of Retailing and Consumer Services, 63(March), 102688. https://doi.org/10.1016/j.jretconser.2021.102688 Links
- Hair, Joe F., Ringle, C. M., & Sarstedt, M. (2011). PLS-SEM: Indeed a silver bullet. Journal of Marketing Theory and Practice, 19(2), 139-152. https://doi.org/10.2753/MTP1069-6679190202 Links
- Hair, Joe F., Sarstedt, M., Hopkins, L., & Kuppelwieser, V. G. (2014). Partial least squares structural equation modeling (PLS-SEM): An emerging tool in business research. European Business Review, 26(2), 106-121. https://doi.org/10.1108/EBR-10-2013-0128 Links
- Hair, Joseph F., Risher, J. J., Sarstedt, M., & Ringle, C. M. (2019). When to use and how to report the results of PLS-SEM. European Business Review, 31 (1), 2-24. https://doi.org/10.1108/EBR-11-2018-0203 Links
- Henseler, J., Ringle, C. M., & Sinkovics, R. R. (2009). The use of partial least squares path modeling in international marketing. Advances in International Marketing, 20(2009), 277-319. https://doi.org/10.1108/S1474-7979(2009)0000020014 Links
- Huré, E., Picot-Coupey, K., & Ackermann, C. L. (2017). Understanding omni-channel shopping value: A mixed-method study. Journal of Retailing and Consumer Services, 39(June), 314-330. https://doi.org/10.1016/j.jretconser.2017.08.011 Links
- Juaneda-Ayensa, E., Mosquera, A., & Murillo, Y. S. (2016). Omnichannel customer behavior: Key drivers of technology acceptance and use and their effects on purchase intention. In Frontiers in Psychology (Vol. 7, Issue JUL). https://doi.org/10.3389/fpsyg.2016.01117 Links
- Jocevski, M., Arvidsson, N., Miragliotta, G., Ghezzi, A., & Mangiaracina, R. (2019). Transitions towards omni-channel retailing strategies: a business model perspective. International Journal of Retail and Distribution Management, 47(2), 78-93. https://doi.org/10.1108/IJRDM-08-2018-0176 Links
- Keller, K. L. (2010). Brand equity management in a multichannel, multimedia retail environment. Journal of Interactive Marketing, 24(2). https://doi.org/10.1016/j.intmar.2010.03.001 Links
- Keller, K. L. (1993). Conceptualizing, measuring, and managing customer-based brand equity. Journal of Marketing,, 57(1), 1-22. https://doi.org/10.2307/1252054 Links
- La Republica. (2022, August 27). El uso de tecnología e Inteligencia Artificial en el sector del retail aumenta hasta 40% las ventas. https://www.larepublica.co/empresas/el-uso-de-tecnologia-e-inteligencia-artificial-en-el-retail-aumenta-hasta-40-las-ventas-3433686 . Consultado 27/08/2022 Links
- Lazaris, C., & Vrechopoulos, A. (2014). From Multichannel to “Omnichannel” Retailing: Review of the Literature and Calls for Research. https://doi.org/10.13140/2.1.1802.4967 Links
- Lemon, K. N., & Verhoef, P. C. (2016). Understanding customer experience throughout the customer journey. Journal of Marketing, 80(6), 69-96. https://doi.org/10.1509/jm.15.0420 Links
- Mainardes, E. W., Rosa, C. A. de M., & Nossa, S. N. (2020). Omnichannel strategy and customer loyalty in banking. International Journal of Bank Marketing, 38(4), 799-822. https://doi.org/10.1108/IJBM-07-2019-0272 Links
- Melero, I., Javier Sese, F., & Verhoef, P. C. (2016). Recasting the customer experience in today’s omni-channel environment [Redefiniendo la experiencia del cliente en el entorno omnicanal]. Universia Business Review, 2016(50). Links
- MinTic-Colombia. (2019). Plan TIC 2018-2022. Bogotá: MinTic. Links
- Neslin, S. A., Jerath, K., Bodapati, A., Bradlow, E. T., Deighton, J., Gensler, S., Lee, L., Montaguti, E., Telang, R., Venkatesan, R., Verhoef, P. C., Zhang, Z. J., Lett, M., Neslin, S. A., Jerath, K., Lee, L., Bodapati, A., Bradlow, E. T., Zhang, Z. J., … Montaguti, E. (2014). The interrelationships between brand and channel choice. Marketing Letters 25, 319-330. https://doi.org/10.1007/s11002-014-9305-2. Links
- Nielsen. (10 de 06 de 2020). Obtenido de covid-19 has flipped the value proposition of omnichannel shopping for constrained consumers: Obtenido de covid-19 has flipped the value proposition of omnichannel shopping for constrained consumers: https://www.nielsen.com/us/en/insights/article/2020/covid-19-has-flipped-the-value-proposition-of-omnichannel-shopping-for-constrained-consumers/#:~:text=Nielsen's%20Global%20New%20Shopper%20Normal,before%20the%20COVID%2D19%20pandemic.&text=In%20May%20202 . Consultado 10/02/2023 Links
- Otzen, T., & Manterola, C. (2017). Técnicas de muestreo sobre una población a estudio. International Journal of Morphology, 35(227), 232. Links
- Piotrowicz, W., & Cuthbertson, R. (2019). Exploring omnichannel retailing: Common expectations and diverse realities. Exploring Omnichannel Retailing: Common Expectations and Diverse Realities, 1-288. https://doi.org/10.1007/978-3-319-98273-1 Links
- Quach, S., Barari, M., Moudrý, D. V., & Quach, K. (2022). Service integration in omnichannel retailing and its impact on customer experience. Journal of Retailing and Consumer Services, 65, 102267. https://doi.org/10.1016/j.jretconser.2020.102267 Links
- Rigby, D. (2011). The future of shopping. Harvard Business Review, 89(12), 65-76. https://doi.org/10.1007/978-1-349-14797-7 Links
- Rodríguez-Torrico, P., Trabold Apadula, L., San-Martín, S., & San José Cabezudo, R. (2020). Have an omnichannel seamless interaction experience! Dimensions and effect on consumer satisfaction. Journal of Marketing Management, 36(17-18), 1731-1761. https://doi.org/10.1080/0267257X.2020.1801798 Links
- Shen, X. L., Li, Y. J., Sun, Y., & Wang, N. (2018). Channel integration quality, perceived fluency and omnichannel service usage: The moderating roles of internal and external usage experience. Decision Support Systems, 109, 61-73. https://doi.org/10.1016/j.dss.2018.01.006 Links
- Sousa, R., & Voss, C. A. (2006). Service quality in multichannel services employing virtual channels. Journal of Service Research, 8(4), 356-371. Links
- Verhoef, P. C., Kannan, P. K., & Inman, J. J. (2015). From Multi-Channel Retailing to Omni-Channel Retailing: Introduction to the Special Issue on Multi-Channel Retailing. Journal of Retailing, 91(2), 174-181. https://doi.org/10.1016/J.JRETAI.2015.02.005 Links
- Verhoef, P. C., Stephen, A. T., Kannan, P. K., Luo, X., Abhishek, V., Andrews, M., Bart, Y., Datta, H., Fong, N., Hoffman, D. L., Hu, M. M., Novak, T., Rand, W., & Zhang, Y. (2017). Consumer Connectivity in a Complex, Technology-enabled, and Mobile-oriented World with Smart Products. Journal of Interactive Marketing, 40, 1-8. https://doi.org/10.1016/J.INTMAR.2017.06.001 Links
- Yoo, B., & Donthu, N. (2001). Developing and validating a multidimensional consumer-based brand equity scale. Journal of Business Research, 52(1), 1-14. https://doi.org/10.1016/S0148-2963(99)00098-3 Links