


 nueva página del texto (beta)
 Inglés (pdf)
 Artículo en XML
 Referencias del artículo
 Enviar artículo por email
 Citado por SciELO
  Similares en
SciELO
Similares en
SciELO 
 Permalink
Introduction
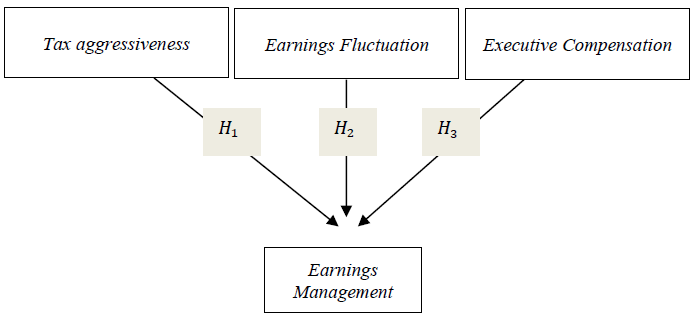
Is there a relation between tax aggressiveness, earnings fluctuation, executive compensation, and earnings management? The use of discretionary accruals as a window to manage earnings is characterized by Pham, Chung, Roca and Bao (2017) as an opportunistic way to transfer favorable private information related to the company's future performance. The authors pointed out that earnings management practices are positively related to some future increase in the companies’ dividends, confirming that managers use discretionary accruals to speculative means.
In general, earnings management occurs because of two main reasons. First, it provides an efficient way for managers to disclose private information - it is easier for investors to predict future earnings with smoother and easily predictable earnings. Secondly, it can be a mechanism to change the company's results in order to deceive analysts and investors and improve managerial careers or even to increase the compensation levels between managers themselves (Li & Richie, 2016).
This study contributes to the literature in different ways. Although earnings management has been studied in association to several factors, such as corporate performance (Gong, Louis, & Sun, 2008; Wu, Ting, Lu, Nourani, & Kweh, 2016), corporate social responsibility (Prior, Surroca, & Tribó, 2008; Choi, Choi & Byun, 2018; Jordaan, De Klerk, & Villiers, 2018), corporate governance and ownership structure (Siregar, & Utama, 2008; Maswadeh, 2018; Ramachandran, Ngete, Subramanian, & Sambasivan, 2015; Yasser & Soliman, 2018), it has not yet been analyzed in the exact same way as investigated here, which includes tax aggressiveness, measured by Abnormal Book-Tax Differences (abnormal BTD), fluctuation of profits, and executive’s compensations, regarding their relation with earnings management.
In Brazil, research about earnings management has advanced especially due to the growing concern about such practices. These concerns surround both users of accounting information as well as its regulators. Nevertheless, research in this area still contains some gaps that demand academic attention (Martinez, 2013). For instance, recent studies have investigated the influence of corporate governance (Mazzioni, Prigol, Moura, & Klann, 2015; Konraht, Soutes, & Alencar, 2016), independent auditing (Silva, Pletsch, Vargas, Fazolin, & Klann, 2016; Martinez & Moraes, 2017), IFRS impacts (Cardoso, Souza & Dantas, 2015; Rodrigues & Niyama, 2018), as well as other specific factors on earnings management, however, it is still unclear whether the earnings management has any relation with abnormal BTD (used as a measurement for tax aggressiveness), profits fluctuation and executive’s remuneration in the Brazilian market.
In addition, the present study may be useful for regulators and all kinds of investors as a way to know the particularities of earnings management in the Brazilian market, and how it is affected by such an economy. Thus, the study proposes not only to fill a gap in the literature, considering that tax aggressiveness, earnings fluctuation and executives’ compensations has not yet been investigated, but also to increase the earnings management’s literature and the level of understanding in the Brazilian market. Finally, the study contributes to the existing literature on earnings management, as well as a subsequent increment in understanding the mechanisms that facilitate and inhibit such behaviors, which justifies the investigation.
That is what motivated us to examine the relation between executive compensation, tax aggressiveness, earnings fluctuation, and earnings management in public companies listed on the Brazilian stock exchange.
For this research we choose to use the modified Jones Model because it is commonly used as a proxy to address earnings management by considering discretionary accruals as a way to measure these artificial earnings (Alzoubi, 2016, Amidu & Yorke, 2017, Alareeni, 2018, Hamza & Kortas, 2018, Park, 2018). Not only is it commonly used, someone also considers the model to be the best way to gain information about a company’s earnings management. For instance, Dechow, Sloan and Sweeney (1995) say that they consider the modified Jones model to be the most appropriate because it shows the greatest power in the detection of managed results. This practice is considered a problem not only to shareholders, but also a subject of concern and interest to regulators, accountants and society as a whole (Elias, 2002).
Literature review and hypothesis development
Tax aggressiveness
Tax aggressiveness was considered by some studies (Lee & Swenson, 2011; Putri, Rohman & Chariri, 2016; Kurniasih, Sulardi & Suranta, 2017; Hamza & Kortas, 2018) as an influencer of earnings management. Considering the possibility that discretionary accruals could have a significant effect on taxable income, Lin (2006) investigated whether foreign investors in China's economy used the management of accounting results in order to take some advantage of lower available tax rates. The author’s results confirmed that hypothesis and exposed how companies adjust discretionary accruals to anticipate some changes in tax rates. Also, it was shown that companies tend to report higher accruals - meaning here higher earnings - in the previous year of a known tax rate increase, so that they can dodge some tax paying. Thus, changes in tax rates create incentives for companies to record transactions in one period rather than another. This demonstrates how tax effects may be considered within the determinant factors for earnings management.
Plesko’s study (2007) also considers that managers can opportunistically mitigate the taxable amount within the company’s activity, recognizing more gains in periods where the tax rates are lower. These results are consistent with the hypothesis that firms are prone to manage earnings upwards when they go through periods which are seen as having lower tax rates.
Similarly, Lee and Swenson (2011) identified that tax effects have a strong effect on earnings management for US and Canadian companies, although they are not influential for companies in Hong Kong, Japan, Korea, and Taiwan. According to the authors, US and Canadian companies operating in higher tax years are more likely to use real earnings management to accelerate discretionary spending and thereby reduce the basis for tax purposes. The research’s results may also have political implications, as when countries raise tax rates for only a year, companies react by managing earnings through increased discretionary spending to reduce tax payments for that specific year.
Putri et al. (2016) investigated whether the tax avoidance strategy could be used as an indicator instrument to evidence companies that manage results in Indonesia. It was shown that indeed the tax avoidance strategy positively affects the management of earnings.
Lee, Park, and Jung (2017) study’s results show that shareholders that have control over the company tend to manage its earnings to anticipate transactions involving stock gifts. The curiosity here is that earnings management from this specific group is only observed in stock gifts, both for themselves, as well as for individuals from family members or so on. They also pointed out that as donation taxes are charged based on the average market value of shares transferred for a certain period in Korea, known as the appraisal period, controlling shareholders are encouraged to manage results in an attempt to reduce stock prices during that period to relieve the tax burden.
Using a sample of non-financial corporations listed on the Indonesian stock exchange, Kurniasih et al. (2017) identified that the tax avoidance, measured by the effective tax rate (ETR), was positively related to earnings management - measured by discretionary accruals.
Hamza and Kortas (2018) studied the modified Jones model using discretionary accruals to measure earnings management. The authors used a sample of Tunisian firms and examined the data with the use of a simultaneous set of equations and panel data. The results of the study highlighted that the size of the company and degree of accounting flexibility are the main factors that stimulate managers to decide to manage results. It was shown that small firms are more involved in these behaviors of managing results, rather than larger companies. They also showed that by reducing accounting’s flexibility, Tunisian’s companies tend to higher levels of earnings management and increases in accounting earnings.
The study conducted by Brunozi Junior, Kronbauer, Martinez and Alves (2018) researched the Brazilian literature and standards for operations that copes with different ways of recognition in financial and tax accounting, that are considered in normal BTDs, which have non-discretionary perspectives for companies. Nine operations were used (inventories, property, plant and equipment, intangible assets/ deferred charges, interest on equity, foreign earnings, tax loss, exchange variation and changes in sales revenues), each one as a variable to a regression that was made with normal BTD as the dependent variable (earnings before taxes - tax expenses / 0.34). Residual errors of regressions were considered as abnormal BTD, a portion not explained by normal BTDs. The results of the study showed that abnormal BTD are indicative for the company to increase accounting earnings, as well as manipulate tax earnings by accruals to meet personal demands and opportunistic motivations of managers.
Regarding incentives to manage earnings on behalf of tax purposes, Hamza and Kortas (2018) have demonstrated that Tunisian companies indeed do accelerate their discretionary spending for tax considerations. In this way, the reduction of the amount of earnings taxable is achieved due to the management of results, accelerating companies’ discretionary expenses. This is possible since many components of the accruals are partially deductible from the tax base.
More recently, Amidu and Acquah (2019) found a significant and positive association between tax aggressiveness and earnings management in the Ghana market. Their sample had both financial and non-financial firms and non-listed as well. They also identified a positive association between tax aggressiveness and other control variables such as total assets, growth and firm age. On the other hand, leverage had a negative association.
Aiming to identify the relationship between tax aggressiveness and earnings management, Susanto et al (2019) verified that the more tax aggressive the firms are, the more They tend to manage their earnings. So, there is a positive relation between them.
Brunozi Júnior et al. (2019) enlarged the tax aggressiveness research valuations by estimating econometric models that only get accounting earnings management and the abnormals BTD. The authors found that abnormal BTD showed positive associations with discretionary accruals, but negative with tax compliance, which brings to light that the use of abnormal BTD as a proxy for tax manipulation are adequate.
Tang (2020) analyzed the suitability of the following tax aggressiveness proxies at the Chinese context: ETR, BTD and abnormal BTD. Tang (2020) pays attention to the discussion of methods that capture regulatory differences between accounting and tax standards. In this sense, the analysis of relations between tax aggressiveness and earnings management was studied in Brazil by Morais and Macedo (2020) for a sample with 201 firms during 2012 to 2016. Their results show that earnings management can explain abnormal BTD levels.
Stoduto et al (2020) analyzed the relations among Abnormals BTD, income smoothing and real activities earnings management in Brazilian Market listed companies. The research’s results showed a positive relation among these variables, which brings some impact to the accounting information quality.
Similarly, Tardin and Oliveira (2021) discloses that in crisis times, firms manage their earnings downwards and are less likely to be tax aggressive as a way to avoid taxes. The authors affirm that in crisis times small profits are more acceptable, so the environment is understood as more friendly. On the Other hand, results show that during economic crisis times earnings management and tax aggressiveness should not happen simultaneously.
Pais and Dias (2022) compared big and small companies and disclosed that firms which get simplified tax regimes tend to manage less of their earnings, meanwhile companies that attend to the general tax regime, that is profit based, have a higher level of earnings management.
In agreement the above displayed reasoning the hypothesis H1 of the present study was formulated, as follows:
H1: There is a significant and positive relation between tax aggressiveness and earnings management.
Fluctuation of earnings
Smoothing results can be a mechanism used in order to avoid excessive fluctuation of earnings. According to Hunt, Moyer and Shevlin (2000), the minor variability of earnings induced by management of earnings based on discretionary accruals is associated with a higher constancy of earnings and a lower standard deviation of future earnings. Thus, managers may be motivated to use discretionary accruals to reduce this variability and increase the quality and persistence of the company’s earnings.
The results of Kanagaretnam, Lobo, and Mathieu (2004) support the hypothesis that results management is possible by means of using provisions for loan losses, in order to reduce the fluctuation of earnings. Such results are important for the market at a time when the variability of earnings is associated with the risk associated with the company and consequently with the cost of capital.
Kanagaretnam et al. (2004) argued that the literature on earnings management shows that the market demands a higher premium for the earnings volatility, creating incentives for managers to smooth earnings in order to reduce the cost of capturing resources. This smoothing is achieved by reducing reported earnings when actual earnings are high and increasing them when they are actually low. Thus, managers have incentives to soften gains and consequently reduce large fluctuations in earnings in periods of such variation.
Jiraporn, Miller, Yoon and Kim (2008) found that earnings management as not being something harmful to companies as a whole, because it improves the value of the information on earnings, although they also report that the manipulation of information on earnings may have been the main cause of large bankruptcies.
For Ewert and Wagenhofer (2011), a good parameter to evaluate earnings’ quality requires the consideration of several variables, such as the accounting standards used, the incentives to manage results, the institutional environment and the degree of information retained by managers. Although there is no proxy that captures the quality of earnings correctly under all circumstances, the notion of earnings qualities can be captured in some approximation. I.e., by the degree of risk reduction, associated with the firm's cash flows (Ewert & Wagenhofer, 2011). In order to keep cash flow as constant as possible and to achieve higher earnings quality, managers can use management tools such as income smoothing, as demonstrated by Scott (2012). Managers can smooth the reported earnings over time, which reduces the variability of accounting results and turn them more stable over time.
Li and Richie (2016) found out that earnings management through income smoothing is a significant determinant of the cost of capital, and that firms that smooth their income have a lower cost of resources contracting. More stable results provide greater investment security and can lead to a reduction in the company’s cost of capital.
Aiming to investigate if listed banks in Jordan use discretionary provisions as earnings managements, Abu-Serdaneh (2018) found out a positive relation between profit variation and earnings management. Results are consistent to the income smoothing hypothesis, intending disclosure of a less volatile market position.
Menicucci (2020) says that earnings fluctuation high-level firms take more risks when compared to the others and that happen due to their higher earnings volatility. Augustiani et al. (2020) found similar results and concluded that managers try to present more persistent earnings as the market prefers it. In this way, they say that higher earnings fluctuations in previous periods shows a trend to manage earnings.
Still, Salem et al (2020) consider that banks use voluntary disclosure to reduce information asymmetry and uncertainty risk. On the other hand, managers may disguise their opportunistic behaviors also by increasing voluntary disclosure. The authors showed evidence that the voluntary disclosure quality has a negative impact on the earnings management practices as the institutional environment is averse to unethical practices, and somehow earnings management can be seen as one of those attitudes.
To De Luca et al (2021), enforcement and a corporate governance environment result in highest levels of stakeholders protection and more contractual warranties. We should not forget that Brazil is a developing economy, so the institutional environment tends to be more fragile than countries with developed economies.
Stander (2021) discloses that earnings volatility has a negative impact on the firm value, that's why it is considered a good proxy to the business risk. The earnings quality measure takes into account its persistence. So in companies where the level of profit fluctuation is high the earnings management is used to reduce the business risk visibility.
In this means, the hypothesis H2 of the study was formulated as follows:
H2: There is a significant and positive relation between earnings fluctuation and earnings management.
Executive compensation
Healy (1985) identified that executive managers manipulate earnings through discretionary accounting decisions to maximize their bonuses in accordance with corporate compensation plans. Dechow and Skinner (2000) find that managers have strong incentives to engage in earnings management strategies.
Based on the hypothesis that accruals give managers a sensitive opening strategy to maximizing their compensation, Gao and Shrieves (2002) showed that the intensity of earnings management is related to the design of executive’s compensation contracts, and the values of the bonuses and stock options are positively related to the use of discretionary accruals. In the discussion of how manager remuneration can influence earnings management, the authors defend the idea that managers use discretionary accruals to maximize their own compensation, characterizing earnings management from an opportunistic and selfish perspective.
Baker, Collins, and Reitenga (2003) examined whether stock option-based compensation could be associated with the opportunistic use of discretionary accruals as a way to earnings management. Since the use of options may generate incentives to manage earnings downward, in order to reduce the price of options temporarily, the authors present evidence that the use of discretionary accruals is influenced by stock option-based compensation. The results suggest that the use of the stock option as a form of compensation creates a different type of incentives for managing results when compared to the payment of bonuses. This occurs since when using options compensations, managers tend to reduce the earnings, while with bonuses payment compensations, the incentives created is to increase earnings through discretionary accruals.
Bergstresser and Philippon (2006) study showed that the use of discretionary accruals to manage results was more evident in companies where the potential remuneration of the CEO was linked to the value of shares and options. The evidence of earnings management associated with CEO’s payment compensations was shown to be strong. The results also showed that periods with high levels of discretionary accruals were also periods where managers had large amounts of options or great volume of shares to be negotiated. To Marcus and Tehranian (2008), the use of discretionary accruals as a form of managing results is high and associated with manager’s incentives.
Similarly, Syariati, Subroto and Andayani (2017) showed that the management of results has a positive association to the amount of compensation obtained through stock option plans. The expected effect of the stock option plans is that they increase managerial responsibility, but managers have abused them to get more benefits for themselves. The authors consider that the management of results is a way to achieve their own benefits, but they can be reduced through more rigid institutional control mechanisms, as well as higher control from the directors’ board. Zhou, Wang, Zhang and An (2018) demonstrated that pressure on the Chief Executive Officer (CEO) is one of the main factors in managing results conduct.
Park (2019) aimed to find association peer firms with executive remuneration and earnings management at the SEC with a sample of 14,319 observations, excluding governmental and financial services companies. The research results reveal that for peer firms there is a positive association which is stronger when there is CEO duality.
Li and Thibodeau (2019) sought to find association between contingent compensation to executives and earnings management. Their conclusions show that linking executive compensation and Corporate Social Responsibilities may be a tool to reduce earnings management incentives.
Assenso-Okofo et al. (2021) found positive relation between executive remuneration and earnings management. The study shows that executives' incentives to manage earnings get smaller the bigger fixed compensation are. Despite that, the executive remuneration formula is still an important instrument to reduce agency conflicts.
For Khenissi et al. (2022) the inclusion of Corporate Social Responsibility (CSR) criteria in the executive compensation contracts might be considered an efficient effort to reduce earnings management. So, one may infer that CSR practices would bring the executives efforts to meet the shareholders' utility.
Recently, Huang and Liu (2022) investigated if CEO gender would be associated to the earnings management practices through discretionary accruals, after CEO remunerations reductions. The authors found that female CEOs are more risk averse and have a higher level of ethical behavior, so they are less likely to manage their companies earnings after cuts in salaries.
These results support the hypothesis that earnings management is strongly associated by CEOs compensation. And, analogously, the hypothesis H3 in this study was formulated as follows:
H3: There is a significant and positive relation between executive remuneration and earnings management.
Methodological design
Selection of data
Data was collected on the GetDFPData platform (Perlin, M. S., Kirch, G., & Vancin, D. (2019). Msperlin platform consists of an academic project that aims to provide free and unrestricted access to a set of corporate data from Brasil, Bolsa, Balcão - B3, Brazilian stock market.
To collect the data we applied some filters in the following order:
Selection of all companies listed in B3’s stock exchange.
The companies should mandatorily be active and in the operational phase - this excluded companies in the preoperational stage, companies in recovery or liquidation, both judicial and extrajudicial, bankrupt and paralyzed ones. In addition, some companies were also excluded from having their negotiations suspended in the stock market for some administrative or judicial order.
The chosen time interval was from the beginning of 2013 to the end of 2019, which consists of an interval of 7 years. In this way, companies that did not have data between 01.01.2013 and 31.12.2019 were excluded.
Companies with missing or incomplete data were also removed.
Adding the above filters, we obtained a total of 117 companies. Considering that some data from 2013 had to be lost in behalf of lag purpose demanded for some variables, in the end there were a total of 702 observations for each variable.
Regression model for estimating abnormal BTD
To determine the Abnormal BTD we study used the proposition of Tang and Firth (2011), as well as Brunozi Júnior et. al. (2018) in Brazil, which adapted the model of abnormal BTD for the Brazilian context.
First, it was necessary to consider a model with the variables that could explain the normal BTD in the Brazilian context, being analyzed as a model for each year. After that, the residues of the model of each of the four years of the sample were determined, which are considered as abnormal BTD, that is, what could not be explained by the model variables and that we considered as tax aggressiveness.
Thus, Equation 1 presents the model with the definition of the explanatory variables of normal BTD, as well as the residuals, considered as abnormal BTD.
Regression model for estimating abnormal BTD
To determine the Abnormal BTD we study used the proposition of Tang and Firth (2011), as well as Brunozi Júnior et. al. (2018) in Brazil, which adapted the model of abnormal BTD for the Brazilian context.
First, it was necessary to consider a model with the variables that could explain the normal BTD in the Brazilian context, being analyzed a model for each year. After that, the residues of the model of each of the four years of the sample were determined, which are considered as abnormal BTD, that is, what could not be explained by the model variables and that we considered as tax aggressiveness.
Thus, Equation 1 presents the model with the definition of the explanatory variables of normal BTD, as well as the residuals, considered as abnormal BTD.
Where, EQ is equity; ST is the company's total stock; FASSET is the company's gross fixed assets; IASSET is the company's intangible asset; IOC is interest on capital; Dummy_FP is a dummy variable that indicates the presence of foreign earnings that gets "1" if the company has had foreign earnings and "0" otherwise; Dummy_TAXLOSS is a dummy variable that indicates the presence of tax losses for the company that gets “1” if the firm has a positive provision for tax and “0” otherwise; SALESVAR is the variation in sales revenue, that is, sales in t minus sales in t-1; Dummy_EXCHANGEVAR is a dummy variable that gets “1” if the company has experienced exchange variations and “0” otherwise; and ε is the error inherent in any model..
Regression model specifications for data analysis
In order to analyze the relevance of the independent variables of tax aggressiveness (abnormal BTD), Earnings Fluctuation (FLOATIN) and Executive Compensation (PAYSD) in determining the dependent variable, Management of Earnings Management (DA), it was needed to find a way to quantitatively measure the amount of earnings that was managed by the agents in the companies.
As it was discussed previously, academic literature in earnings management points out companies’ accruals as a meaningful proxy of earnings management variables. This idea of the association between accrual and management of results is based on the understanding that it is only possible to manage information that arises in the temporal gap between the accrual and cash method. In this sense, a hypothetical company that has all its operations in sight and all its immediate activities without recognition of future assets or liabilities, will not have room for earnings management. Consequently, it is one assumption of the model that only the information that exists as a consequence of the accruals regime are the ones that can or could have been managed.
In order to determine the amount of a company’s accruals, it is sufficient to subtract its result by its operational cash flow, both in the same time period. As follows:
Where
Nonetheless, as far as accruals are concerned, it is by itself only a necessary condition for determining the earnings management, but this information is not enough - it is reasonable to imagine that companies have accruals for legitimate reasons. To determine the share of accruals managed it is necessary to deepen the understanding of that value.
Literature (Jones, 1991; Salleh, & Haat, 2014; Uwuigbe, Uwuigbe, & Okorie, 2015; Bassiouny et al., 2016), attempted to resolve this impasse by dividing accruals into two: discretionary accrual (DA) and non-discretionary accruals (NDA), and it points discretionary accruals as a quantitative measure of earnings management.
To estimate the company's NDA, some models are relevant in the literature, for instance: Healy (1985), De Angelo Model (1986) and Jones (1991). The present work used the Modified Jones Model (1995), where the NDA is calculated with OLS model by year and sector as follows:
Where
Discretionary accruals will be used as a proxy for earnings management and will be calculated as follows:
Where discretionary accruals
As for the independent variables of tax aggressiveness (abnormal BTD), Earnings Fluctuation (FLOATIN) and Executive Compensation (PAYSD), the model was constructed as indicated in Table 1:
Table 1 Definition and operation of variables
| Dependent Variable | Form of Measure |
| Earnings Management (DA) |
Discretionary Accruals (Modified Jones Model, 1995). |
| Independent Variables | Form of Measure |
| Tax Aggressiveness (Abnormal BTD) |
Regression residuals from normal BTD, according to equation 1 (Brunozi Júnior et. al., 2018; Tang & Firth, 2011). |
| Earnings Fluctuation (FLOATIN) |
Natural log of the variation of earnings over a seven year period - 2013 to 2019 (Hunt et al., 2000; Kanagaretnam et al., 2004; Ewert & Wagenhofer, 2011). |
| Boards Directors Managers Remunerations (PAYSD) |
Natural log of total compensation (fixed + variable) of statutory board. |
| Control Variables | Form of Measure |
| Operational Cash Flow (NETCASH) |
Operational Cash Flow divided by total assets (Peasnell, Pope & Young, 2005; Fields, Gupta, Wilkins & Zhang, 2018). |
| Losses (LOSS) |
Dummy variable that assumes ‘1’ when the company has a loss shown by net earnings below zero and ‘0’ otherwise (Huang, Lyu & Lin, 2018). |
| Return on Equity (ROE) |
Ordinary measurement of Return On Equity (Earnings/Equity). |
| Governance_Dummy |
Dummy variable for each governance level in the B3: Level 1; Level 2; New Market and Traditional (reference). Assumes ‘1’ when the company is within the level of governance and ‘0’ otherwise. |
| Sector_Dummy | One dummy variable for each sector of B3: Trade and Distribution; Cyclic consumption; Non-cyclic consumption; Basic materials; Oil, Gas and Biofuels; Cheers; Information Technology; Telecommunications: Public Utility and Industrial Goods (reference). Assignment of ‘1’ for when the company is within the sector and ‘0’ otherwise. |
Source: Author’s own.
The following regression model from Equation 2 was used:
Where
It is worth mentioning that Earnings Fluctuation (FLOATIN) is a hypothesis conceived in the analytical study of Ewert and Wagenhofer (2011) and that this research wishes to test empirically. In this research the authors seek to understand what are the conditions that motivate or inhibit them to introduce a purposive bias to the financial statements.
To do so, they described the utility function of managers based on the work of Fischer and Verrecchia (2000). By maximizing the utility of agents in accordance to the results of Gaussian signal theory, they find that a possible equilibrium point is as follows:
Where b is the bias introduced in the accounting information issued; p is the importance of the price variation of the company's stock for the agent; c is the cost upon the agent to submit a bias in information;
In this way, it can be noted that the equilibrium state that explains the bias has some relevant points:
Bias b increases with p because a greater weight over the market price of the share in the manager's utility function increases the marginal benefit of managing results.
Bias b decreases with the cost c of managing results.
Bias b increases with the original uncertainty about future cash flow,
The bias b decreases with the variance of the error of accountings signals
According to the above, the company's independent earnings fluctuation variable was proposed.
Results and discussion
The analysis will be initiated by the descriptive statistics of the data, followed by the analysis of correlation between the variables and, finally, the results of the regression analysis are shown and discussed - verifying the validity or not of the three raised hypotheses. The model and analysis were run by R program, with the assistance of Office package.
Descriptive statistics of variables
The descriptive statistics shows the mean, standard error, standard deviation, minimum and maximum values, among other information of the dependent and independent variables.
As Table 2 shows, the results indicate that the mean value of the DA (Discretionary Accruals) dependent variable for the selected sample of companies is negative and close to zero, with a standard deviation of approximately 0.004. Both of these DA’s information demonstrates the distribution of earnings management practiced by the firms in this sample. It should be noted that the company that least managed the results presented a negative AD of 1.098 while the company with the highest level of earnings management presented a positive DA of 1.397.
Table 2 Descriptive Statistics
| DA | BTD_Abnormal | FLOATIN | PAYSD | ROE | NETCASH | |
|---|---|---|---|---|---|---|
| Average | 0.000000 | 0.000000 | 23.958635 | 15.635941 | 0.043799 | 0.067836 |
| Standard Error | 0.004260 | 0.006007 | 0.144594 | 0.056333 | 0.018370 | 0.004589 |
| Median | 0.000000 | 0.000005 | 23.772462 | 15.812593 | 0.072615 | 0.062906 |
| Standard Deviation | 0.112871 | 0.159148 | 3.831069 | 1.492559 | 0.486714 | 0.121592 |
| Variance | 0.012740 | 0.025328 | 14.677091 | 2.227733 | 0.236891 | 0.014785 |
| Kurtosis | 49.249473 | 90.638255 | -0.029023 | 3.342031 | 68.053342 | 90.038288 |
| Skewness | 0.559254 | 4.610196 | 0.313755 | -1.177765 | -5.065839 | 4.021641 |
| Range | 2.495830 | 3.521952 | 18.056777 | 10.104951 | 9.967612 | 2.885074 |
| Minimum | -1.098440 | -1.058065 | 16.248540 | 8.849514 | -6.612151 | -0.968496 |
| Maximum | 1.397390 | 2.463887 | 34.305317 | 18.954465 | 3.355460 | 1.916578 |
| Sum | 0.000000 | 0.000000 | 16818.961936 | 10976.430413 | 30.746654 | 47.620900 |
| Number of Observations: 702 | ||||||
Source: Authors’ own.
Turning to the independent variables, the results showed that the average of the tax aggressiveness approximated by Abnormal BTD is close to zero with a maximum of 2.463 and a minimum of a negative 1.058, indicating a wide variation of tax aggressiveness in the sample. Both the variable DA and Abnormal BTD presented low average values due to the calculation of these variables, which used the residuals of regressions of non-discretionary accruals and normal BTD respectively.
As for the fluctuation of earnings (FLOATIN), it presented an average of 23.958 and standard deviation of 0.144, with values 16.248 and 34.305 for minimum and maximum respectively, indicating high rate of earnings changes in the companies’ sample. It was also observed that executive compensation (PAYSD) had an average of 15.635, a standard deviation of 0.056, with a minimum of 8.849 and a maximum of 18.954.
Correlation analysis
We used Pearson correlation matrix to show the degree of correlation between the independent variables. In order to verify that there is no problem of multicollinearity, the correlation between variables should not exceed 0.8, as stated by Bryman and Cramer (1997). Table 3 presents the correlation analysis between the studied variables.
Table 3 Correlation Analysis
| DA | BTD_Abnormal | FLOATIN | PAYSD | ROE | NETCASH | |
|---|---|---|---|---|---|---|
| DA | 1 | |||||
| BTD_Abnormal | 0.076444 | 1 | ||||
| FLOATIN | -0.06269 | 0.020668 | 1 | |||
| PAYSD | 0.005094 | 0.013553 | 0.440384 | 1 | ||
| ROE | -0.02855 | 0.08375 | -0.0114 | 0.027668 | 1 | |
| NETCASH | -0.20003 | 0.040266 | 0.039311 | 0.122068 | 0.005881 | 1 |
Source: Authors’ own.
As shown in Table 3, the highest correlation is between the FLOATIN variable and the PAYSD, with an amount of 0.440384. Thus, it was evidenced that there is no problem of multicollinearity between the independent variables used in this research model, as it does not exceed 0.8.
Regression analysis and results
In order to identify the relation between tax aggressiveness, earnings fluctuation and executive compensation with earnings management, a regression model was constructed. The model was chosen by best performance suitability in the given tests. The Chow’s F test showed that the fixed-effects model was not as adequate as the ordinary least squares model (OLS), due to its p-value reaching a mark above 0.1. The Lagrange Multiplier Test - (Breusch-Pagan) for balanced panels presented a p-value of 0.02, providing support to reject the null hypothesis with at the 5% significance level that the panel effects are not significant, suggesting that the random effects panel is more appropriate than the OLS. Therefore, the random effects model was adopted, and the regression was constructed according to Equation (2) shown in the methodology.
Table 4 shows the regression model with random effects panel using the dependent variable (DA) as an approximation to the amount of discretionary accruals. As we can see in Table 4, to validate the model robustness, we did not find evidence of multicollinearity since the Variance Inflation Factor (VIF) values were under 5. By using the Breusch-Pagan test we had no concerns about heteroscedasticity, as its p-value was bigger than 0.1. The Breusch-Godfrey/Wooldridge test for serial correlation in panel models allows us not to reject the null hypothesis that residuals serial correlation is equal to zero, supporting the residuals Independence. Finally, according to the central limit theorem and considering the sample of 702 observations, the assumption of residuals normal distribution was relaxed (Gujarati & Porter, 2011).
Table 4 Regression model with random effects panel
| Independent Variables | Coefficients | Standard Error | VIF |
| (Intercept) | 0.07897410 | 0.04684268 | — |
| BTD_Anormal | 0.07897410 | 0.04684268 | 1.024036 |
| FLOATIN | -0.00259658* | 0.00138815 | 1.325519 |
| PAYSD | 0.00096151 | 0.00323062 | 1.201840 |
| Control Variables | Coefficients | Standard Error | VIF |
| ROE | -0.02123302** | 0.00848981 | 1.029915 |
| NETCASH | -0.24194036*** | 0.03414046 | 1.034675 |
| LOSS | -0.07335517*** | 0.00950206 | 1.091029 |
| Dummy_Governance(*) | yes | — | 1.058725 |
| Dummy_Sector(*) | yes | — | 1.092079 |
| R² = 0.1345 | F = 0.000 | Number of Observations: 702 | |
| Multicollinearity - Variance Inflation Factor = All < 5 | |||
| Homoscedasticity - Breusch-Pagan test (p-value) = 0.1933 | |||
| Serial autocorrelation - Breusch-Godfrey/Wooldridge test (p-value) = 0.1253 | |||
Dummy_Governance(*): Governance Level 1; Governance Level 2; Governance New Market; Traditional (reference); Dummy_Sector(*): Cyclic consumption; Non-cyclic consumption; Basic materials; Oil, Gas and Biofuels; Cheers; Information Technology; Public Utility and Industrial Goods (reference).
Dependent variable: Earnings Management.
Level of significance: *** 0.01; ** 0.05; * 0.1.
Source:Authors’ own.
Our results on the random effects panel regression model showed that the tax aggressiveness measured by the Abnormal BTD has no association with discretionary accruals, noting that discretionary accruals represent earnings management.
So we cannot accept H1 which establishes that there is positive and significant association between tax aggressiveness and earnings management. On the other hand, several studies confirm the significant relation between BTD, tax aggressiveness and earnings management (Lin, 2006, Plesko, 2007; Lee & Swenson, 2011; Hamza & Kortas, 2018; Lee et al., 2017; Kurniasih et al., 2017), demonstrating earnings management as a form or manipulation strategy to reduce the tax base. Putri et al. (2016) demonstrated that tax avoidance strategies raise the level of earnings management. Our research was led in different paths from the previously presented empirical studies as we used abnormal BTD as tax aggressiveness.
Therefore, our research differs from previous studies on tax aggressiveness and earnings management (for instance, Susanto et al (2019) and Stoduto et al (2020) found positive association). Our results corroborate Tardin and Oliveira’s (2021) evidence in which there is no support to the occurrence of tax aggressiveness and earnings management at same time during crisis periods hypothesis.
More recently Brunozi Junior et al. (2018) presented a similar result, using Abnormal BTD as a proxy for tax aggressiveness. Their study demonstrated a positive relation between discretionary accruals and abnormal BTD in the Brazilian context. We followed the Brunozi Júnior et al (2019) strategy who used abnormal BTD instead of ETR or BTD. Similarly, we also understand that the use of abnormal BTD is an opportunist attitude. Meantime, Brunozi Junior et al. (2018), Brunozi Júnior et al. (2019) and Morais and Macedo (2020) state that discretionary accruals explain abnormal BTD and we considered abnormal BTD as explicative variable of earnings management, what may be considered a reflection for future researches.
Our choice is due to the study of Tang and Firth (2011) that points out that higher-level earnings management companies also have higher levels of abnormal BTD. Unlike Morais and Macedo (2020) we measured discretionary accruals using modified Jones model, but as previously shown we find no significant association between tax aggressiveness and earnings management.
Regarding earnings fluctuation (FLOATIN), a significant association was found at a 10% level but with negative coefficient, indicating that earnings fluctuation leads to lower levels of earnings management - corroborating with Kanagaretnam et al. (2004). Despite the result, it was not possible to confirm the prediction of hypothesis H2 which suggests a positive association between earnings fluctuation and earnings management.
Ewert and Wagenhofer (2011) present, among other factors, incentives for the purposeful bias of earnings management as an important way of assessing the quality of earnings. In this context, the argument used by Jiraporn et al. (2008) shows that management can reveal improvements in the value of earnings information as long as it is not driven by fraud and to a non-harmful limit of manipulation, as also presented by Li and Richie (2016) that earnings management enables a reduction of capital’s cost.
Differently from Abu-Serdaneh (2018) who verified that profit fluctuation is consistent with income smoothing, our result reveals a negative association between earnings management and profit fluctuation. Recent studies as Agustiani et al. (2020) and Menicucci (2020) confirm that public companies prefer disclosure persistent earnings as the market itself like these kind of information as a signal of lower risks. Our result may be related to Scott’s (2012) perspective of earnings management, which states that managers alter periodically their behavior. They tend to, in some periods increase the company’s results in order to gain greater self-benefit, and in others decrease its results aiming to use the disclosure of these earnings for future benefits.
Furthermore, Salem et al. (2020) showed that the quality of voluntary disclosure reduces earnings management in an environment with a strong aversion to unethical practices. However, in Brazil, the capital market still has low adherence to governance practices and little legal protection for investors (Crisostomo et al., 2020; Manzanares & Leal, 2021). According to Martins, Machado e Monte (2021), some of Brazil's important institutional characteristics include weak legal and regulatory systems, weak protection policies for minor shareholders and creditors, a high concentration of ownership, a weak corporate governance structure, a historical strong state influence, and low quality of accounting information. According to these authors, in such environments, managers may find more incentives to act opportunistically, manipulating accounting numbers. Thus, we consider that, according to De Luca et al. (2021), corporate governance and enforcement are essential to reduce earnings management practices, which explains our differences from previous studies.
As for the association of earnings management with executive compensation, we analyzed if the executive remuneration level has any influence on earnings management. This kind of manipulation of earnings by managers can be considered, as explained by Dechow and Skinner (2000), as an incentive to in order to obtain higher compensation and improved level of benefits, aligned with Syariati et al. (2017) that demonstrated that earnings management has a positive association with the increase of manager’s compensations. But differently of Syariati et al. (2017) and Park (2019) we found no statistically significant relation between earnings management and executive compensation.
Our results are not similar to the evidence presented by Assenso-Okofo et al. (2021) and Husni et al. (2021), who found a positive association between executive compensation and earnings management. We found no statistically significant association between compensation and earnings management. Previous studies have also analyzed the inclusion of CSR criteria in compensation (Khenissi et al., 2022) and the gender diversity of the CEO (Huang & Liu, 2022) in relation to earnings management, finding that such characteristics are effective for reducing opportunistic manipulation practices. Thus, ethical and diversity characteristics can be considered as mitigating factors of earnings management practices.
Additionally, the model was tested using the variation in compensation paid to the statutory board rather than annual compensation. However, also no statistical significance was found, indicating that compensation variation is not considered an incentive for managers to manage earnings but the amount of compensation is shown as an incentive for managers to manage results.
Concerning the control variables, Return on Equity (ROE), Operating Cash Flow (CFO), and Loss (LOSS) presented negative and significant association at the level of 5%, 1% and 1% respectively, indicating that performance, presence of operating cash flows and presence of negative net income negatively influence earnings management through the use of discretionary accruals. However, the variables that represent sectors and corporate governance New market (NM), Level 1 (N1) and Level 2 (N2) were not significantly associated. In this way, study’s hypotheses H1, H2 and H3 it was not to confirm.
Conclusions
The present study sought to examine the associations between earnings management, tax aggressiveness, earnings fluctuation and executive compensation using listed companies from the Brazilian stock exchange B3. Also, it was added control variables related to performance, operating cash flow, estimated loss on earnings, governance dummies and sector dummies. This study used free Access data made available by the GetDFPData platform, from 2013 to 2019. The use of 2013 was limited for the purpose of lagging the variable. Finally, quantitative research was performed using a random effects panel.
The random effects panel regression model had less than 0.01 significance in F test, with R2 of 13.45%. The model data presented no problem of multicollinearity, as showed to the low values when VIF was calculated.
Based on the results of the regression model, it is possible to see that only the earnings fluctuation variable (FLOATIN) evidenced was a significant association with a negative coefficient level, indicating that companies with lower earnings fluctuation tend to present higher levels of earnings management, this finding is similar to the findings of Kanagaretnam et al. (2004). As for executive compensation variable (PAYSD) and Abnormal BTD (BTD_Anormal), the results is not show a significant association.
The results of this study are relevant for they have exposed different results from previous studies due to the use of abnormal BTDs, the study enhances the methodology for measuring tax aggressiveness through Abnormal BTD. Additionally, the study enhances the methodology for measuring tax aggressiveness through Abnormal BTD, showing that discretionary accruals are not explained by abnormal BTD but the opposite may occur, according to previous studies (Putri et al., 2016; Brunozi Junior et al., 2018; Brunozi Júnior et al., 2019; Morais & Macedo, 2020). This method is new is the sense that it uses the portion not explained by normal BTDs, generally used by national studies.
As a suggestion for future research on the subject, it is recommended a greater number of control variables as factors that have influence on earnings management, as well as to analyze abnormal BTD as an explained variable and expand the research in different institutional contexts of legislation, cultures and norms of regulatory agencies.

