


Servicios Personalizados
Revista
Articulo
 texto en
  Inglés (pdf)
 Artículo en XML
 Referencias del artículo
 Enviar artículo por email
Indicadores
-
 Citado por SciELO
 -
 Accesos
Links relacionados
-
 Similares en
SciELO
Similares en
SciELO
Compartir

 Permalink
Contaduría y administración
versión impresa ISSN 0186-1042
Contad. Adm vol.67 no.1 Ciudad de México ene./mar. 2022 Epub 10-Sep-2024
https://doi.org/10.22201/fca.24488410e.2022.2956
Articles
Analysis of the quality of public health services with the SERVPERF model: A case in the Isthmus of Tehuantepec
a Universidad del Istmo, México
The objective of this research is to assess the quality of public health services in the Isthmus of Tehuantepec. The study case is concerning the health units that operate in one of the strategic municipalities of the region, since they attend to beneficiaries coming from urban and rural municipalities. For this study, a modified version of the SERVPERF model was applied, which capture user´s perceptions according to five criteria: reliability, responsiveness, security, empathy and tangible elements. The Cronbach´s alpha and confirmatory factor analysis were used to evaluate the internal consistency and the validity of the applied model, respectively. It was found that the IMSS obtained the best evaluations surpassing the Health Center and the General Hospital; the ISSSTE obtained the lowest perceptions. Additionally, age, educational level and occupation are variables that influence the assessment of health services.
JEL Code: L32; L80; M10
Keywords: quality; health services; confirmatory factor analysis; SERVPERF
El objetivo de esta investigación es evaluar la calidad de los servicios públicos de salud en el Istmo de Tehuantepec, tomando como estudio de caso las unidades de salud que operan en uno de los municipios estratégicos de la región, pues ahí se atienden a derechohabientes provenientes de municipios urbanos y rurales. Para ello se aplicó una versión modificada del modelo SERVPERV, el cuál captura las percepciones de los usuarios con base en cinco criterios: fiabilidad, capacidad de respuesta, seguridad, empatía y elementos tangibles. La consistencia interna y validez del instrumento se corroboraron mediante el alfa de Cronbach y análisis factorial confirmatorio, respectivamente. Se encontró que el IMSS obtuvo las mejores valoraciones, superando al Centro de Salud y al Hospital General; el ISSSTE obtuvo las notas más bajas. Adicionalmente, la edad, escolaridad y ocupación son variables que influyen en la valoración de los servicios de salud.
Código JEL: L32; L80; M10
Palabras clave: Calidad; Servicios de salud; Análisis factorial confirmatorio; SERVPERF
Introduction
For several years now, the quality of government services has been questioned. The fact that these services generally fell short of society’s expectations led, among other factors, to the crisis of the legitimacy of public administration in the West. In response to this situation, the administrative model identified as new public management emerged, promoted by the OECD, one of whose central concepts is quality management in the state sphere, and whose core claim was to focus administration on citizens (Ruiz, 2012).
In the case of health services in Mexico, researches such as that of Pedraza et al. (2014) reflect, additionally to a growing interest in the evaluation of their quality, areas of opportunity for improvement, which includes, regardless of certifications, the development of studies focused on the opinion of their users. The preceding was an inspiration for this work, which can be considered relevant because it can provide useful inputs for public policymaking given the current health situation; in addition, there are not many references on the subject in the specific case of Oaxaca.
Therefore, the objective of this applied research is to obtain and analyze, employing the modified SERVPERF model, the clients’ valuation of the governmental health services offered in Ciudad Ixtepec, one of the most important municipalities of the Oaxacan portion of the Isthmus of Tehuantepec.
For this purpose, the article is divided into four sections. The first one analyzes the quality of services, referring to the SERVQUAL and SERVPERF models and their impact on the state sector. The geographic and institutional framework in which it was developed is briefly presented below. The third section explains the methodology used, while the fourth section presents the results on the internal consistency and validity of the instrument applied, in addition to the perceptions of quality by institution and by occupation, age, and educational level of the population according to the dimensions proposed by the model used. Finally, the conclusions are presented.
Quality in services
Concept
As it has been pointed out, although it is frequently used, defining the concept of quality is not a simple task (Parasuraman et al., 1985; Alén, 2006; Colmenares & Saavedra, 2007). For the American National Standards Institute (ANSI) and the American Society for Quality (ASQ), cited by Evans and Lindsay (2005, p. 16), quality represents “the totality of traits and characteristics of a product or service that support its ability to satisfy certain needs.” According to the previous, regardless of its conceptual complexity, quality represents a series of attributes that consumers or clients of a product or service will evaluate as positive or not based on the capacity to satisfy their requirements and expectations. In addition, as Yu and Hyun (2019) state, goods and services are different. Zeithaml et al. (1993) add that service quality assessment is usually more complex than that for products due to three particular features: 1. They are intangible (they represent experiences, not objects) 2. They are heterogeneous (performance varies from one organization to another, from one consumer to another and from one day to another). 3. In general, their production and consumption are inseparable (the quality of services materializes during their delivery, not controlled in a manufacturing plant, as in the case of products).1 These features make it more complex to define specifications for devising and thus standardizing the quality of services.
On the other hand, clients rate the quality of service by considering the final result and the process of receiving the service (Zeithaml et al., 1993).2 It should also be emphasized that the only valid criteria for evaluating the quality of a service are those established by its users. In this sense, and following Cabello and Chirinos (2012), the central aspect in defining and assessing the quality of services, particularly in the health area, is the satisfaction of external users. Thus, the perception of the quality of the service is determined by how the provider organization executes the service, which is contrasted with the consumer’s expectations before receiving the service (Grönroos, 1984). Coincidentally, research results in various service sectors led Zeithaml et al. (1993, p. 21) to indicate that service quality can be defined as “the extent of the discrepancy between clients’ expectations or desires and their perceptions.”
The Service Quality Model (SERVQUAL)
In this model, quality measurement is determined by the difference (gap) between the perceptions (assessment) and expectations (what is expected) expressed by the users of the services. Parasuraman et al. (1985, 1988) developed the SERVQUAL model after asking the following questions: how does the client evaluate the quality of the service, do they make a global evaluation or do they first evaluate the different stages of the service, and if so, which stages do they use to evaluate the service? For them, key variables that define consumer expectations are word-of-mouth communication, personal needs, previous experiences and external communications from the provider organization.3 They also identified ten dimensions that represent the criteria for evaluating service quality on the part of clients: tangibles, reliability, responsiveness, professionalism, courtesy, credibility, security, accessibility, communication, and client comprehension, which form the basis of the SERVQUAL. Since they observed a strong statistical correlation between several dimensions, they integrated some into others, refining the model, as seen in Figure 1, into five criteria: 1. Tangible elements, 2. Reliability, 3. Responsiveness, 4. Safety (comprising professionalism, courtesy, credibility, and security) and 5. Empathy (consisting of accessibility, communication, and client comprehension).4
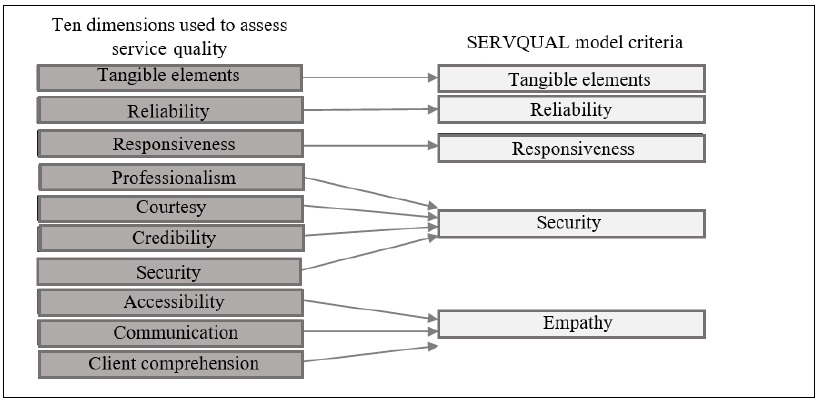
Source: created by the authors based on Parasuraman et al. (1988), Zeithaml et al. (1993)
Figure 1 SERVQUAL model criteria
Colmenares and Saavedra (2007) affirm that SERVQUAL is an obligatory reference in the study of service quality. Following their methodology, several investigations have been conducted around the world and in Ibero-America in various settings, including university canteens (Cevallos, 2015); the postal service (Roslan et al., 2015); public transportation (Valenzo et al., 2019); and fitness centers (Peitzika et al., 2020). Works on public health include, among others, those of Cabello and Chirinos (2012), Pedraza et al. (2014), Zapata (2014), Pedraza et al. (2015), Henao et al. (2018), and Teshnizi et al. (2018).
The Service Performance Model (SERVPERF)
The SERVPERF model was created by Cronin and Taylor (1992, 1994), who argue that although the quality dimensions proposed by Parasuraman et al. (1985, 1988) are adequate, the SERVQUAL paradigm and methodology are not the best for assessing the quality of services. They propose that this can be measured solely based on the analysis of the perceptions of the client receiving the service regarding the performance of the provider organization and no longer based on the differences between expectations and performance. According to these researchers, the SERVPERF model is a more functional method since, based on the same instrument used in SERVQUAL, it reduces by 50% the number of items to be measured because it does not require the study of expectations (Cronin & Taylor, 1992).
Likewise, authors such as Cabello and Chirinos (2012) and Le and Fitzgerald (2014) have criticized the methodology and complexity surrounding the identification of client expectations and interpreting results of the SERVQUAL model. In this regard, Salomi et al. (2005) and Ibarra and Casas (2015) recognize the advantage of SERVPERF in terms of its use since not having the clients reflect on their expectations makes it a more agile instrument concerning the time required for the application of the questionnaire and in terms of less difficulty in the task of analysis and interpretation, since it is based solely on perceptions.
Regardless of the methodology of each model and the approaches of their creators, it should be pointed out that both SERVPERF and SERVQUAL are reliable and valid instruments for estimating the quality of services, which has been confirmed in works such as those of Jain and Gupta (2004), Salomi et al. (2005), García and Díaz (2008), and Bayraktaroglu and Atrek (2010). Similarly to SERVQUAL, numerous researches have been executed based on the SERVPERF model in activities such as hospitality (Ho et al., 2014), banking (Torres & Luna, 2017), and the aeronautics industry (Yu & Hyun, 2019). Additionally, studies such as those by Le and Fitzgerald (2014), Basantes et al. (2016), Ampah and Ali (2019), Castellano et al. (2019), Pedraja et al. (2019), and Subiyakto et al. (2020), state that SERVPERF is suitable for measuring the quality of healthcare services offered by public institutions. The above, in addition to its functionality, motivated the use of this model in the present study.
Quality in government services
As mentioned above, the questioning to which the public administration was subjected at the international level regarding the effectiveness and efficiency of its operations led to the emergence of a new form of administration, known as new public management. Based on identifying the citizen’s needs and expectations as the core of public action (Vargas & Rodríguez, 2011), quality management applied to the services provided by the government constituted one of the strategic axes of its new administrative paradigm. Torres, Vásquez, and Luna (2011) add that the need to offer services that meet national and international regulations, together with the demands of the public, requires the incorporation of mechanisms for their continuous evaluation to improve their quality.5
Although researchers such as Vargas and Rodríguez (2011) have found organizational resistance to change through the adoption of quality systems in government, other scientists, such as Sáenz and Serrano (2012), indicate that they serve as change management models in organizations. In this context, Ruiz (2012) adds that the quality approach made possible a cultural transformation in the public sphere: the transition from administration to management. Simultaneously, it became necessary because of its ability to provide tools to governmental organizations that needed to relegitimize themselves by providing higher-level services. Although there are irregularities, the progress of quality management in Latin America is highly significant, which is confirmed by the review of the many successful experiences in this area (Torres et al., 2011) and by the fact that it is referred to in various legal systems of the region’s governments (Ruiz, 2012).
A milestone in this area was the publication of the Ibero-American Charter for Quality in Public Management (Latin American Center of Administration for Development, CLAD, 2008), approved within the framework of the 10th Ibero-American Conference of Ministers of Public Administration and State Reform. The following elements inherent to quality public management stand out: inspiring principles, citizens’ rights and duties, and specific measures and instruments for designing policies and strategies. Coinciding with Vargas and Rodríguez (2011) that quality management should be conceived as a mechanism at the service of citizens and not as an end in itself to obtain certificates and recognition, the charter states that quality in public management is a transforming culture that drives the Public Administration to continuously improve to fully satisfy the needs and expectations of the citizens with justice, equity, objectivity, and efficiency in the use of public resources. (…) Quality in public management makes sense if its ultimate goal is to achieve a society of well-being, with justice and equity, guaranteeing the development of the individual and respect for their dignity, social cohesion, and the guarantee of the effective and comprehensive fulfillment of human rights. In particular, it ensures everyone has timely and universal access to information, benefits, and quality public services (CLAD, 2008, pp. 6-7).
The links between the document mentioned above and the SERVPERF model are obvious if one considers that ongoing evaluation and continuous improvement, centered on the citizen, in addition to conducting opinion surveys to detect the level of satisfaction of the population with services, are fundamental principles for promoting quality public management (CLAD, 2008). Tools such as SERVPERF can be very useful for this purpose.
Geographical and institutional framework of the research
Ciudad Ixtepec, a municipality located in the southeast of the state of Oaxaca, is an essential element in the new attempt for the economic reactivation of the Isthmus of Tehuantepec. In terms of health care, this municipality has six medical units: one belonging to the Mexican Social Security Institute (IMSS), another belonging to the Social Security Institute for the Service of State Workers (ISSSTE), and four operated by the Health Services of the State of Oaxaca (SSO). Among the medical units, one is a general hospitalization unit belonging to the SSO; the remaining five offer outpatient services. Records show that a social security institution covers 55.1% of the population in this locality. Likewise, the number of users of public health services is estimated at 19 721 people, with 54% of care offered in SSO units, 28% in IMSS, and 18% in ISSSTE (Gobierno Municipal de Ciudad Ixtepec, 2014). For this study, the four most important units were considered, which also provide services to patients from neighboring urban municipalities and multiple rural communities in the region (Table 1)
Table 1 Description of the medical units analyzed
| Medical unit | Level of attention6 |
Description of services |
|---|---|---|
| IMSS - Family
Medicine Unit no. 23 |
First | General and family medicine |
| ISSSTE - Family Clinic | First | General Medicine |
| José Sánchez
Gutiérrez Health Center (SSO) |
First | General
medicine, dentistry, psychology, and a module
of attention to family and sexual violence |
| Ciudad
Ixtepec General Hospital (SSO) |
Second | Gynecology-obstetrics, traumatology, pediatrics,
dentistry, general surgery, etcetera. It has 30 beds and a clinical laboratory |
Source: created by the authors based on fieldwork
Methodology employed
A modified SERVPERF questionnaire was used to achieve the objective of this
study. A modified instrument was used because the users of health services in
Ciudad Ixtepec consider that their time is wasted when they are asked the 22
questions of the SERVPERF model. This fact was recorded in the pilot study.
Notably, based on the p observable variables, the corroboration of the k=5
SERVPERF dimensions through CFA depends on the p(p − 1)/2 different correlations
and the pk factor loadings. To this end, the maximum number of factors to be
corroborated, assuming the arrangement of p items, should be less than
The results of the pilot survey were analyzed using exploratory factor analysis (EFA), that is, without specifying the pattern of relations between indicators and latent variables; in addition, the number of factors was set so that together they would explain at least 70% of the total variance of the indicators, and at least 10% marginally. Factor loadings were estimated using the principal factor method, with varimax rotation, to facilitate the identification of the relation between indicator and dimension.
The items selected presented a commonality of at least 0.5, that is, those whose variability explained by the factors extracted was at least 50%. Subsequently, the items were placed in the criterion for registering the highest factor loadings. The item with a commonality lower than 0.5 or whose factor loadings did not show a noticeable relation with any factor was eliminated from the proposal. The final instrument is shown in Table 2.
Table 2 Field-applied modified SERVPERF instrument
| Dimension | Item |
|---|---|
| Reliability | F1. The service
was performed correctly F2. The staff do their job carefully F3. The staff show interest in solving your problems |
| Responsiveness | CR1. The
waiting time to receive the service was
short CR2. The duration of the procedure or service was adequate CR3. The hours of operation are adequate and are respected |
| Security | S1. Received
accurate information for the service S2. The staff were friendly and courteous S3. The staff are professional and skilled S4 The language of the person who assisted you was clear |
| Empathy | E1. You can
rely on the staff of this health unit E2. You consider that this health unit knows your needs |
| Tangible elements | ET1. The staff
were well-dressed and neat ET2. The facilities are nice and clean ET3. The facilities are suitable for this type of service |
| General questions | What is your overall
assessment of the care received? Did the service you received meet your expectations? |
Source: created by the authors
A numerical scale from 0 to 10 was used to evaluate the health services. This scale is familiar
to the Mexican population since it is related to school performance; a rating of less than six indicates disapproval of the service; in contrast, approval if it is greater than six. In addition, a rating of 10 is a mark of service excellence. It should be noted that in addition to its easy interpretation since it is considered continuous, this scale makes it possible to apply parametric statistical techniques in the analysis of the results, which provides greater analytical capacity than a measure on an ordinal scale.
The sample size was determined based on simple random sampling in infinite populations, assuming that population averages would be estimated by intervals with 95% reliability. To estimate the minimum number of surveys to be conducted, a maximum permissible error of plus/minus 0.3 decimal points was considered around the average rating of the item that showed the greatest variance in the pilot survey (Staff treatment was friendly and courteous, with sample variance s2 =7.997). This procedure ensured the precision set in the estimates of the population averages of the items with the lowest variance. The formula for calculating the sample size is as follows (Mendenhall et al., 1994, p. 344):
Since the population variance σ2 is unknown, Mendenhall et al. (1994,
p. 344) suggests replacing it with the sampling variance (s2 =
7.997). With these values, the minimum number of surveys to be conducted in each
health unit was calculated, which was
To evaluate the reliability of the instrument used, Cronbach’s alpha (Cronbach, 1951) was used, which is determined with the equation:
where
On the other hand, the validation of the instrument was conducted through CFA. The hypothesis to be corroborated is that the perception of health services behaves according to the modified SERVPERF model, shown in Figure 2. The model was estimated by maximum likelihood using the correlation matrix of the data.
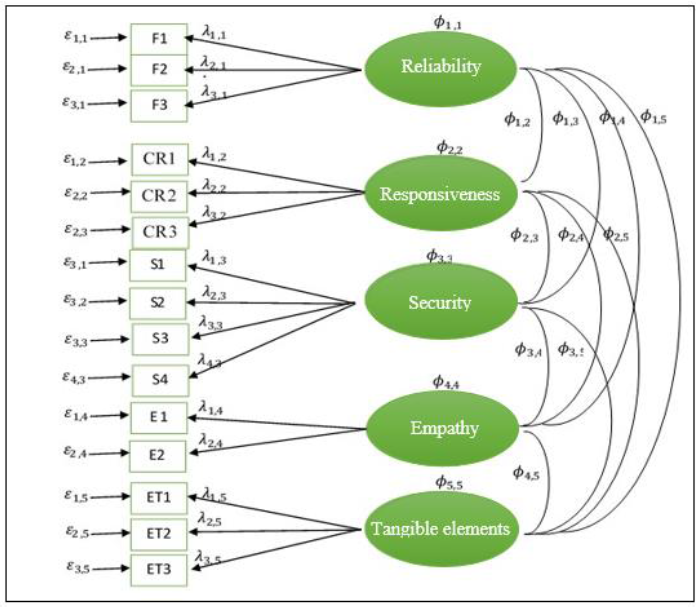
Source: created by the authors
Figure 2 Confirmatory factorial model with five latent variables without
correlation between measurement errors:
In addition to comparing the observed variance and covariance matrix with that estimated from the model (Figure 2), the root mean square error of approximation by degrees of freedom (RMSEA) was calculated to verify the goodness of fit. The RMSEA analyzes the differences between the observed and estimated covariance matrix considering the degrees of freedom. If the RMSEA is less than 0.05, the model has a good fit; if it ranges between 0.05 and 0.08, the fit is reasonable; if it lies between 0.08 and 0.10, the fit is mediocre; and if it is greater than 0.10, the model exhibits lack of fit (Holgado et al., 2019, p. 142).
Finally, to have a better understanding of the variability in the perception of health services, the Mann-Whitney procedure was used to contrast the distributions of the indicators by gender, and the Krustal-Wallis test was used to compare the distributions of the indicators between health institutions, occupation categories, education, and age groups.
Results
General characteristics of the sample
A total of 794 surveys were administered, of which 196 corresponded to users of the CS, 213 of the HG, 326 of the IMSS, and 59 of the ISSSTE. Although a priori it was established that at least 175 questionnaires should be conducted per health unit, only 59 were conducted at the ISSSTE due to the low number of beneficiaries; the other units complied with the stipulations. It should be noted that when a minor or a user is unable to seek health services on their own due to temporary or permanent incapacity received medical care, their family member or guardian was surveyed.
Regarding the occupation of those entitled to health services, it is noteworthy that housewives were the ones who requested them most (40.9%), a result highly correlated with the fact that two-thirds of the respondents were women (Tables 3a and 3d). These statistics were expected because in the Mexican population, three-quarters of the people who provide care within households, including health care, are women (Instituto Nacional de las Mujeres, 2013). In this context, women not only come to receive health services but are also (in general) responsible for taking their minor children or accompanying the elderly to medical appointments.
Table 3 General characteristics of the sampled population
| a) Care according to occupation by institution | |||||
|---|---|---|---|---|---|
| Occupation | Institution | Total | |||
| C Salud | H General | IMSS | ISSSTE | ||
| Housewife | 55.6 | 42.3 | 36.2 | 13.6 | 40.9 |
| Employee | 22.4 | 30.5 | 30.1 | 32.2 | 28.5 |
| Student | 8.7 | 7.0 | 9.8 | 3.4 | 8.3 |
| Entrepreneur | 1.0 | 0.9 | 1.2 | 1.7 | 1.1 |
| Not working | 9.2 | 11.7 | 10.7 | 3.4 | 10.1 |
| Retired | 2.0 | 2.8 | 9.5 | 25.4 | 7.1 |
| Other | 1.0 | 4.7 | 2.5 | 20.3 | 4.0 |
Source: created by the authors
| b) Care by age group and institution | |||||
|---|---|---|---|---|---|
| Age Group | Institution | Total | |||
| C Salud | H General | IMSS | ISSSTE | ||
| [15, 20) | 3.6 | 7.0 | 5.8 | 1.7 | 5.3 |
| [20, 30) | 14.8 | 16.4 | 15.1 | 5.1 | 14.6 |
| [30,40) | 25.0 | 27.2 | 23.9 | 15.3 | 24.4 |
| [40, 50) | 27.7 | 19.2 | 13.5 | 23.8 | 16.9 |
| [50, 65) | 21.0 | 17.4 | 23.0 | 37.3 | 22.1 |
| 65 and over | 17.9 | 12.7 | 18.7 | 16.9 | 16.8 |
Source: created by the authors
| c) Care by level of schooling by institution | |||||
|---|---|---|---|---|---|
| Education | Institution | Total | |||
| C Salud | H General | IMSS | ISSSTE | ||
| No education | 12.2 | 16.0 | 3.4 | 3.4 | 8.9 |
| Primary | 26.5 | 20.2 | 24.5 | 8.5 | 22.7 |
| Secondary | 27.0 | 26.8 | 24.8 | 15.3 | 25.2 |
| Baccalaureate | 24.0 | 30.5 | 29.8 | 30.5 | 28.6 |
| University | 8.7 | 6.6 | 16.6 | 35.6 | 13.4 |
| Postgraduate | 1.5 | 0.9 | 6.8 | 1.3 | |
Source: created by the authors
| d) Care by gender by institution | |||||
|---|---|---|---|---|---|
| Gender | Institution | Total | |||
| C. Salud | H. General | IMSS | ISSSTE | ||
| Male | 25.5 | 37.1 | 33.7 | 49.2 | 33.8 |
| Female | 74.5 | 62.9 | 66.3 | 50.8 | 66.2 |
Source: created by the authors
Another important aspect to note is that one out of every four ISSSTE users is a pensioner, consistent with their age, since in this health unit, more than half of the respondents stated that they were 50 years old or older (Table 3b).
Regarding the educational level of the beneficiaries, the majority of those with no education were served at the CS or the HG; 66% and 63% of the respondents, respectively, stated that they had no education or only basic education. In contrast, the population with higher education was attended to mainly by the IMSS or ISSSTE (Table 3c).
Reliability of the instrument
Cronbach’s alpha calculated with the 15 items of the instrument yielded a value of 0.962, indicating that the questionnaire has high reliability for collecting information on the quality of health services. On the other hand, the coefficient for reliability was 0.91, which also shows high reliability. The coefficients for responsiveness, security, empathy, and tangible items were 0.88, 0.89, 0.81, and 0.88, respectively. These results indicate that in these dimensions, the instrument has acceptable reliability (Hernández et al., 2010). The decrease in the value of Cronbach’s alpha in each dimension, compared to the overall value, is due to one of the properties of the coefficient: if the number of items in the instrument increases, the value of the index increases (Cortina, 1993).
Confirmatory factor analysis
The matrix of sample correlations and the standard deviations (SD) for
estimating the factor model in Figure 3
are shown in Table 4. It should be
noted that latent factors require a measurement metric, achieved by fixing
the factor loading of an observable variable on each factor. The loads set
with a value of 1.0 were
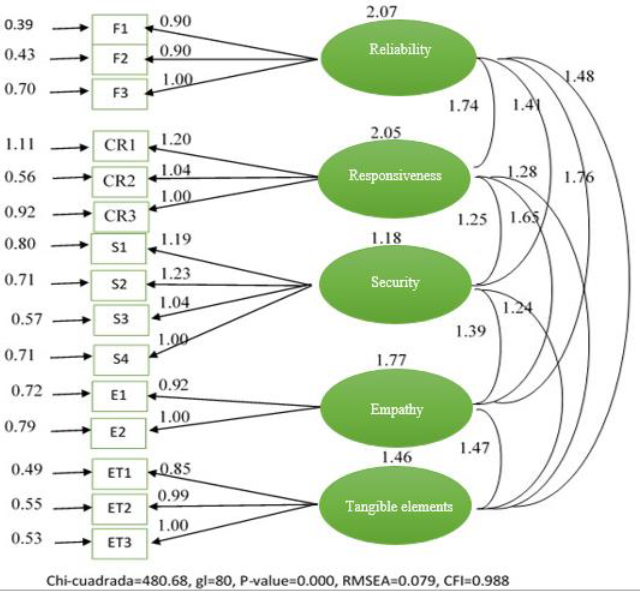
Source: created by the authors
Figure 3 Unstandardized estimation of the five-factor SERVPERF model to explain the perception of health services in Ciudad Ixtepec, Oaxaca
Table 4 Correlation matrix and standard deviations of observed variables
| F1 | F2 | F3 | CR1 | CR2 | CR3 | S1 | S2 | S3 | S4 | E1 | E2 | ET1 | ET2 | ET3 | |
|---|---|---|---|---|---|---|---|---|---|---|---|---|---|---|---|
| F1 | 1.000 | ||||||||||||||
| F2 | 0.810 | 1.000 | |||||||||||||
| F3 | 0.783 | 0.759 | 1.000 | ||||||||||||
| CR1 | 0.633 | 0.624 | 0.678 | 1.000 | |||||||||||
| CR2 | 0.697 | 0.660 | 0.700 | 0.754 | 1.000 | ||||||||||
| CR3 | 0.584 | 0.594 | 0.599 | 0.796 | 0.740 | 1.000 | |||||||||
| S1 | 0.702 | 0.684 | 0.660 | 0.612 | 0.604 | 0.558 | 1.000 | ||||||||
| S2 | 0.683 | 0.691 | 0.649 | 0.562 | 0.636 | 0.536 | 0.716 | 1.000 | |||||||
| S3 | 0.673 | 0.680 | 0.620 | 0.519 | 0.605 | 0.545 | 0.637 | 0.734 | 1.000 | ||||||
| S4 | 0.606 | 0.659 | 0.574 | 0.538 | 0.546 | 0.593 | 0.636 | 0.647 | 0.647 | 1.000 | |||||
| E1 | 0.669 | 0.671 | 0.668 | 0.585 | 0.614 | 0.566 | 0.615 | 0.678 | 0.704 | 0.659 | 1.000 | ||||
| E2 | 0.680 | 0.694 | 0.671 | 0.610 | 0.665 | 0.646 | 0.651 | 0.695 | 0.639 | 0.607 | 0.685 | 1.000 | |||
| ET1 | 0.638 | 0.643 | 0.581 | 0.490 | 0.504 | 0.530 | 0.697 | 0.664 | 0.664 | 0.686 | 0.570 | 0.593 | 1.000 | ||
| ET2 | 0.683 | 0.623 | 0.608 | 0.513 | 0.549 | 0.550 | 0.638 | 0.641 | 0.686 | 0.611 | 0.567 | 0.644 | 0.720 | 1.000 | |
| ET3 | 0.667 | 0.691 | 0.642 | 0.539 | 0.582 | 0.586 | 0.693 | 0.660 | 0.657 | 0.656 | 0.696 | 0.664 | 0.673 | 0.743 | 1.000 |
| SD | 1.434 | 1.450 | 1.664 | 2.015 | 1.665 | 1.721 | 1.570 | 1.580 | 1.354 | 1.375 | 1.496 | 1.601 | 1.243 | 1.400 | 1.409 |
Source: created by the authors
One way to evaluate the goodness of fit of the model is to observe the discrepancies between the observed variances and covariances matrix and the one reproduced by the model: if there is a good fit, then the matrix reproduced by the model will be similar to the one calculated with the observed variables. As can be seen in Table 5, both matrices are similar, although this similarity is relative, so it is necessary to resort to a formal statistic procedure.
Table 5 Observed and estimated variances and covariances matrix with the modified SERVPERF model
| a) Observed matrix | |||||||||||||||
| F1 | F2 | F3 | CR1 | CR2 | CR3 | S1 | S2 | S3 | S4 | E1 | E2 | ET1 | ET2 | ET3 | |
| F1 | 2.056 | ||||||||||||||
| F2 | 1.684 | 2.103 | |||||||||||||
| F3 | 1.868 | 1.831 | 2.769 | ||||||||||||
| CR1 | 1.829 | 1.823 | 2.273 | 4.060 | |||||||||||
| CR2 | 1.664 | 1.593 | 1.939 | 2.530 | 2.772 | ||||||||||
| CR3 | 1.441 | 1.482 | 1.715 | 2.518 | 2.120 | 2.962 | |||||||||
| S1 | 1.580 | 1.557 | 1.724 | 1.936 | 1.579 | 1.508 | 2.465 | ||||||||
| S2 | 1.547 | 1.583 | 1.706 | 1.789 | 1.673 | 1.457 | 1.776 | 2.496 | |||||||
| S3 | 1.307 | 1.335 | 1.397 | 1.416 | 1.364 | 1.270 | 1.354 | 1.570 | 1.833 | ||||||
| S4 | 1.195 | 1.314 | 1.313 | 1.491 | 1.250 | 1.403 | 1.373 | 1.406 | 1.255 | 1.891 | |||||
| E1 | 1.435 | 1.456 | 1.663 | 1.763 | 1.529 | 1.457 | 1.444 | 1.603 | 1.426 | 1.356 | 2.238 | ||||
| E2 | 1.561 | 1.611 | 1.788 | 1.968 | 1.773 | 1.780 | 1.636 | 1.758 | 1.385 | 1.336 | 1.641 | 2.563 | |||
| ET1 | 1.137 | 1.159 | 1.202 | 1.227 | 1.043 | 1.134 | 1.360 | 1.304 | 1.118 | 1.172 | 1.060 | 1.180 | 1.545 | ||
| ET2 | 1.281 | 1.265 | 1.416 | 1.447 | 1.280 | 1.325 | 1.402 | 1.418 | 1.300 | 1.176 | 1.376 | 1.443 | 1.253 | 1.960 | |
| ET3 | 1.348 | 1.412 | 1.505 | 1.530 | 1.365 | 1.421 | 1.533 | 1.469 | 1.253 | 1.271 | 1.467 | 1.498 | 1.179 | 1.466 | 1.985 |
| A) Estimated matrix | |||||||||||||||
| F1 | F2 | F3 | CR1 | CR2 | CR3 | S1 | S2 | S3 | S4 | E1 | E2 | ET1 | ET2 | ET3 | |
| F1 | 2.056 | ||||||||||||||
| F2 | 1.672 | 20.102 | |||||||||||||
| F3 | 1.860 | 1.861 | 2.769 | ||||||||||||
| CR1 | 1.871 | 1.873 | 2.084 | 4.060 | |||||||||||
| CR2 | 1.621 | 1.623 | 1.805 | 2.556 | 2.772 | ||||||||||
| CR3 | 1.559 | 1.560 | 1.736 | 2.457 | 2.129 | 2.962 | |||||||||
| S1 | 1.509 | 1.510 | 1.680 | 1.793 | 1.554 | 1.493 | 2.465 | ||||||||
| S2 | 1.560 | 1.561 | 1.737 | 1.854 | 1.606 | 1.544 | 1.724 | 2.496 | |||||||
| S3 | 1.315 | 1.316 | 1.465 | 1.563 | 1.354 | 1.302 | 1.454 | 1.503 | 1.833 | ||||||
| S4 | 1.267 | 1.268 | 1.411 | 1.506 | 1.305 | 1.254 | 1.401 | 1.448 | 1.221 | 1.891 | |||||
| E1 | 1.464 | 1.465 | 1.630 | 1.828 | 1.584 | 1.523 | 1.535 | 1.586 | 1.337 | 1.289 | 2.238 | ||||
| E2 | 1.583 | 1.584 | 1.763 | 1.977 | 1.713 | 1.647 | 1.659 | 1.715 | 1.446 | 1.393 | 1.641 | 2.563 | |||
| ET1 | 1.133 | 1.134 | 1.262 | 1.305 | 1.131 | 1.087 | 1.262 | 1.304 | 1.100 | 1.060 | 1.159 | 1.254 | 1.545 | ||
| ET2 | 1.311 | 1.312 | 1.460 | 1.510 | 1.308 | 1.258 | 1.460 | 1.509 | 1.272 | 1.226 | 1.341 | 1.450 | 1.222 | 1.960 | |
| ET3 | 1.330 | 1.331 | 1.481 | 1.532 | 1.328 | 1.276 | 1.481 | 1.531 | 1.291 | 1.244 | 1.361 | 1.472 | 1.240 | 1.435 | 1.985 |
Source: created by the authors
Taking the RMSEA goodness of fit index as a reference, the results show a value of 0.079, indicating that the model reasonably fits the data (Holgado et al., 2019). Another index for evaluating model fit is the comparative fit index (CFI). A model with a good fit will produce a CFI coefficient greater than or equal to 0.95. This work obtained a CFI of 0.988, indicating that the fitted model is better than one that assumes zero population covariances among all items.
To test the significance of each parameter, i.e., that it is different from zero, the Wald test was used. This procedure divides the estimated coefficient in the standardized solution by its standard error. At a significance level of 0.05, the null hypothesis that the parameter is equal to zero is rejected if the ratio, in absolute value, is greater than 1.96. The respective results are shown in Figure 4a. It should be noted that all parameters are statistically significant, which leads to the conclusion that each model parameter is important. All factor loadings show high values, indicating the relational relevance of each item to its theoretical construct.
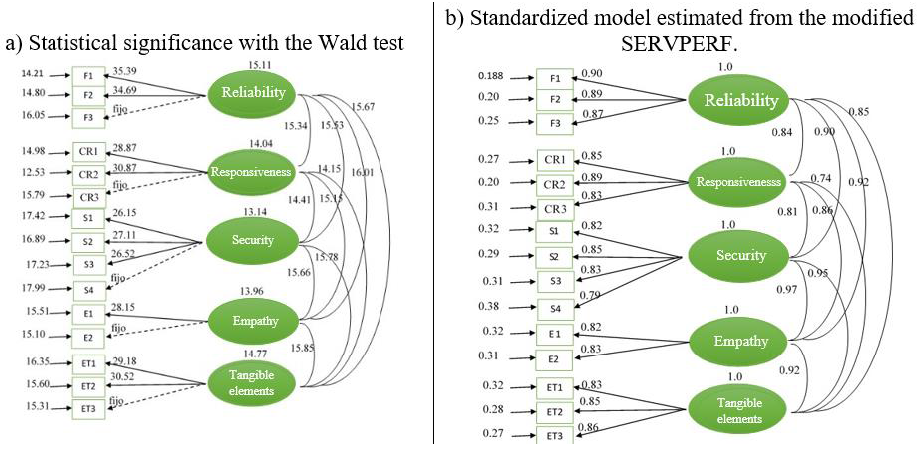
Source: created by the authors
Figure 4 a) Significance tests for each model parameter and b) Estimated standardized model.
In the CFA, the factor loading represents the correlation between the item and the latent factor. In addition, for a factor to explain at least 50% of the variance of the item, it must have a factor loading greater than 0.70, a condition that all factor loadings meet (Figure 4b). This situation ensures that in the standardized solution, the square of the factor loading is the proportion of the variance of the item explained by the model and the respective latent variable. In this context, the Reliability factor is the one that most explains the variability of the respective items, with at least 74% in each (Table 6). The latent variables Responsiveness and Tangible elements also explain a high percentage of the variability of their respective indicators. Although the item “The language of the person who assisted was clear” presented the lowest factor loadings, its latent variable, Safety, explains 62.2% of its variability.
Table 6 Factor loadings and their proportion of the explained variance of each item
| Ítem | Dimension | Proportion of explained variance |
Proportion of error |
||||
|---|---|---|---|---|---|---|---|
| Reliability | Responsiveness | Security | Empathy | Tangible elements |
|||
| F1 | 0.901 | 0.812 | 0.188 | ||||
| F2 | 0.892 | 0.796 | 0.204 | ||||
| F3 | 0.865 | 0.748 | 0.252 | ||||
| CR1 | 0.852 | 0.727 | 0.274 | ||||
| CR2 | 0.894 | 0.799 | 0.201 | ||||
| CR3 | 0.831 | 0.691 | 0.309 | ||||
| S1 | 0.823 | 0.677 | 0.323 | ||||
| S2 | 0.845 | 0.714 | 0.286 | ||||
| S3 | 0.831 | 0.691 | 0.309 | ||||
| S4 | 0.789 | 0.622 | 0.377 | ||||
| E1 | 0.823 | 0.678 | 0.323 | ||||
| E2 | 0.832 | 0.692 | 0.308 | ||||
| ET1 | 0.827 | 0.684 | 0.316 | ||||
| ET2 | 0.849 | 0.721 | 0.279 | ||||
| ET3 | 0.856 | 0.733 | 0.267 | ||||
Source: created by the authors
On the other hand, it should be noted that the sample size corroborated the stability of the factorial model shown in Figure 3, which, following the recommendation of Johnson and Wichern (2007), was verified by randomly dividing the original sample into two subsamples and estimating the confirmatory factorial model stipulated in Figure 3 in each one. The results always showed stability.
Status of indicators
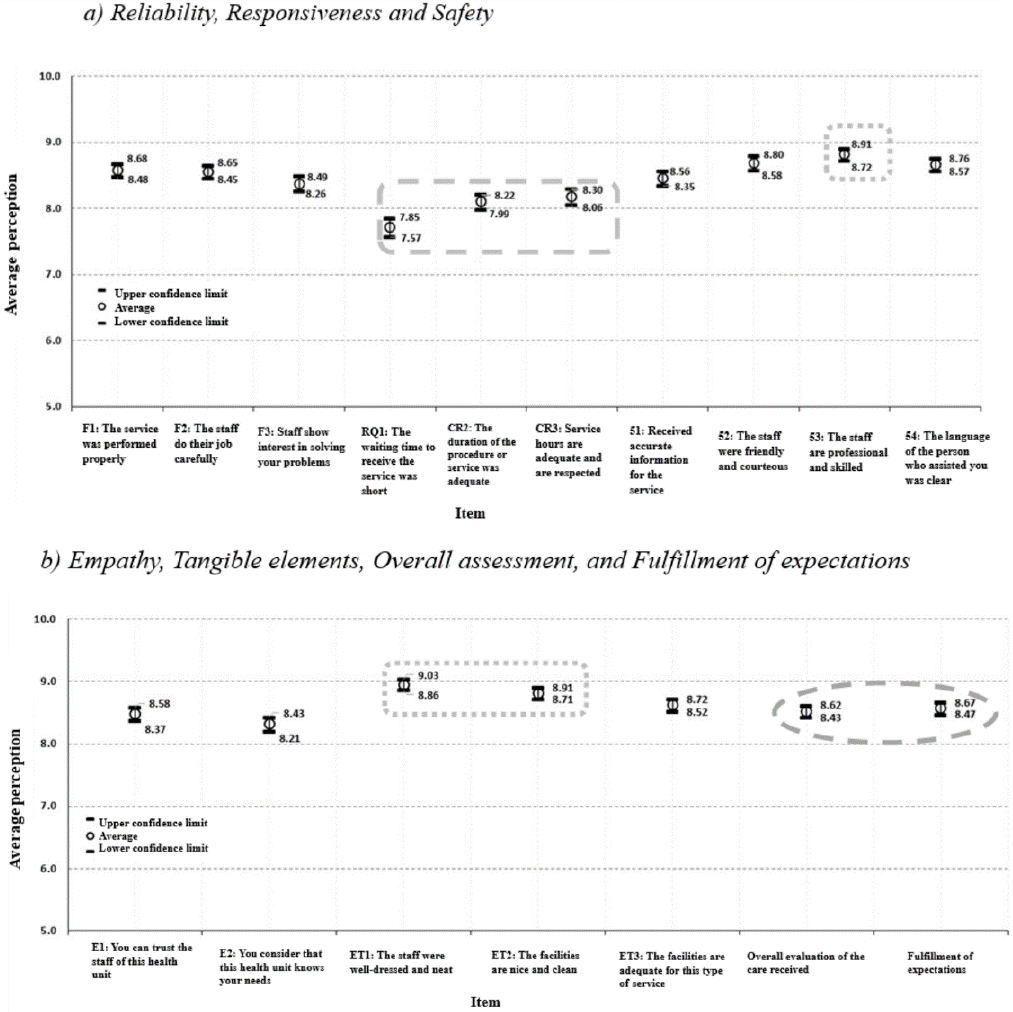
The results were presented above, showing the reliability and validity of the proposed instrument to capture the perception of health services, specifically the relevance of the indicators in each of the five dimensions. Nevertheless, given the malleability of the indicators, an analysis considering each item of the model is presented below. Analyzing the average estimates of the items, it is possible to highlight four points. First, most averages are between eight and nine, meaning health services are rated “good.” It is worth noting that this convenient appreciation of quality levels by users resembles that reported in similar works, such as those of Hamui et al. (2013), Zapata (2014), Pedraza et al. (2015), Basantes (2016), Pedraja et al. (2019), and Ampah and Ali (2019).
Second, the indicators that show the highest ratings correspond to Tangible elements, specifically those related to the presentation of health personnel, in addition to the pleasantness and cleanliness of the facilities, which coincides with the findings of Pedraja et al. (2019) and Monroy and Urcádiz (2019). Third, the indicators corresponding to Responsiveness present the lowest ratings, representing a key opportunity to improve the quality of services, specifically in establishing measures to respect pre-established service schedules and especially the reduction of waiting time to receive the service. On this aspect, there is convergence with Le and Fitzgerald (2014), Pedraza et al. (2015), and Basantes et al. (2016). Finally, the overall rating of the care received and the fulfillment of expectations not only presented statistically the same average rating but also had a high positive correlation (r = 0.88), i.e., if the fulfillment of expectations increases, so will the overall rating (Figure 5).
Status of indicators by health institution
Figure 6 shows the average estimates for each item; nevertheless, it is necessary to question how they behave according to the healthcare institution. Accordingly, and based on the Kruskal-Wallis test for comparing k independent samples, the null hypothesis of equality of distributions by health institution is rejected for each item (p-value of 0.000 for each item). The breakdown of the averages of the ratings for each indicator by health institution shows that the best perception was found at IMSS in the Tangible elements factor, while the lowest scores in the five dimensions were found at ISSSTE. In addition, in HG, Responsiveness obtained average scores as low as in ISSSTE (Table 7a).
Table 7 Estimates of the averages by a) health unit, b) occupation, c) age, and d) level of education in each item where the null hypothesis of equality of distributions was rejected for each respective category (pvalues=0.00)
| Variable | Reliability | Responsiveness | Security | Empathy | Tangible Elements | VG | CE | |||||||||||
|---|---|---|---|---|---|---|---|---|---|---|---|---|---|---|---|---|---|---|
| F1 | F2 | F3 | CR1 | CR2 | CR3 | S1 | S2 | S3 | S4 | E1 | E2 | ET1 | ET2 | ET3 | ||||
| Overall average | 8.6 | 8.6 | 8.4 | 7.7 | 8.1 | 8.2 | 8.5 | 8.7 | 8.8 | 8.7 | 8.5 | 8.3 | 8.9 | 8.8 | 8.6 | 8.5 | 8.6 | |
| a) By health institution | ||||||||||||||||||
| Health unit | Health Center | 8.7 | 8.6 | 8.5 | 7.9 | 8.2 | 8.3 | 8.5 | 8.8 | 8.8 | 8.7 | 8.6 | 8.5 | 9.0 | 8.8 | 8.6 | 8.6 | 8.6 |
| General Hospital | 8.4 | 8.4 | 8.1 | 7.1 | 7.7 | 7.7 | 8.2 | 8.5 | 8.7 | 8.6 | 8.2 | 8.0 | 8.8 | 8.5 | 8.4 | 8.2 | 8.3 | |
| IMSS | 8.8 | 8.8 | 8.7 | 8.2 | 8.5 | 8.5 | 8.7 | 9.0 | 9.0 | 8.8 | 8.8 | 8.6 | 9.2 | 9.2 | 8.9 | 8.8 | 8.9 | |
| ISSSTE | 7.4 | 7.6 | 7.3 | 7.0 | 7.4 | 7.7 | 7.5 | 7.5 | 8.0 | 8.0 | 7.8 | 7.3 | 8.1 | 7.8 | 7.8 | 7.8 | 7.7 | |
| b) By occupation | ||||||||||||||||||
| Occupation | Housewife | 8.8 | 8.7 | 8.5 | 7.9 | 8.2 | 8.3 | 8.6 | 8.8 | 9.0 | 8.8 | 8.6 | 8.5 | 9.1 | 9.0 | 8.8 | 8.8 | 8.8 |
| Employee | 8.3 | 8.2 | 8.1 | 7.5 | 7.9 | 7.8 | 8.3 | 8.5 | 8.5 | 8.4 | 8.3 | 8.1 | 8.7 | 8.5 | 8.3 | 8.2 | 8.3 | |
| Student | 8.3 | 8.2 | 7.8 | 6.9 | 7.6 | 7.9 | 7.9 | 8.3 | 8.6 | 8.4 | 7.9 | 7.8 | 8.9 | 8.6 | 8.4 | 8.2 | 8.1 | |
| Entrepreneur | 8.6 | 8.3 | 8.4 | 7.7 | 8.3 | 8.7 | 8.0 | 8.2 | 8.7 | 8.4 | 8.1 | 8.1 | 8.3 | 8.1 | 8.3 | 8.6 | 8.4 | |
| Not working | 9.2 | 9.2 | 9.2 | 8.5 | 8.9 | 9.0 | 9.2 | 9.3 | 9.4 | 9.3 | 9.2 | 9.0 | 9.4 | 9.3 | 9.2 | 9.2 | 9.1 | |
| Retired | 8.2 | 8.3 | 8.2 | 7.7 | 7.9 | 8.0 | 8.3 | 8.2 | 8.3 | 8.3 | 8.2 | 7.9 | 8.5 | 8.4 | 8.2 | 7.9 | 8.2 | |
| Other | 8.3 | 8.5 | 8.3 | 7.3 | 7.7 | 8.0 | 8.2 | 8.9 | 9.0 | 8.8 | 8.3 | 7.6 | 9.1 | 8.9 | 8.5 | 8.4 | 8.4 | |
| c) By age | ||||||||||||||||||
| Age group | [15, 20) | 8.6 | 8.9 | 8.4 | 7.5 | 8.2 | 8.2 | 8.5 | 8.8 | 9.0 | 8.8 | 8.5 | 8.4 | 9.1 | 9.0 | 8.9 | 8.6 | 8.6 |
| [20, 30) | 8.3 | 8.2 | 7.8 | 7.0 | 7.4 | 7.8 | 7.9 | 8.4 | 8.7 | 8.4 | 8.1 | 7.8 | 8.8 | 8.6 | 8.2 | 8.3 | 8.2 | |
| [30, 40) | 8.4 | 8.4 | 8.2 | 7.4 | 8.0 | 7.9 | 8.4 | 8.6 | 8.7 | 8.6 | 8.3 | 8.2 | 8.9 | 8.8 | 8.5 | 8.4 | 8.5 | |
| [40, 50) | 8.3 | 8.3 | 8.1 | 7.4 | 7.9 | 7.8 | 8.2 | 8.4 | 8.6 | 8.4 | 8.2 | 8.1 | 8.8 | 8.4 | 8.4 | 8.3 | 8.3 | |
| [50, 60) | 8.6 | 8.5 | 8.3 | 7.8 | 8.1 | 8.4 | 8.4 | 8.6 | 8.8 | 8.7 | 8.5 | 8.3 | 8.9 | 8.7 | 8.6 | 8.4 | 8.4 | |
| 60 and over | 9.1 | 9.1 | 9.1 | 8.6 | 8.8 | 8.9 | 9.0 | 9.2 | 9.2 | 9.1 | 9.1 | 9.0 | 9.2 | 9.3 | 9.1 | 9.1 | 9.2 | |
| d) By educational level | ||||||||||||||||||
| Education | No education | 9.1 | 8.9 | 8.9 | 8.3 | 8.4 | 8.6 | 9.0 | 9.1 | 9.1 | 9.1 | 8.8 | 8.8 | 9.2 | 9.1 | 9.0 | 8.9 | 9.1 |
| Basic | 8.8 | 8.8 | 8.7 | 8.0 | 8.4 | 8.4 | 8.7 | 8.9 | 9.1 | 8.8 | 8.8 | 8.6 | 9.1 | 9.0 | 8.8 | 8.8 | 8.8 | |
| Upper middle school | 8.4 | 8.4 | 8.1 | 7.5 | 7.9 | 8.0 | 8.3 | 8.6 | 8.6 | 8.5 | 8.3 | 8.1 | 8.8 | 8.7 | 8.5 | 8.4 | 8.4 | |
| Higher | 7.9 | 7.9 | 7.7 | 6.8 | 7.3 | 7.7 | 7.8 | 8.0 | 8.2 | 8.0 | 7.8 | 7.4 | 8.5 | 8.1 | 8.0 | 7.8 | 7.8 | |
Source: created by the authors
Regardless of the areas of opportunity detected, although at first glance it could be considered that poor management procedures underlie the ISSSTE in comparison with other organizations, this is not necessarily true if one considers that the average overall rating, 7.8, places it very close to the “good” parameter. The CS, HG, and IMSS received average scores of 8.6, 8.2, and 8.8 on the same item, which was clearly favorable but not very far from that of ISSSTE. It seems that this result reflects the fact that the relative majority of users of this institution (as opposed to the others) stated that they have higher education, which makes them more demanding when expressing their evaluations, in addition to the fact that it receives a markedly lower percentage of housewives, who, together with unemployed personnel, give the highest evaluations.
The passing grades observed in the study could be somewhat explained by the approach of Padma et al. (2010), in that hospital patients consider the interpersonal aspect of care the most important. In Ciudad Ixtepec, the relations between health personnel and clients tend to be very warm and close.
Status of indicators according to gender, occupation, age, and education
The Mann-Whitney procedure used to test the null hypothesis of equal distributions of indicators between men and women showed that statistically both are the same for each item (p-values greater than 0.10). That is, there are no significant differences between men’s and women’s perceptions of each criterion. In contrast, occupation is a significant variable in explaining the variability of each item. In this context, employees and students in the Reliability dimension provided the lowest average perceptions. Also, in the Responsiveness factor, students were the most rigorous in issuing ratings. In contrast, users who said they were not working gave the best ratings in each dimension (Table 7b). These results are similar to those of Ferraces et al. (2000), who, when analyzing the quality of bus service, found that pensioners report a higher degree of satisfaction than students and professionals.
According to the Kuskal-Wallis procedure, age and level of education are useful variables in explaining the variability of the scores on each item (p-values of 0.000 for each item and both variables). Thus, taking the age of the beneficiaries as a reference, it is possible to distinguish three characteristics in each quality dimension: a) those between 20 and 30 years old registered the lowest averages; b) the highest ratings were provided by users aged 60 years and older; and c) those aged 30 years and older, but younger than 60 years old, presented the same average ratings (Table 7c). The above is consistent with the study of the University of Almeria (2015), where it is noted that older people award higher ratings than younger people. Similar behavior was observed with the level of education, where in each dimension it was observed that: a) users with elementary and high school education registered the same average ratings, statistically equal to the general averages in each item; b) beneficiaries with no education issued, on average, the highest ratings; and c) the distributions with the lowest location parameter, the mean, refer to users with university studies (Table 7d).
It should be noted that the results achieved are consistent with those recorded in other research on service quality evaluation in the region based on the SERVPERF model (Torres & Luna, 2017). In both studies, the most highly rated quality dimension was Tangible elements, and the one with the lowest rating was Responsiveness, and there were certain differences in scores by institution. Likewise, the two studies showed no differences in the perception of quality by gender. Nevertheless, there were differences in occupation, education, and age since students and professionals, people with higher education, and younger people tended to give lower ratings. Housewives and the unemployed, citizens with basic education or no education, and people over 60 years of age give higher marks to the services. Although there are differences in the overall evaluation of the quality dimensions: 8.3 on average in this study and 9.1 in the one mentioned above, both are positive.
Conclusions
This research aimed to analyze, through the SERVPERF model, the quality of public health services in Ciudad Ixtepec based on the estimation of their performance by their clients. This purpose, in turn, has practical and theoretical implications. From the perspective of practice, in addition to confirming the importance of conducting applied research within the specific field of public management, it is clear how relevant the issue of quality is for this purpose and, within it, the relevance of using instruments such as SERVPERF, especially if they are appropriate to the local reality as in this case. In addition, this work opens a line of research that deserves to be maintained with research of the highest methodological rigor.
Therefore, this study highlights the potential of evaluating the quality of public services in the Isthmus of Tehuantepec, in which, to improve them, it is essential to prioritize the opinion of their users. Consequently, this type of tool can foster public management attached to better performance parameters focused on citizens, which in turn helps to improve the legitimacy of government; even more so regarding health services, which are among the most significant and sensitive for society, hand in hand with what was pointed out by Henao et al. (2018): “ …tient’s perception of service delivery definitively determines its level of quality.”
On the other hand, thanks to the consistency in results with other research on the quality of health services conducted in other contexts, as well as with those found in another already referred to, conducted in a different subsector of services, but following a similar methodology and in the same territorial scope, this work contributes to the theoretical knowledge in the area. Contrary to what might be expected, the users’ expectations of the services analyzed are comparatively similar to those in other parts of the world, as described above.
Thus, a positive evaluation was obtained in general and by institution. People who do not work and housewives gave the highest scores (probably because they have more time) and the oldest and the uneducated population were the most generous with their scores. Also, people with higher education were the most demanding regarding services. The most highly rated quality dimensions were Tangible elements and Safety, and Responsiveness had the lowest scores, which are among the similarities with other studies and reinforce the body of knowledge in the field of public management. Thus, the greatest areas of opportunity are found in the waiting time to receive service, the duration of the service and the hours of service, making it a priority to implement a reengineering program to make the services offered more efficient. Subiyakto et al. (2020) point out that responsiveness is essential for patient satisfaction in public hospitals.
Although this study yielded positive results, it is important to emphasize that shortly other studies of a similar nature should be conducted in the health area and the other sub-sectors in the region. The aim should be to perform comparative analyses between and within these subsectors to detect trends and new areas of opportunity. It would be expected that in these further studies there would be greater access to the organizations under study, which was the most important limitation of this research.
Beyond proposing reengineering strategies to streamline service processes, this work adds to the proposal of CLAD (2008) to build a new culture of quality within the Ibero-American public administration from institutions and academia. One in which equity, effectiveness, efficiency, productivity, transparency, and objectivity are some of the values that make it possible to meet society’s requirements and expectations fully. The political, economic, and administrative transformations that are taking place today make this imperative.
Finally, in terms of its contribution, from a global perspective this work adds to the challenge of achieving Goal 3, Health and Well-being, an integral part of the Sustainable Development Goals agenda promoted by the United Nations (2015), particularly as the document underscores the right of all people to receive quality health services. At the local level, it represents valuable input for the government of Oaxaca, which recognizes that “The evaluation of the quality of care is an essential element to study the performance of health services and is a valuable tool in decision-making aimed at improving them” (Gobierno del Estado de Oaxaca, 2016, p. 47).
REFERENCES
Alén, M. E. (2006). Comparación de escalas para la medición de la calidad percibida en establecimientos termales. Revista Galega de Economía, 15(2), 25-43. https://dialnet.unirioja.es/servlet/articulo?codigo=2060140. [ Links ]
Ampah, I. T. y Ali, R. S. (2019). The role of service quality in patients (customer) satisfaction in public healthcare institutions in Ghana. International Journal of Innovation and Economic Development, 5(2), 65-73. https://doi.org/10.18775/ijied.1849-7551-7020.2015.52.2005. [ Links ]
Basantes, R., Vinueza, A. y Coronel, J. (2016). Niveles de satisfacción de los usuarios del Hospital Andino Alternativo de Chimborazo. Revista Ciencia UNEMI, 9(18), 90-100. http://ojs.unemi.edu.ec/index.php/cienciaunemi/article/view/308. [ Links ]
Bayraktaroglu, G. y Atrek, B. (2010). Testing the superiority and dimensionality of SERVQUAL vs. SERVPERF in higher education. The Quality Management Journal, 17(1), 47-59. https://doi.org/10.1080/10686967.2010.11918260. [ Links ]
Burr, C., Piñó, A., Quiroz, L. A. y Martín-Lunas, E. (2011). Guía para el paciente participativo. http://rendiciondecuentas.org.mx/wp-content/uploads/2013/04/guia_paciente_participativo.pdf. [ Links ]
Cabello, E. y Chirinos, J. L. (2012). Validación y aplicabilidad de encuestas SERVQUAL modificadas para medir la satisfacción de usuarios externos en servicios de salud. Revista Médica Herediana, 23(2), 88-95. https://doi.org/10.20453/rmh.v23i2.1037. [ Links ]
Castellano, S., Peña, O. y Suárez, D. (2019). Calidad de servicio en centros maternopediátricos del estado Zulia en Venezuela. Revista Venezolana de Gerencia, 24(86), 395-409. http://www.redalyc.org/articulo.oa?id=29059356006. [ Links ]
Centro Latinoamericano de Administración para el Desarrollo (CLAD) (2008). Carta Iberoamericana de Calidad en la Gestión Pública. https://clad.org/wp-content/uploads/2020/07/CartaIberoamericana-de-Calidad-en-la-Gestion-Publica-06-2008.pdf. [ Links ]
Cevallos, J. (2015). Medición de la calidad del servicio de un comedor universitario utilizando SERVQUAL y desarrollo de un modelo de ecuaciones estructurales. Industrial Data, 18(1), 31-39. https://doi.org/10.15381/idata.v18i1.12064. [ Links ]
Colmenares, O. y Saavedra, J. (2007). Aproximación teórica de los modelos conceptuales de la calidad del servicio. Técnica Administrativa, 6(32), 138-175. https://dialnet.unirioja.es/servlet/articulo?codigo=2934571. [ Links ]
Cortina, J. M. (1993). What is coefficient alpha? An examination of theory and applications. Journal of Applied Psychology, 78, 98-104. https://doi.org/10.1037/0021-9010.78.1.98. [ Links ]
Cronbach, L. J. (1951). Coefficient alpha and the internal structure of tests. Psychometrica, 16(3), 297- 334. https://doi.org/10.1007/BF02310555. [ Links ]
Cronin, J. y Taylor, S. (1992). Measuring service quality: A reexamination and extension. Journal of Marketing, 56(3), 55-68. https://doi.org/10.1177/002224299205600304. [ Links ]
Cronin, J. y Taylor, S. (1994). SERVPERF versus SERVQUAL: Reconciling performance-based and perceptions-minus-expectations measurement of service quality. Journal of Marketing , 58(1), 125-131. https://doi.org/10.1177/002224299405800110. [ Links ]
Evans, J. R. y Lindsay, W. M. (2005). Administración y control de la calidad (6ta Ed.). Thomson. [ Links ]
Ferraces, M. J., Andrade, E. M. y Arce, C. (2000). Diferencias en la evaluación del servicio de autobús urbano desde la perspectiva del usuario. Psicothema, 12(2), 211-213. https://www.redalyc.org/pdf/727/72797051.pdf. [ Links ]
García, J. y Díaz, R. (2008). Comparativa entre distintos sistemas de mediación de calidad de servicio. EsicMarket, 130, 57-97. https://revistasinvestigacion.esic.edu/esicmarket/index.php/esicm/issue/view/15. [ Links ]
Gobierno del Estado de Oaxaca (2016). Plan Estatal de Desarrollo 2016-2022. https://www.finanzasoaxaca.gob.mx/pdf/planes/Plan_Estatal_de_Desarrollo_2016-2022.pdf. [ Links ]
Gobierno Municipal de Ciudad Ixtepec (2014). Plan Municipal de Desarrollo 2014-2016. http://sisplade.oaxaca.gob.mx//BM_SIM_Services/PlanesMunicipales/2014_2016/014.pdf. [ Links ]
Grönroos, C. (1984). A service quality model and its marketing implications. European Journal of Marketing , 18(4), 36-44. https://doi.org/10.1108/eum0000000004784. [ Links ]
Hamui, L., Fuentes, R., Aguirre, R. y Ramírez, O. F. (2013). Expectativas y experiencias de los usuarios del Sistema de Salud en México: Un estudio de satisfacción con la atención médica. UNAM. http://www.facmed.unam.mx/bmnd/SatisfaccionAtencionMedica.pdf. [ Links ]
Henao, D. E., Giraldo, A. y Yepes, C. E. (2018). Instrumentos para evaluar la calidad percibida por los usuarios en los servicios de salud. Revista Gerencia y Políticas de Salud, 17(34), 1-13. https://doi.org/10.11144/Javeriana.rgps17-34.iecp. [ Links ]
Hernández S., R., Fernández, C. C. y Baptista P. L. (2010). Metodología de la investigación (5ta Ed.). Mc Graw Hill. [ Links ]
Ho, L., Feng, S. y Yen, T. (2014). A new methodology for customer satisfaction analysis: Taguchi’s signal-to-noise ratio approach. Journal of Service Science and Management, 7, 235-244. https://doi.org/10.4236/jssm.2014.73021. [ Links ]
Holgado F., Suárez J. y Morata M. (2019). Modelos de ecuaciones estructurales, desde el path analysis al análisis multigrupo. Madrid: Sanz y Torres. [ Links ]
Ibarra, L. E. y Casas, E. V. (2015). Aplicación del modelo Servperf en los centros de atención Telcel, Hermosillo: una medición de la calidad en el servicio. Contaduría y Administración, 60(1), 229- 260. https://doi.org/10.1016/s0186-1042(15)72153-4. [ Links ]
Instituto Nacional de las Mujeres (2013). El Trabajo de cuidados. ¿Responsabilidad compartida? Disponible en: http://cedoc.inmujeres.gob.mx/documentos_download/101231.pdf. [ Links ]
Jain, S. K. y Gupta, G. (2004). Measuring service quality: SERVQUAL vs. SERVPERF scales. Vikalpa, 29(2), 25-38. https://doi.org/10.1177/0256090920040203. [ Links ]
Jaráiz, E. y Pereira, M. (2014). Guía para la realización de estudios de análisis de la demanda y de evaluación de la satisfacción de los usuarios. Segunda edición. AEVAL. [ Links ]
Johnson, R. y Wichern, D. (2007). Applied Multivariate Statistical Analysis. Sixth Edition. PearsonPrentice Hall. [ Links ]
Le, P. T. y Fitzgerald, G. (2014). Applying the SERVPERF scale to evaluate quality of care in two public hospitals at Khanh Hoa Province, Vietnam. Asian Pacific Journal of Health Management, 9(2), 66-76. https://search.informit.org/doi/10.3316/INFORMIT.402985086006957. [ Links ]
Monroy, M. A. y Urcádiz, F. J. (2019). Calidad en el servicio y su incidencia en la satisfacción del comensal en restaurantes de La Paz, México. Investigación Administrativa, 48(123). https://doi.org/10.35426/IAv48n123.06. [ Links ]
Organización de las Naciones Unidas (2015). Objetivos de Desarrollo Sostenible. Objetivo 3. https://www.un.org/sustainabledevelopment/es/health/. [ Links ]
Padma, P., Rajendran, C. y Sai Lokachari, P. (2010). Service quality and its impact on customer satisfaction in Indian hospitals. Benchmarking: An international journal, 17(6), 807-841. https://doi.org/10.1108/14635771011089746. [ Links ]
Parasuraman, A., Zeithaml, V. A. y Berry, L. L. (1985). A conceptual model of service quality and its implications for future research. Journal of Marketing , 49(4), 41-50. https://doi.org/10.1177/002224298504900403. [ Links ]
Parasuraman, A., Zeithaml, V. A. y Berry, L. L. (1988). SERVQUAL: A multiple-item scale for measuring consumer perceptions of service quality. Journal of Retailing, 64(1), 12-40. https://www.researchgate.net/publication/225083802_SERVQUAL_A_multiple-_Item_Scale_for_measuring_consumer_perceptions_of_service_quality. [ Links ]
Pedraja, L., Valdés, G., Riveros, I. y Santibañez, D. (2019). Percepción de la calidad de servicio de salud en la ciudad de Arica, Chile: Hacia un plan de mejora. Interciencia, 44(9), 514-520. http://www.redalyc.org/articulo.oa?id=33961096009. [ Links ]
Pedraza, N. A., Lavín, J. y Bernal, I. (2014). Evaluación de la calidad del servicio en la administración pública en México: estudio multicaso en el sector salud. Estado, Gobierno, Gestión Pública, 23, 25-49. https://dialnet.unirioja.es/servlet/articulo?codigo=5604751. [ Links ]
Pedraza, N. A., Bernal, I., Lavín, J. y Lavín, J. F. (2015). La calidad del servicio: Caso UMF. Conciencia Tecnológica, 49, 39-45. http://www.redalyc.org/articulo.oa?id=94438997005. [ Links ]
Peitzika, E., Chatzi, S. y Kissa, D. (2020). Service quality expectations in the fitness center context: A validation of the expectations component of the SERVQUAL scale in Greece. Services Marketing Quarterly, 41(2), 89-104. https://doi.org/10.1080/15332969.2020.1742977. [ Links ]
Roslan, A., Mohd, N. y Wahab, E. (2015). Service quality: A case study using SERVQUAL model. Advanced Science Letters, 21(6), 2159-2162. https://doi.org/10.1166/asl.2015.6243. [ Links ]
Ruiz, J. (2012). Calidad en la gestión pública: del azar a la necesidad. Revista del CLAD. Reforma y Democracia, 54, 63-94. https://www.redalyc.org/pdf/3575/357533686003.pdf. [ Links ]
Sáenz, J. G. y Serrano, I. E. (2012). El sistema de gestión de la calidad como modelo de cambio organizacional en el sector público colombiano. Signos, 4(1), 15-33. https://revistas.usantotomas.edu.co/index.php/signos/article/view/953. [ Links ]
Salomi, G., Miguel, P. y Abackerli, A. (2005). SERVQUAL x SERVPERF: Comparação entre instrumentos para avaliação da qualidade de serviços internos. Gestão & Produção, 12(2), 279-293. https://doi.org/10.1590/S0104-530X2005000200011. [ Links ]
Subiyakto, B., Kot, S. y Syaharuddin, S. (2020). The government reform on healthcare facilities from the standpoint of service quality performance. International Journal of Economics and Finance Studies, 12(1), 16-31. https://doi.org/10.34109/ijefs.202012102. [ Links ]
Teshnizi, S., Aghamolaei, T., Kahnouji, K., Teshnizi, S. y Ghani, J. (2018). Assessing quality of health services with the SERVQUAL model in Iran. A systematic review and meta-analysis. International Journal for Quality in Health Care, 30(2), 82-89. https://doi.org/10.1093/intqhc/mzx200. [ Links ]
Torres, J. y Luna, I. (2017). Assessment of banking service quality perception using the SERVPERF model. Contaduría y Administración , 62(4), 1294-1316. https://doi.org/10.1016/j.cya.2017.06.011. [ Links ]
Torres, M., Vásquez, C. y Luna, M. (2011). Análisis estratégico de la evaluación de la calidad del servicio en el sector público. Compendium, 27, 39-59. https://www.redalyc.org/articulo.oa?id=88024213003. [ Links ]
Universidad de Almería (2015). Informe de resultados de la evaluación de la satisfacción de usuarios de los servicios administrativos de la Universidad de Almería, 2014. Disponible en: https://docplayer.es/22755467-Editorial-universidad-de-almeria.html. [ Links ]
Valenzo, M. A., Lázaro, D. A. y Martínez, J. A. (2019). Application of the SERVQUAL model to evaluate the quality in the transportation service in Morelia, Mexico. DYNA, 86(211), 64-74. http://doi.org/10.15446/dyna.v86n211.78368. [ Links ]
Vargas, A. y Rodríguez, F. (2011). Barreras culturales organizacionales en la implementación de sistemas de gestión de calidad en las entidades del sector público en Colombia. Signos, 3(1), 71-91. https://revistas.usantotomas.edu.co/index.php/signos/article/view/927. [ Links ]
Yu, M. y Hyun, S. S. (2019). The impact of foreign flight attendant´s service quality on behavioral intention toward their home country-applied Servperf model. Sustainability, 11(15), 4136. https://doi.org/10.3390/su11154136. [ Links ]
Zapata, A. (2014). Application of structural equation and servqual in a health service. DYNA , 81(186), 166-174. https://doi.org/10.15446/dyna.v81n186.39803. [ Links ]
Zeithaml, V. A., Parasuraman, A. y Berry, L. L. (1993). Calidad total en la gestión de servicios, Madrid: Díaz de Santos. [ Links ]
1 The simultaneity of the production and consumption of services means that, as stated by Jaráiz and Pereira (2014), quality can only be evaluated a posteriori, since it is impossible to do so prior to the perception of the service by the consumer.
2 If what happens in an automobile repair shop is taken as a reference, the final result to be evaluated by the client is the efficiency of the repair, while in the service process, the treatment and information received will be considered, among other aspects.
3 Word-of-mouth communication refers to the recommendations or experiences that users hear from others, while personal needs represent specific individual characteristics and circumstances. Likewise, the experiences had with the use of a service may influence the client's expectations, while external communications include a series of messages, printed or electronic, issued by the service companies to the clients (Zeithaml et al., 1993).
4 Tangible elements include the appearance of physical facilities, equipment, personnel, and communication materials. Reliability implies the organization's ability to perform the promised service and to do so without errors. Responsiveness means the willingness and readiness to help clients and provide prompt service. Safety denotes the knowledge and attention of employees and their ability to inspire trust and confidence. Empathy refers to the individualized attention offered by the company to its clients and the ease of access to information. For its implementation, the model uses a questionnaire that groups, around the five criteria, 22 items to measure the user's expectations before receiving the service and another 22 to identify the user's assessment once the service has been received. The items used to gauge expectations are the same as those used in the analysis of service perception, but adapted to the specific organization being studied (Parasuraman et al., 1988; Salomi et al., 2005; Torres & Luna, 2017). Once the calculations are done, when the perception is higher than the expectation, a satisfied client is obtained, and a dissatisfied one when the value of the perception is lower than that of the expectation (Jaráiz & Pereira, 2014).
5 In the specific field of health care, quality represents "one of the criteria that the health system has incorporated in the provision of its services, with the main objective of not only having technical quality (…) but also of valuing patient satisfaction (…)" (Williams, 1994, cited by Pedraza et al., 2014).
6 There are three levels of care in the health sector. The first is made up of Family Medicine Units (IMSS), Health Centers (SSA), and Family Clinics (ISSSTE), where basic services are provided, preventive measures are taken, and 80% of illnesses are treated. The second level consists of general, regional, comprehensive, and community hospitals, as well as pediatric, gynecology-obstetrics, and maternal and child hospitals. They treat patients referred by the first level of care who require specific treatments. The third corresponds to the network of highly specialized hospitals, equipped with advanced technology to treat more complex conditions (Burr et al., 2011).
Received: June 29, 2020; Accepted: May 27, 2021; Published: June 01, 2021
 Este es un artículo publicado en acceso abierto bajo una licencia
Creative Commons
Este es un artículo publicado en acceso abierto bajo una licencia
Creative Commons
