


 texto en
  Inglés (pdf)
 Artículo en XML
 Referencias del artículo
 Enviar artículo por email
 Citado por SciELO
  Similares en
SciELO
Similares en
SciELO 
 Permalink
INTRODUCTION
Coral reefs represent one of the most biodiverse and productive ecosystems on the planet, providing ecosystem services such as the provision of fishery resources, coastal protection, carbon sequestration, sediment retention for beach formation, and tourist attraction (Moberg and Folke 1999, Shepard et al. 2009). Despite their ecological and socioeconomic importance, these ecosystems have experienced accelerated degradation due to anthropogenic factors such as overfishing, eutrophication, and pollution (Hughes et al. 2003). Furthermore, over the last 2 decades, the effects of climate change, including rising temperatures, ocean acidification, and pollution, have led to the reduction of more than 60% of coral cover worldwide (Hughes et al. 2017, Boström et al. 2020). In the Caribbean, live coral cover has drastically decreased from ~50% in 1980 to ~10% in 2024 (Gardner et al. 2003, Perera-Valderrama et al. 2017, Reimer et al. 2024).
The construction and maintenance of coral reefs depend on the accumulation of calcium carbonate (CaCO₃) by hermatypic corals, which contribute structural complexity to the ecosystem (Spalding et al. 2001, González-Barrios et al. 2018, Tortolero-Langarica et al. 2023). Specifically, a reduction in the abundance of reef-building species such as Acropora spp. and Orbicella spp. has been documented (Álvarez-Filip et al. 2011). Although a relative recovery of coral reefs has been recorded at some Caribbean sites, this has been dominated by low-relief species with low building capacity (González-Barrios et al. 2018, Gouezo 2019). Nevertheless, the increase in frequency, intensity, and severity of current disturbances has notably limited natural recovery (Cheal 2017, Hughes et al. 2018).
In the face of the accelerated loss of coral cover, active restoration strategies have been implemented worldwide to mitigate reef deterioration and promote their recovery (Rinkevich 2019). Among these strategies, coral transplantation has been established as one of the most widely used and most successful in the medium and long term (Boström-Einarsson et al. 2020). In this context, microfragmentation has emerged as an alternative method for coral restoration, based on the extraction of small fragments (<3 cm²) of live tissue from a small portion of donor colonies (Page et al. 2018; Tortolero-Langarica et al. 2020, 2023). Observations indicate that the removal of a small fraction of tissue (<10% of the total) does not compromise the viability of the donor colony and promotes a relatively rapid recovery in some coral species (Padilla-Souza et al. 2023). However, regenerative capacity is primarily influenced by the health status of the donor colony, which is more efficient in healthy colonies (Rodríguez-Martínez et al. 2016). Nonetheless, some physiological processes, such as growth and reproduction, could be affected due to the redistribution of energy resources towards regeneration and repair (Carricart-Ganivet 2007).
Microfragmentation has shown promising results in coral reef restoration, but it is still in its early stages of development. Uncertainties exist regarding its effect on the health, growth, and recovery of donor colonies, which highlights the need for long-term research to evaluate its efficacy and relationship to environmental conditions. In this context, the objective of this study was to evaluate the efficiency of self-recovery of live tissue in colonies of the reef-building coral Orbicella faveolata used as donors and their growth response over 2 years.
MATERIALS AND METHODS
Growth parameters
The study was carried out from May 2021 to May 2023 in the Puerto Morelos Reefs National Park in the northern Mexican Caribbean (21°00′00″ to 20°48′33″N, 86°53′14.94″ to 86°46′38.94″W). Five adult colonies with the same morphology and size (~100 cm height), and a healthy appearance (no evidence of disease, erosion, bleaching, or competition) were selected at a depth of 5-8 m. For each colony, 3 to 6 small circular fragments (for a tissue transplant project) with radiuses of ~20-30 mm and depths of 20 mm were extracted using a submersible hydraulic electric drill (Nemo Power Tools, Tucson, USA) with a 30-mm diameter diamond-tipped cylindrical drill tip, producing bare areas of tissue (~1,250 mm2) with ~30-mm depths. Each month for 24 months, we monitored and evaluated the recovery of the bare tissue areas that resulted from harvesting donor tissue in terms of surface growth (area), radial growth (longitudinal and transverse diameters), and the number of new polyps formed. To achieve this, we used digital photography (Hero 10; GoPro, San Mateo, USA) in linear format and 25 MP resolution using a plastic Vernier caliper (precision: 0.5 mm) as a reference scale. Images derived from monthly samplings were processed using the freely available software ImageJ v. 1.53t (Schneider et al. 2012). To determine the recovered surface growth, the outline of the bare cavity of live coral tissue (mm2) was measured. To obtain the values for both diameters, the maximum length (mm) was measured using 2 perpendicular lines (longitudinal and transverse) taken at the same reference angle for each month. To obtain the number of new polyps, the increase (number) of calyces with living tissue from the initial bare area was recorded from an aerial perspective.
Environmental variables
The environmental variables sea surface temperature (SST, °C) and photosynthetically active radiation (PAR, µmol quanta·d-1) were used in this study to describe the influence of external factors on the self-recovery of living tissue of the massive coral O. faveolata. Hourly data for both parameters were obtained from the Sistema Académico de Monitoreo Meteorológico y Oceanográfico (SAMMO) of the Unidad Académica de Sistemas Arrecifales, Instituto de Ciencias del Mar y Limnología, Universidad Nacional Autónoma de México (SAMMO 2025) for the study months (May 2021 to May 2023), which were averaged to obtain a monthly value and associate it to coral growth.
Statistical analyses
Descriptive values were calculated for each variable (mean, range, maximum, and minimum). The assumptions of normality (Kolmogorov-Smirnoff, P < 0.05) and homoscedasticity (Bartlett, P < 0.05) were also tested. Because the data did not have a normal distribution and variances were not homogeneous, we perfomed two-way analyses of variance (ANOVA) with repeated measures using generalized linear models (GLM) to evaluate differences at the colony level, in time (monthly), and in their respective interactions. Simple linear regression models (coefficient of determination, r 2) were also used to identify the relationship between growth characteristics and environmental factors (temperature and PAR). All statistical analyses were performed using Sigma Plot v. 11.0 (Systat Software, Inc., San Jose, USA), using a 95% confidence interval (α = 0.05).
RESULTS
Surface growth
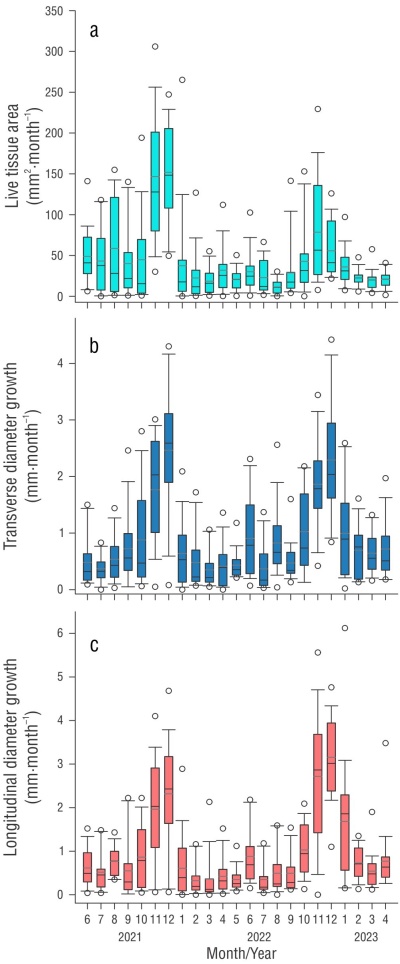
After a 24-month period, the bare areas showed an average recovery of 1,065 ± 237 mm2 in live tissue area when all colonies were grouped together, with a monthly average of 29.50 ± 19.40 (range: 11.50-150.18 mm2) (Table 1) and a total recovery of 97% (Fig. 1). The results showed significant differences over time (F 22 = 10.212, P < 0.001) (Fig. 2), but no differences were found at the colony level (F 4 = 1.788, P = 0.196) or in the interaction (F 88 = 0.978, P = 0.538) (Table S1). A posteriori results showed differences between the months of the period June-August (lower growth) and those of the period November-February (higher growth), with the same interannual trend during both years of study (Fig. 2).
Table 1 Monthly averages of the growth parameters (± SD), real area (mm2·month-1), diameters (mm·month⁻¹), and number of polyps (N· month-1) in fragments of Orbicella faveolata. Descriptions of environmental factors, such as sea surface temperature (SST) and photosynthetically active radiation (PAR), for the Puerto Morelos Reef National Park.
| Month | Real area (mm2·month-1) | Transverse diameter (mm·month-1) | Longitudinal diameter (mm·month-1) | Polyps (N·month-1) | SST (°C) | PAR (µmol quanta·d-1) |
| June 2021 | 48.9 ± 32.8 | 0.48 ± 0.46 | 0.62 ± 0.44 | 0.39 ± 0.70 | 29.61 ± 1.09 | 52,539 ± 39,084 |
| July 2021 | 43.2 ± 38.6 | 0.35 ± 0.30 | 0.52 ± 0.47 | 0.61 ± 0.78 | 30.54 ± 1.02 | 51,542 ± 42,297 |
| August 2021 | 58.7 ± 57.9 | 0.54 ± 0.39 | 0.77 ± 0.32 | 1.94 ± 1.47 | 30.56 ± 1.10 | 60,112 ± 40,072 |
| September 2021 | 40.0 ± 41.6 | 0.72 ± 0.64 | 0.55 ± 0.67 | 0.22 ± 0.55 | 30.09 ± 0.97 | 54,275 ± 38,510 |
| October 2021 | 44.7 ± 53.9 | 0.88 ± 0.88 | 0.87 ± 0.71 | 0.17 ± 0.38 | 29.94 ± 0.88 | 54,513 ± 34,755 |
| November 2021 | 146.7 ± 74.3 | 1.77 ± 0.88 | 1.96 ± 1.19 | 0.78 ± 0.81 | 27.21 ± 0.87 | 42,145 ± 28,672 |
| December 2021 | 151.8 ± 58.6 | 2.47 ± 1.13 | 2.32 ± 1.29 | 0.44 ± 0.51 | 27.02 ± 1.02 | 44,825 ± 28,663 |
| January 2022 | 37.3 ± 62.6 | 0.64 ± 0.59 | 0.61 ± 0.74 | 2.61 ± 2.44 | 25.95 ± 1.15 | 42,612 ± 30,077 |
| February 2022 | 22.3 ± 31.6 | 0.48 ± 0.53 | 0.32 ± 0.33 | 0.83 ± 0.92 | 26.48 ± 1.10 | 52,144 ± 34,325 |
| March 2022 | 18.4 ± 16.0 | 0.35 ± 0.30 | 0.36 ± 0.54 | 0.78 ± 1.17 | 27.18 ± 1.11 | 61,573 ± 37,202 |
| April 2022 | 31.9 ± 29.5 | 0.42 ± 0.39 | 0.43 ± 0.41 | 0.67 ± 0.84 | 28.01 ± 1.19 | 63,577 ± 40,322 |
| May 2022 | 20.5 ± 12.7 | 0.43 ± 0.24 | 0.35 ± 0.27 | 0.33 ± 0.55 | 29.14 ± 0.94 | 61,381 ± 37,809 |
| June 2022 | 29.9 ± 24.8 | 0.91 ± 0.73 | 0.88 ± 0.63 | 0.61 ± 0.50 | 29.71 ± 1.35 | 57,781 ± 38,243 |
| July 2022 | 22.8 ± 20.4 | 0.37 ± 0.42 | 0.35 ± 0.38 | 0.06 ± 0.24 | 30.72 ± 0.91 | 60,327 ± 38,043 |
| August 2022 | 11.5 ± 8.9 | 0.82 ± 0.62 | 0.49 ± 0.51 | 0.78 ± 2.10 | 30.98 ± 0.94 | 58,666 ± 38,903 |
| September 2022 | 28.7 ± 25.5 | 0.47 ± 0.34 | 0.50 ± 0.47 | 0.67 ± 0.97 | 30.41 ± 1.03 | 52,459 ± 38,394 |
| October 2022 | 42.8 ± 40.9 | 1.03 ± 0.71 | 1.03 ± 0.58 | 1.28 ± 1.56 | 28. 80 ± 1.06 | 53,917 ± 33,296 |
| November 2022 | 78.6 ± 64.1 | 1.86 ± 0.75 | 2.72 ± 1.48 | 1.67 ± 1.37 | 28.59 ± 0.69 | 49,863 ± 29,993 |
| December 2022 | 55.7 ± 32.5 | 2.29 ± 1.06 | 3.15 ± 0.91 | 1.39 ± 1.14 | 27.25 ± 0.86 | 43,210 ± 29,090 |
| January 2023 | 36.0 ± 22.3 | 1.00 ± 0.78 | 1.68 ± 1.42 | 0.39 ± 0.50 | 26.5 ± 0.98 | 54,809 ± 51,616 |
| February 2023 | 22.5 ± 9.5 | 0.70 ± 0.44 | 0.73 ± 0.36 | 0.33 ± 0.49 | 26.85 ± 0.79 | 75,159 ± 44,280 |
| March 2023 | 20.1 ± 12.0 | 0.64 ± 0.37 | 0.54 ± 0.40 | 0.17 ± 0.39 | 27.18 ± 1.06 | 67,717 ± 51,804 |
| April 2023 | 20.7 ± 10.5 | 0.72 ± 0.51 | 0.77 ± 0.72 | 0.67 ± 0.49 | 28.42 ± 0.84 | 68,402 ± 36,762 |
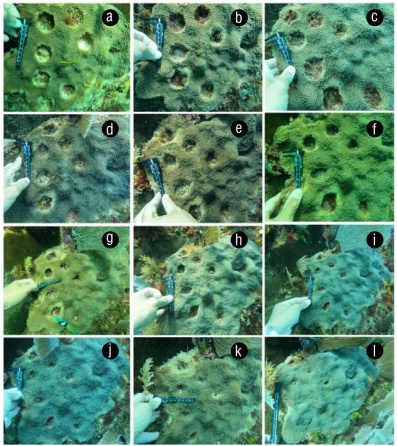
Figure 1 Coral tissue recovery experiment over a 2-year period. Bare area one month after Orbicella faveolata fragments were removed (June 2021) (a). Progress in recovery of damaged tissue in August 2021 (b), October 2021 (c), December 2021 (d), February 2022 (e), April 2022 (f), June 2022 (g), August 2022 (h), October 2022 (i), December 2022 (j), and February 2023 (k), and the recovered area at the end of the study (May 2023) (l).
Transverse and longitudinal diameters
For transverse diameters, the average accumulated growth was 20.97 mm with an average monthly rate of 0.88 ± 0.60 mm (range: 0.35 ± 2.47) (Table 1 and 2) and a 96% recovery at the end of the study (Fig. 1). The results showed differences between colonies (F 4 = 3.369, P = 0.046) and between months (F 22 = 11.981, P < 0.001), but not in the interaction of colonies × months (F 88 = 0.994, P = 0.502). For longitudinal diameters, the accumulated growth was 22.77 mm with a monthly average of 0.98 ± 0.40 mm (range: 0.32 ± 3.15) and a recovery percentage of 94% (Table 2). Similarly, the results revealed no differences between colonies (F 4 = 3.132, P = 0.056), but they showed differences between months (F 22 = 16.274, P < 0.001) and the interaction of colonies × months (F 88 = 1.576, P = 0.003) (Table S1). In both cases, the differences were associated with the months of November and December of both years, which had the highest monthly values (Fig. 2).
Table 2 Accumulated growth (±SD) and recovery (%) for the area (mm2) and transverse and longitudinal diameters (mm) in bare tissue areas of Orbicella faveolata.
| Month | Accumulated area (mm2) | Accumulated area (%) | Transverse diameter (mm) | Transverse diameter (%) | Longitudinal diameter (mm) | Longitudinal diameter (%) |
| June 2021 | 48.9 ± 32.8 | 4.45% | 0.48 ± 0.46 | 2.19% | 0.62 ± 0.44 | 3.08% |
| July 2021 | 92.1 ± 60.1 | 8.38% | 0.85 ± 0.51 | 3.86% | 0.68 ± 0.42 | 3.39% |
| August 2021 | 150.8 ± 92.1 | 13.72% | 1.39 ± 0.53 | 6.30% | 1.28 ± 0.64 | 6.42% |
| September 2021 | 190.9 ± 107.4 | 17.36% | 2.11 ± 0.78 | 9.59% | 1.53 ± 0.57 | 7.64% |
| October 2021 | 235.7 ± 148.6 | 21.43% | 2.99 ± 1.16 | 13.59% | 2.01 ± 1.08 | 10.03% |
| November 2021 | 382.4 ± 197.5 | 34.77% | 4.76 ± 1.94 | 21.62% | 2.92 ± 1.47 | 14.58% |
| December 2021 | 534.2 ± 212.8 | 48.56% | 7.22 ± 2.90 | 32.82% | 4.75 ± 2.72 | 22.86% |
| January 2022 | 571.6 ± 224.7 | 51.96% | 7.86 ± 3.05 | 35.73% | 5.30 ± 2.29 | 26.52% |
| February 2022 | 594.0 ± 228.6 | 54.00% | 8.34 ± 3.19 | 37.90% | 5.24 ± 3.05 | 26.19% |
| March 2022 | 612.4 ± 225.6 | 55.68% | 8.69 ± 3.30 | 39.49% | 5.66 ± 2.20 | 28.31% |
| April 2022 | 644.3 ± 217.2 | 58.58% | 9.10 ± 3.34 | 41.38% | 5.99 ± 2.99 | 28.45% |
| May 2022 | 664.9 ± 215.5 | 60.45% | 9.54 ± 3.48 | 43.35% | 6.13 ± 2.31 | 30.65% |
| June 2022 | 694.9 ± 205.7 | 63.17% | 10.44 ± 3.68 | 47.47% | 6.28 ± 3.34 | 31.41% |
| July 2022 | 717.7 ± 200.8 | 65.25% | 10.81 ± 3.79 | 49.14% | 6.98 ± 3.42 | 34.90% |
| August 2022 | 729.2 ± 199.2 | 66.30% | 11.63 ± 3.53 | 52.88% | 7.44 ± 3.54 | 37.19% |
| September 2022 | 758.0 ± 180.6 | 68.91% | 12.11 ± 3.54 | 55.03% | 7.87 ± 3.56 | 39.36% |
| October 2022 | 800.8 ± 181.4 | 72.80% | 13.13 ± 3.73 | 59.69% | 8.63 ± 3.77 | 43.13% |
| November 2022 | 879.4 ± 206.7 | 79.95% | 15.00 ± 4.08 | 68.17% | 9.83 ± 4.32 | 49.14% |
| December 2022 | 935.1 ± 198.4 | 85.01% | 17.29 ± 4.40 | 78.59% | 12.98 ± 4.43 | 64.92% |
| January 2023 | 971.1 ± 210.0 | 88.29% | 18.28 ± 4.30 | 83.11% | 14.67 ± 3.93 | 73.33% |
| February 2023 | 993.7 ± 209.7 | 90.34% | 18.98 ± 4.31 | 86.28% | 15.31 ± 3.91 | 76.97% |
| March 2023 | 1,029.7 ± 222.8 | 93.61% | 19.98 ± 4.32 | 90.81% | 17.08 ± 3.92 | 85.38% |
| April 2023 | 1,065.7 ± 23.72 | 96.89% | 20.97 ± 4.59 | 95.33% | 18.76 ± 4.41 | 93.79% |
Polyp formation
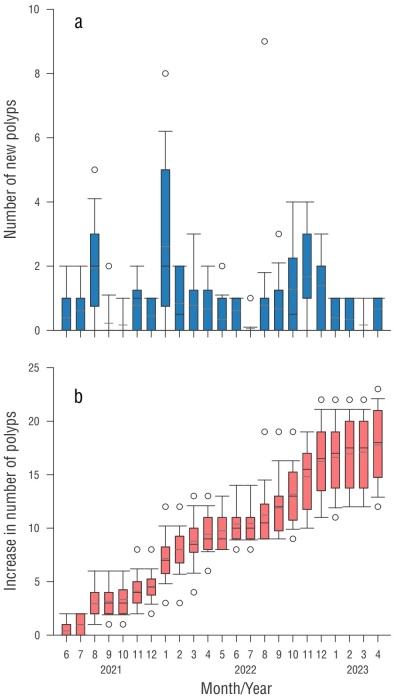
The damaged (donated) area showed a cumulative number of new polyps of 18 after 24 months of monitoring, with an increase of 0.77 ± 0.91 polyps monthly (Tables 1 and 2). The increase in the number of polyps between colonies showed significant differences, and variations were also present in time and in the interaction between colonies × months (Table S1), mainly in the warmer months (August to October) (Fig. 3) when the highest values ocurred.
Environmental variables
Monthly temperature averaged 28.62 °C (range: 25.95-30.56 °C) (Table 1). The highest temperatures were observed from July to September (~30.32 °C) and the lowest from January to February (~26.21 °C). Light averaged 52,286 µmol quanta·d-1, ranging from 42,145 µmol quanta·d-1 (November) to 60,112 µmol quanta·d-1 (August) (Table 1). The highest light intensity was observed during the month of August, coinciding with the highest temperature values. Linear regression analysis only showed a negative correlation with the PAR factor and all growth parameters (P < 0.005) (Fig. 4).
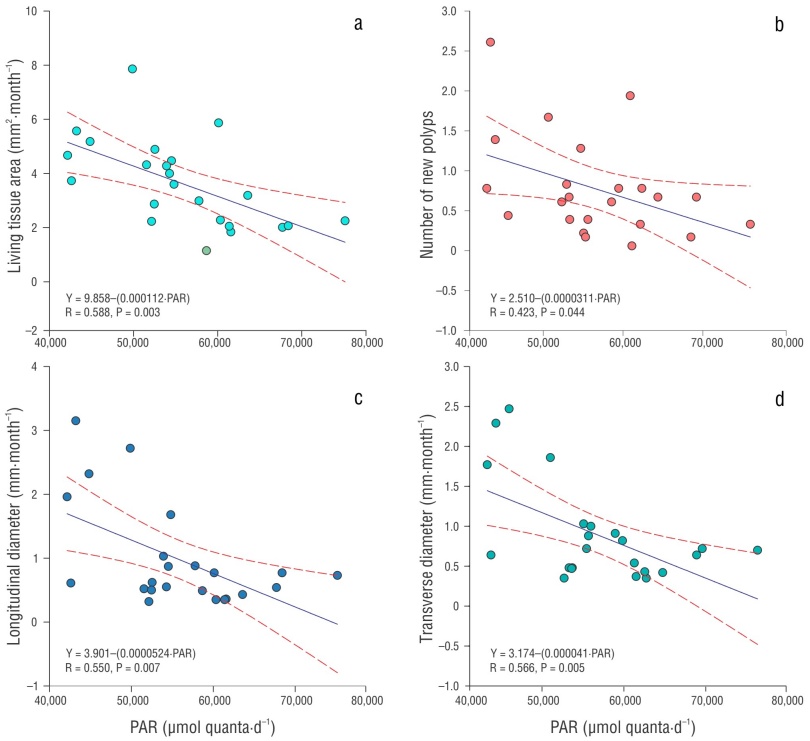
Figure 4 Scatter plot of monthly Orbicella faveolata parameters and photosynthetically active radiation (PAR) over 2 years (2021-2023). Area of recovered tissue vs. PAR (a), number of new polyps vs. PAR (b), transverse diameter vs. PAR (c), and longitudinal diameter vs. PAR (d). A regression line and equation for the latter relationship are shown.
DISCUSSION
This study demonstrates rapid recovery from microfragmentation injuries in a relatively short period (24 months) in healthy O. faveolata colonies. This result is similar to previous reports on tissue regeneration in coring wounds in species from the Mexican Caribbean region (Rodríguez-Martínez et al. 2016), which highlight that recovery can be high (>80%) when the donor colony is in optimal health conditions (i.e., without bleaching damage, disease, or competition for space). Nevertheless, this regenerative capacity can vary due to extrinsic factors, such as environmental microconditions, interspecific interactions, and injury severity (Meesters et al. 1996, Martínez et al. 2016).
Given the environmental regime that influenced Puerto Morelos Reefs National Park during the study period, the growth and recovery rates of live tissue in donor colonies responded primarily to intra-annual variations in light irradiance and temperature. These factors could determine the energy supplied by symbionts to the coral and, consequently, the recovery capacity (Allemand et al. 2011). The results of this study showed a relative variability (10-40%) in live tissue recovery, with improved injury repair observed when SST and PAR had average values of 28-29 °C and 48,078 µmol quanta·d⁻¹, respectively. The temporal variability pattern has also been documented in massive corals from other Pacific regions, where their recovery capacity is usually greater under optimal light (400-700 nm) and temperature (26-29 °C) conditions, favoring physiological processes such as growth, calcification, and repair of damaged tissue (Lough and Barnes 2000, Tortolero-Langarica et al. 2020). Contrary to expectations, the warmer months (August to October) showed the lowest values for injury regeneration parameters, which was related to the highest irradiance (Fig. 3) and temperature values (Van Woesik 1998). High radiation and elevated temperatures could have influenced the reduced rate of calcification and recovery from lesions, possibly due to a decreased photosynthetic efficiency of algae (i.e., from the Symbiodinacea family) due to light stress (Allemand et al. 2011, Gutiérrez-Estrada et al. 2025). Alternatively, differences in regeneration rates may be attributable to variables such as wound size and intrinsic characteristics, including the genotypes of both the coral host and its symbiont. Studies have shown that recovery rates tend to be relatively low in large lesions (≤1,310 mm2; Van Woesik 1998) and in colonies with disease or partial mortality (Rodríguez-Martínez et al. 2016). Therefore, it is essential to consider these intrinsic factors when using or extracting living tissue (Allemand et al. 2011, Padilla-Souza et al. 2023).
In addition, in the present study, a high percentage of live tissue recovery (>90%) and regeneration of new polyps were observed, which could favor pigmentation replacement and an improved photosynthetic efficiency (Sabine et al. 2015). Recovery from lesions has been shown to be primarily mediated by key physiological processes, such as polyp reproduction and cloning, which may exhibit seasonal patterns (Selman et al. 2012). Likewise, a lower tissue regenerative capacity has been observed before or after spawning events, because the energy requirement for gametogenesis is greater during the reproductive period (Kramarsky-Winter and Loya 2000). The observed reproductive pattern, which occurred between December and early February, suggests that coral gamete maturation coincides with the warm season. This distribution of energy between reproduction and tissue regeneration could explain the reduction in the regenerative capacity recorded in this study (Stearns 1989, Selman et al. 2012). Thus, it is essential to consider these effects when planning sampling to optimize the success of tissue regeneration, particularly in interventions involving microfragment transplantation.
CONCLUSIONS
The results suggest that the use of live tissue in massive corals can be an effective strategy for active interventions without compromising the health of donor colonies on the reef. However, several factors must be considered before this can be implemented. Among them, the health status of the colony and extrinsic factors, such as the timing of tissue extraction in relation to optimal environmental conditions (e.g., SST and PAR), are crucial for maximizing growth and the capacity for damage repair. It is recommended to avoid periods in which the influence of thermal anomalies or disease outbreaks could compromise the resilience of O. faveolata populations. The use of live tissue for transplantation is still in its initial development phase; thus, further exploration of its limitations is necessary for large-scale implementation. This will provide key information to improve management strategies for reefs in the Mexican Caribbean.

