


 texto en
  Inglés (pdf)
 Artículo en XML
 Referencias del artículo
 Enviar artículo por email
 Citado por SciELO
  Similares en
SciELO
Similares en
SciELO 
 Permalink
INTRODUCTION
Coral reefs are massive, rigid, wave-resistant calcium carbonate structures built primarily by the skeletons of successive generations of scleractinian corals (Done 2011). They are ecosystems of great ecological importance. Among the ecosystem services they provide, coral reefs serve as primary coastal protection by mitigating wave force and preventing erosion during tropical storms and hurricanes (Ferrario et al. 2014). Likewise, coral reefs have a high structural complexity that provides refuge and nursery habitats for various species of commercial importance, and they are economically relevant due to the income the tourism sector generates through the sports and recreational activities that take place there (Woodhead et al. 2019).
In general, corals inhabit oligotrophic waters with low nutrient and sediment concentrations and a temperature range between 25 and 29 °C (Lough and van Oppen 2018). They are stenotolerant organisms, that is, organisms with a narrow tolerance to changes in environmental variables due to the symbiosis they maintain with endosymbiotic dinoflagellates of the Symbiodiniaceae family (Grimsditch and Salm 2005, Quigley et al. 2018). These endosymbionts, through photosynthesis, provide corals with more than 90% of the energy needed to carry out essential functions such as growth, calcification, reproduction, tissue repair after injury, mucus production, and defense against predators (LaJeunesse et al. 2018, Lough and van Oppen 2018).
Rising temperatures, sediments, and pollutants negatively impact coral health and recovery, as do human activities and coastal development (Grimsditch and Salm 2005). One sign of the severity of the situation is the increase in the frequency and intensity of coral bleaching events (Warner and Suggett 2016). Bleaching occurs as a stress response to changes in environmental variables (Rosenberg and Loya 2004), which cause the degradation or expulsion of zooxanthellae from polyp tissue, resulting in a loss of photosynthetic pigments (Jokiel 2004).
Rising sea surface temperatures, especially the accumulated heat to which corals are exposed, are the primary cause of stress that leads to bleaching in coral colonies (Eakin et al. 2009). Cumulative heat stress is typically measured in degrees Celsius, as the cumulative weekly temperature anomalies above the historical maximum monthly mean (MMM) of the previous 12 weeks. This indicator is known as the degree heating week (DHW), and according to its scale, bleaching occurs starting at 4 DHW. As the DHW value increases, the risk of widespread mass bleaching and high mortality increases (NOAA 2023). Nevertheless, stress and temperature are not the only triggers of bleaching. Other stressors can trigger the breakdown of symbiosis. For example, excess sediment from both rivers and wastewater discharges increases water turbidity, which triggers a reduction in photosynthetic capacity in deep zones and an increase in the energy demand for active sediment removal, which negatively affects the energy balance and survival of organisms (López-Lodoño et al. 2023). This is particularly important in reefs near river discharges because sediment stress conditions can occur recurrently.
Corals are organisms capable of recovering from bleaching injuries, whose recovery depends on several factors such as the geographic region, the type of symbiont of the colony, the percentage of affected tissue, the number of remaining symbionts, and the recovery ability and resistance of each coral species (López-Patoni 2014). For the purposes of this work, recovery from bleaching was considered as the speed with which a coral colony regains its tissue color after a bleaching event (Grimsditch and Salm 2006), and resistance to bleaching was considered as the ability of colonies to tolerate the disturbance without showing discoloration (Obura and Grimsdith 2009).
Among the species most susceptible to bleaching in the Caribbean Sea and the Gulf of Mexico are Montastraea cavernosa, Colpophyllia natans, Porites furcata, Siderestrea siderea, Pseudodiploria strigosa, Orbicella franksi, Orbicella annularis, Acropora cervicornis, Agaricia tenuifolia, and Agaricia lamarcki (González-Gándara 2008, Eakin et al. 2009, Alemu and Clement 2014, Muñiz-Castillo et al. 2024). However, coral susceptibility partly depends on their growth form; in general, genera with branched growth (acroporids) are more affected than those with massive growth, such as Colpophyllia, Montastraea, Orbicella, and Siderastrea (Loya et al. 2001).
Although the aforementioned species belong to different morphofunctional groups, they have been shown to recover from bleaching within 1-11 months, depending on the intensity of the bleaching event (Levas et al. 2018, Matsuda et al. 2020), and only S. siderea and M. cavernosa appear to be resistant to chronic sediment stress. Evidence from Caribbean islands indicates that these species are barely stressed (bleached) by sedimentation, despite being exposed to sedimentation rates of over 400 g·m-2·d-1 (Torres and Morelock 2002, Vargas-Ángel et al. 2007).
The Veracruz Reef System (VRS) is an exceptional case study for evaluating the effect of stress on corals, despite being considered one of the reef systems with the greatest exposure to colony stressors, both anthropogenic (e.g., pollution derived from urban growth and port, tourism, and fishing activities) and natural (e.g., atmospheric events such as nortes winds and hurricanes, high river discharge and sedimentation from adjacent rivers) (Salas-Pérez and Granados-Barba 2008, Ortiz-Lozano 2012). Live coral cover declined from 1960 to the late 1980s and has since remained stable at around 20% (Horta-Puga et al. 2015), although other authors have reported a decrease in cover over the same time period (e.g., Jackson et al. 2014). The VRS is located within a highly turbid environment, with average sedimentation rates during the nortes season (winter) of 500 g·m-2·d-1 (Pérez-España et al. 2012). The reef complex located in front of the town of Antón Lizardo is the one most exposed to constant sediment stress due to the contribution of the Jamapa and Papaloapan rivers (Salas-Monreal et al. 2022).
The constant disturbances to which VRS corals are exposed to, especially the rate of sediments from adjacent rivers, plus the increasing thermal stress we are experiencing worldwide (NOAA 2024), could increase the severity of bleaching, resulting in greater loss of coloration in the colonies and affecting their recovery process. Therefore, in the present study, we evaluated whether corals located on a reef near a river mouth were more severely affected and recovered more slowly after a bleaching event compared to those on a reef with low river influence. To this end, we assessed recovery (in terms of colony coloration) over an 8-month period following bleaching on 2 VRS reefs at different distances from river mouths. In addition, we assessed the health of the scleractinian coral community from 2008 to 2023. Both colony recovery and community health were considered individual resilience attributes, sensuLam et al. (2020), of scleractinian corals.
The information obtained will serve as a baseline to understand the time it takes scleractinian corals in the VRS to recover tissue color following a bleaching event and will identify differences between species that indicate specific responses for future study. Furthermore, this study provides historical data on coral health and thermal stress and sedimentation rates for future studies in the area.
MATERIALS AND METHODS
Study area
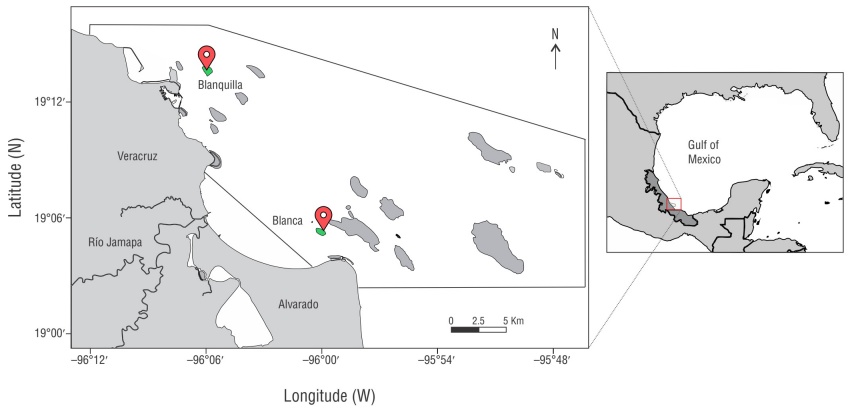
The study was carried out in the VRS, located within a protected natural area in the southwestern Gulf of Mexico, on the coast of the state of Veracruz de Ignacio de la Llave (l9°15′ to 19°02′N, 96°12′ to 95°47′W) (Lara et al. 1992). The reefs that comprise this system are divided into 2 groups: one to the north, located in front of the city and port of Veracruz, with the greatest anthropogenic impact; and the other to the south, in front of the town of Antón Lizardo, with more influence of sediments from the Jamapa and Papaloapan rivers (Krutak 1997).
To compare colony recovery and coral community health under different VRS stressors, sampling was carried out on 2 emergent platform reefs that, due to their location, are under different sediment exposure (Fig. 1): Blanquilla and Blanca. Blanquilla is located in the northern subgroup, 2 km off the coast in front of the port of Veracruz (19°13′24″N, 96°05′49″W), and has higher exposure to anthropogenic impacts from the population. Blanca is located in the southern subgroup, 2.6 km off the coast in front of the town of Antón Lizardo (19°05′06″ N, 95°59′57″W), and is exposed to higher sedimentation rates due to the influence of discharges from adjacent rivers (Pérez-España et al. 2015b).
Analyses of temperature and sedimentation rates
We used a time series of daily nighttime sea surface temperature (NSST) from January 2008 to July 2023 for the study area, along with DHW values calculated using satellite data at a 1-km resolution. This gave us information on the DHW to which the corals were exposed during the sampling process. Data were taken from the satellite-based early warning system for coral bleaching (SATcoral) on the Marine Coastal Information and Analysis System (SIMAR, for its acronym in Spanish) v. 02 website (SIMAR 2024).
To assess the sedimentation rate, a data series from the period 2012 to 2023 provided by the Comisión Nacional de Áreas Naturales Protegidas (CONANP) for the Blanquilla and Blanca reefs was analyzed. These data were collected from traps placed on the leeward side every 4 months (one per climatic season), considering the months October-February as “nortes,” March-June as “dry,” and July-October as “rainy.” The sedimentation rate was calculated in units of cm3·m-2·d-1.
A Kruskal-Wallis test was performed considering the 3 climatic seasons and the 2 reefs to understand the variation in the sedimentation rate between seasons and between reefs. On the other hand, to determine whether bleaching was influenced by both the presence of sediments and the accumulated heat values in the study area, a Spearman correlation of the sedimentation rate and DHW was performed, with the number of bleached colonies on each sampling date of both temporal analyses (short-term: 2022 to 2023; medium-term: 2008 to 2021) (Supplementary Material 1). Both the Kruskal-Wallis test and the Spearman correlation were performed after applying normality (Shapiro-Wilk) and homogeneity of variance (F test) tests to determine the suitability of using parametric analyses. Both tests indicated that the data were homogeneous (P > 0.05) but did not meet normality (P < 0.05), thus justifying the use of nonparametric statistical techniques in data processing. The analyses were performed using InfoStat v. 2020.
Fieldwork
We used 2 timescales to evaluate the condition of scleractinian corals. The first consisted of a short-term analysis focusing on the process of color recovery of colonies following the 2022 bleaching event, and the second consisted of a medium-term analysis using the CI for the 2008-2021 period.
Short-term analysis: recovery of colonies
Fieldwork consisted of SCUBA sampling in the Blanquilla and Blanca reefs. During October 2022, all colonies affected by bleaching were tagged in each reef along 2 fixed strip transects (50 m × 2 m) that were placed parallel to the leeward reef slope, at depths of 8-15 m. Each marked colony was monitored using photographs taken at a distance of ~1 m with a zenith angle using a Canon G16 camera (Tokyo, Japan) with a 6.1-30.5 mm lens (ISO: 400; exposure time: 1/80 s; focal length: 18 mm; flash: not mandatory) at 15 days (to record rapid changes), at 5 months (March 2023), and at 8.5 months (July 2023; just prior to the mass bleaching event). Subsequently, the photographs were analyzed in GIMP v. 2.10, in which the percentage of bleached tissue of the colonies was determined for each sampled period. The data were captured in an Excel database for their use in the estimation species recovery (Supplementary Material 1).
In addition, at the beginning of sampling, all colonies found along the strip transect (with and without signs of bleaching) were counted to estimate the prevalence of initial bleaching by reef and species (PIB) with the equation (1):
where BC is the number of bleached colonies and TC is the total number of colonies in the transect.
To determine colony recovery time, we used the bleaching response index (BRI), based on and modified from the index used by Matsuda et al. (2020). The BRI consisted of classifying the percentage of bleached tissue in the colonies into 6 categories represented by an individual indicator (ID) from 1 to 6: (1) colony with severe bleaching (>90% of affected tissue), (2) colony with serious bleaching (70-89% of affected tissue), (3) colony with moderate bleaching (50-69% of affected tissue), (4) colony with partial bleaching (30-49% of affected tissue), (5) colony with mild bleaching (1-29% of affected tissue), and (6) recovered colony (tissue not bleached). Based on this classification, the BRI was calculated per species using equation (2):
where ID is the bleaching category of the i-th colony (scale from 1 to 6) and N is the total number of coral colonies analyzed.
The BRI indicates the category with the largest number of colonies of the species; a value close to 6 indicates tissue color recovery in most colonies, and a value close to 1 represents bleaching of >90%. Because the index focuses on the recovery of bleached colonies, it was applied to species with more than 15 colonies and a prevalence greater than 10%. Due to the low number of colonies present in the other species, we established these criteria to ensure robust representation based on the number of colonies sampled. Furthermore, colonies that died completely during the study were reported under the category of mortality. This allowed us to describe the bleaching event by species over time, using the variations in prevalence.
To identify trends in associations between the BRI, time, and species, a redundancy analysis (RDA) was performed in CANOCO v. 4.5. To do this, the matrix of dependent variables (bleaching percentage, BRI, and death) was associated to a factorial matrix of independent variables (species), using the sampling time as a complementary variable. The first 2 canonical axes were considered significant; their significance was tested with the Monte Carlo test, using 999 permutations.
Medium-term analysis: coral index (CI)
A database from the period 2008 to 2021 of the “Monitoreo del Sistema Arrecifal Veracruzano” project provided by the coral reef laboratory of the Instituto de Ciencias Marinas y Pesquerías (ICIMAP) was analyzed. This database contains data on coral cover, recruitment density, species richness, and number of bleached colonies over a 7-year period (2008, 2010, 2012, 2013, 2017, 2019, and 2021). Sampling was carried out along five 10-m long fixed transects, set parallel to the reef slope, at 10-15 m depth. Cover was estimated using video transects that were analyzed with Coral Point Count with Excel Extensions (CPCe) v. 4.1, which generates 10 random points in each image, recording the benthos and type of background where each point is placed. Thus, total abundance and coral abundance were represented by the number of points in the analyzed images. For the recruitment, we used five 25 × 25-cm quadrants for each transect (total: 0.3125 m2 sampled per transect) and counted all bleached colonies along the transects (Pérez-España et al. 2015a).
To understand the state of the coral community of both reefs over time, we applied the coral index (CI), based on NEPA (2013) methods, to each of the 7 years of the database. This method consists of evaluating 4 essential indicators to analyze whether the coral reefs are in good condition: (1) coral cover, (2) species richness, (3) recruitment density, and (4) bleaching prevalence. The index consisted of obtaining the annual average value of the 4 indicators mentioned above for each reef. The percentage of coral cover was calculated using equation (3):
where NCPT is the number of coral points per transect and TNP is the total number of points. Recruitment density was calculated using equation (4):
where ART is the abundance of recruits per transect. The bleaching percentage was calculated using equation (5):
where NBCT is the number of bleached colonies per transect and TCA is the total coral abundance of each reef.
Note that, because the database did not include the total abundance of colonies, we considered this to be the highest number of diseased colonies recorded in the 7 years analyzed on each reef (Blanquilla: 131 colonies; Blanca: 206 colonies).
Subsequently, the annual average of each indicator for each reef was converted into values ranging within the thresholds proposed by NEPA (2013) and Hernández-Delgado et al. (2018), which use a scale of 1 (critical condition) to 5 (very good condition). Finally, the set of scaled indicators was averaged for each year, and a final CI value was obtained. Following the intervals proposed by NEPA (2013), these values were considered very good (4.5-5), good (3.4-4.2), fair (2.6-3.4), poor (1.8-2.6), and critical (1-1.8).
RESULTS
Dynamics of temperature and sedimentation rate in coral bleaching
Using the monthly average of the NSST in the study area, a local MMM value of 29.3 ± 0.3 °C was obtained, with the warmest months being August (29-30 °C) and September (28.7-30.6 °C). In the period from 2008 to 2023, we observed that the weekly degree of warming in the VRS began each year between the months of June and July, with 2018 being the year with the highest accumulated heat (9 DHW). During 2008, 2010, 2012, 2013, 2017, 2019, and 2021, the accumulated heat reached its maximum value in September (4 ± 1 DHW) and decreased at the end of October in all 7 years (Fig. 2). During 2022, daily NSST began to increase from April onwards, exceeding the MMM in August with a value of 30.5 °C; positive anomalies from July onwards resulted in an accumulated heat stress of 5 DHW in September. At the start of sampling in 2022, corals were under 4 weeks of accumulated heat stress (4 DHW), which decreased until the end of November (<2 DHW). In 2023, the increase in temperature began a month earlier (from March onwards); by July there was already an accumulation of 2 DHW (Fig. 3).
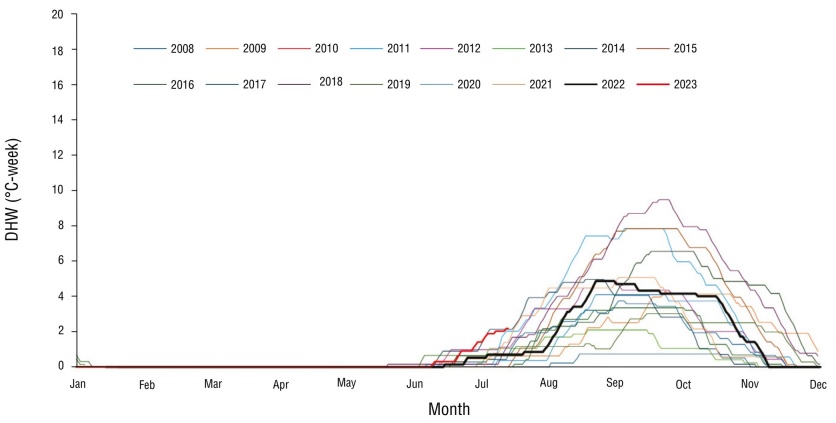
Figure 2 Degree heating week (DHW) values in the Veracruz Reef System (VRS) during the 7 years analyzed within the period from 2008 to 2023.
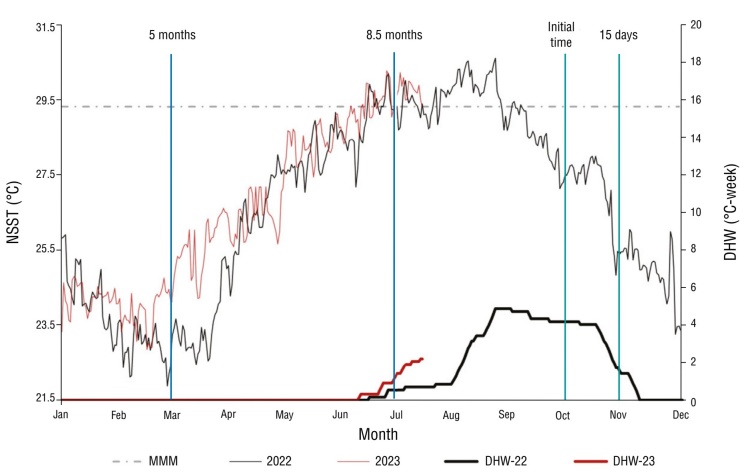
Figura 3 Daily nighttime sea surface temperature (NSST) during 2022 and 2023 in the Veracruz Reef System (VRS). Mean monthly maximum (MMM) of the study area (gray dotted line), temperature (thin lines), represented satellite-based weekly degree of warming (1-km daily) of coral bleaching (D-DHW) (thick lines), and sampling months (vertical lines).
Regarding the sedimentation rate, the studied reefs were within the VRS average (661 cm3·m-2·d-1 ± 191), with values of 657 cm3·m-2·d-1 for Blanquilla and 591 cm3·m-2·d-1 for Blanca. The Kruskal-Wallis test showed that the sedimentation rate did not vary between reefs (P > 0.05) (Fig. 4a), but it did vary between seasons (P < 0.05) (Fig. 4b); the nortes season had the highest sedimentation rates, with averages of 927 and 956 cm3·m-2·d-1 for Blanquilla and Blanca, respectively.
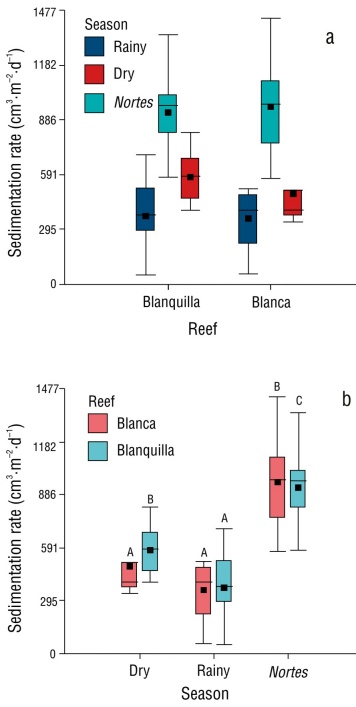
Figure 4 Sedimentation rate. Variation in sedimentation rate from 2012 to 2022 between study reefs and seasons using the Kruskal-Wallis test. Differences between the Blanquilla and Blanca reefs in the rainy season (χ = 0.005, P = 0.9), dry season (χ = 3.02, P = 0.08), and nortes season (χ = 0.00019, P = >0.9) (a). Differences between seasons in the Blanca reef (χ = 15.5, P = 0.0004) and in Blanquilla reef (χ = 19, P = 0.0001) (b).
The Spearman correlation did not show a significant relationship between the number of bleached colonies in the periods 2008-2021 and 2022-2023 and the sedimentation rate in both reefs (P = 0.17, r = 0.31), but it showed a positive correlation (P = 0.03, r = 0.66) with the DHW values.
Short-term analysis: colony recovery
Coral community composition and bleaching prevalence
For Blanca reef, across the 200 m2 sampled, we recorded 348 coral colonies from 17 species, of which the most abundant were S. siderea (25.2%, 88 colonies) and S. stellata (23.2%, 81 colonies). At the start of sampling, 58 colonies from 9 species exhibited bleaching, whereas 8 species were unaffected (Table 1).
Table 1 Prevalence and resistance of bleached colonies by species on the 2 study reefs of the Veracruz Reef System (VRS) during sampling from October 2022 to July 2023. BLE: bleached colonies; RES: resistant colonies; PIB: bleaching prevalence by species at the start of sampling.
| Reef | Blanquilla | Blanca | ||||
| Species | BLE | RES | PIB | BLE | RES | PIB |
| Montastraea cavernosa | 26 | 91 | 22 | 4 | 14 | 22 |
| Colpophillya natans | 11 | 68 | 14 | 2 | 19 | 10 |
| Siderastrea siderea | 6 | 13 | 32 | 20 | 68 | 23 |
| Porites astreoides | 2 | 13 | 13 | 3 | 20 | 13 |
| Orbicella faveolata | 0 | 15 | 0 | 1 | 24 | 4 |
| Pseudodiploria strigosa | 0 | 14 | 0 | 0 | 1 | 0 |
| Siderastrea stellata | 0 | 8 | 0 | 23 | 58 | 28 |
| Stephanocoenia intersepta | 0 | 6 | 0 | 0 | 18 | 0 |
| Helioseris cucullata | 1 | 1 | 50 | 2 | 0 | 100 |
| Mycetophyllia lamarckiana | 0 | 2 | 0 | 0 | 5 | 0 |
| Dichocoenia stokesii | 0 | 1 | 0 | 0 | 0 | |
| Agaricia lamarcki | 0 | 0 | 2 | 17 | 11 | |
| Madracis decactis | 0 | 0 | 0 | 20 | 0 | |
| Agaricia fragilis | 0 | 0 | 1 | 17 | 6 | |
| Agaricia agaricites | 0 | 0 | 0 | 5 | 0 | |
| Siderastrea radians | 0 | 0 | 0 | 1 | 0 | |
| Porites porites | 0 | 0 | 0 | 2 | 0 | |
| Oculina difusa | 0 | 0 | 0 | 1 | 0 | |
| Number of colonies | 46 | 232 | 58 | 290 | ||
| Number of species | 5 | 11 | 9 | 16 | ||
| Bleaching prevalence (%) | 17 | 17 | ||||
On the other hand, for Blanquilla reef, we identified 11 species with 278 colonies, with Montastraea cavernosa (42%) and Colpophillya natans (28.4%) being the most abundant species with 117 and 79 colonies, respectively. Bleaching occurred in 46 colonies from 5 species, whereas 6 species did not experience bleaching. For both reefs, the PIB value was 17%, with the dominant species having the highest number of affected colonies, with prevalences ranging from 14% to 32% (Table 1).
Dynamics of recovery per species
At the start of sampling, the BRI ranged between 3 and 5 on both reefs (Fig. 5a, b). Colpophillya natans was the most affected in Blanquilla reef, with a complete recovery of >80% of its colonies (9 colonies) at 8.5 months and the only one with a mortality rate of 9%, corresponding to one colony. Meanwhile, in Blanca reef, the species most affected by bleaching were M. cavernosa, with a recovery of >80% of its colonies at 5 months, and S. stellata, with a maximum recovery of 60% of colonies (Fig. 6).
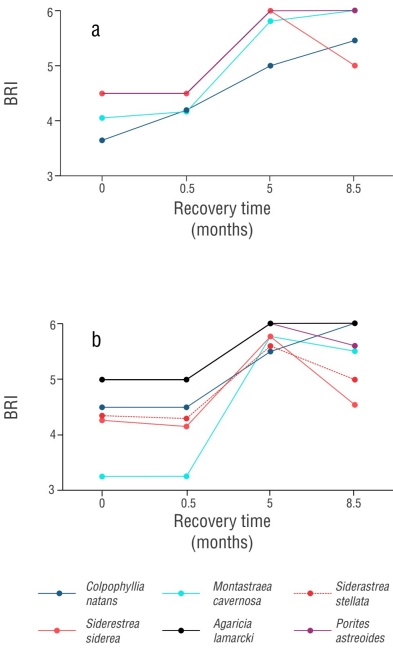
Figure 5 Bleaching response index (BRI) represented by the average score of the bleaching scale. Recovery of susceptible colonies in Blanquilla reef (a) and Blanca reef (b).
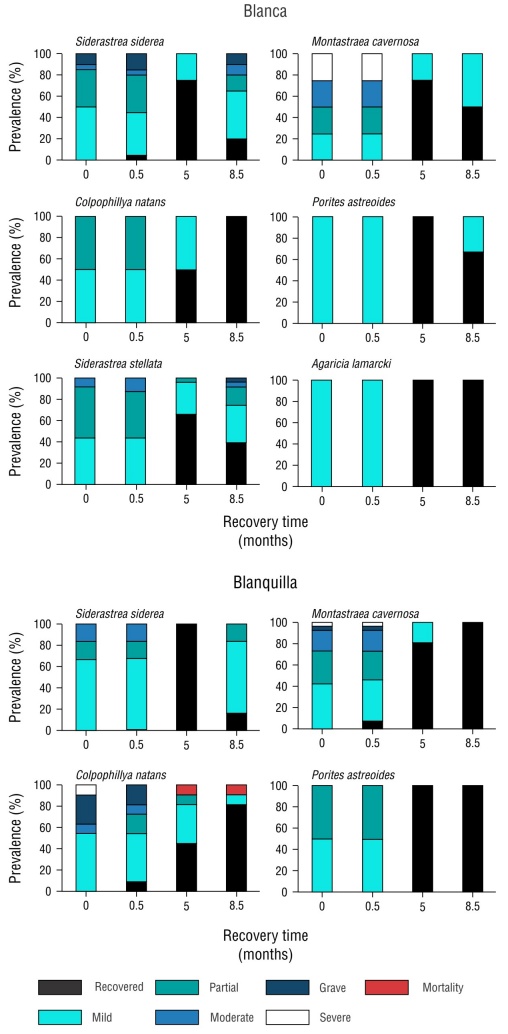
Figure 6 Prevalence per species of bleached colonies in the October 2022 sampling and at 15 days, 5 months, and 8.5 months of recovery.
With the exception of C. natans and S. stellata, all species in both reefs exhibited increasing pigmentation during the study period in >80% of their colonies at 5 months of recovery, with the percentage of bleaching across colonies decreasing to a mild bleaching category (S. siderea: 10% and 20% bleaching; M. cavernosa: <10% bleaching) and a recovered category (all P. astreoides and A. lamarcki colonies with no bleached tissue), with species having BRI values of 5 and 6. By 8.5 months, corresponding to July 2022, the percentage of bleaching increased in most colonies; species of the genus Siderastrea were the most affected (Figs. 5, 6).
The RDA showed a positive correlation (P = 0.001) between the presence of P. astreoides and A. lamarcki species and the BRI at 5 and 8.5 months. In contrast, the presence of Siderastrea species was the only variable that showed a positive relationship with bleaching. In general, the presence of the species S. stellata, S. siderea, M. cavernosa, or C. natans did not show a positive correlation with the BRI, and of these, only the presence of C. natans was related to the previous death variable (Fig. 7).
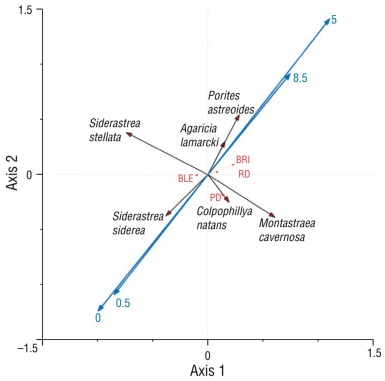
Figure 7 Partial redundancy analysis (RDA) of environmental parameters and species with months of recovery (first axis: F = 17.862, P = 0.0010; second axis: F = 3.021, P = 0.0010; 60% of the total variance explained for the first 2 canonical axes). Red arrows indicate environmental parameters. Black arrows indicate species. Blue arrows indicate recovery months. BRI: bleaching response index; BLE: bleaching percentage; PD: previous death; RD: recent death.
Medium-term analysis: coral index (CI)
The average of each indicator over the 7 years analyzed showed that Blanquilla reef had better coral cover, whereas Blanca reef had higher recruitment density values. The bleaching percentage and species richness indicators were the same throughout the years analyzed (Table 2).
Table 2 Values for the coral index (CI) indicators for the study reefs converted to the threshold range according to NEPA (2013). CC: coral cover; RD: recruitment density; BLE (%): bleaching percentage; S: species richness; ACI: annual coral index.
| Reef | Blanquilla | Blanca | ||||||||
| Year | CC | RD | BLE | S | ACI | CC | RD | BLE | S | ACI |
| 2008 | 5 | 1 | 3 | 5 | 3.50 | 3 | 4 | 3 | 4 | 3.50 |
| 2010 | 5 | 3 | 1 | 4 | 3.25 | 4 | 5 | 2 | 4 | 3.75 |
| 2012 | 5 | 4 | 2 | 5 | 4.00 | 3 | 5 | 2 | 5 | 3.75 |
| 2013 | 5 | 3 | 2 | 5 | 3.75 | 4 | 5 | 2 | 5 | 4.00 |
| 2017 | 4 | 1 | 5 | 4 | 3.50 | 2 | 5 | 2 | 4 | 3.25 |
| 2019 | 4 | 4 | 3 | 4 | 3.75 | 3 | 5 | 3 | 5 | 4.00 |
| 2021 | 4 | 4 | 3 | 4 | 3.75 | 3 | 5 | 3 | 5 | 4.00 |
| Indicator | ||||||||||
| ACI | 4.6 | 2.9 | 2.7 | 4.4 | 3.1 | 4.9 | 2.4 | 4.6 | ||
| Total CI | 3.6 | 3.8 | ||||||||
Indicator category: very good, good, fair, poor, critical.
The CI varied between reefs, fluctuating between 3 and 4. The lowest CI value (3.25) for the Blanquilla and Blanca reefs, corresponding to the fair category, was observed during 2010 and 2017, respectively (Fig. 8). Low values were not directly related to the years with the highest bleaching rate. Overall, the health of the coral community in both reefs during the 7 years analyzed was categorized as good (CI = 3.6 and 3.8) (Table 2).
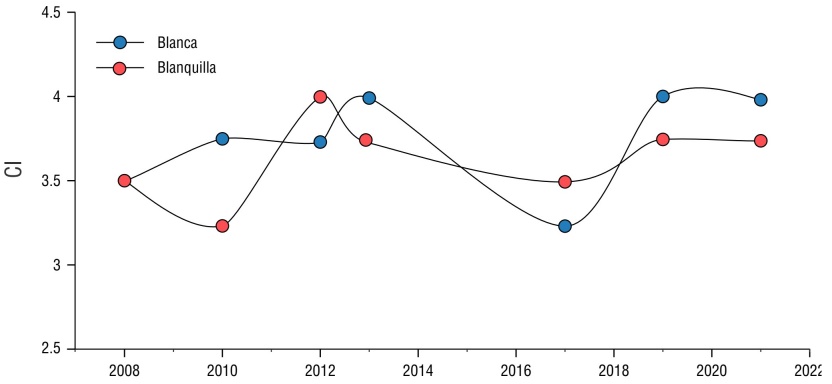
Figure 8 Coral index (CI) for each of the reefs analyzed in the period from 2008 to 2021: Blanca reef (blue circles) and Blanquilla reef (orange circles). This article pertains to a special issue of Ciencias Marinas comprising select papers from the 2024 "XII Congreso Mexicano de Arrecifes Coralinos and III Congreso Panamericano de Arrecifes Coralinos" held in Ensenada, Baja California, Mexico.
DISCUSSION
Dynamics of temperature and sedimentation in coral bleaching
During the 2008-2022 period, accumulated heat (DHW) values in the VRS marked a window of thermal stress that began in June (~0.5 DHW) and ended in December (<2 DHW). September was consistently observed to be the month with the highest heat accumulation (2-9 DHW). According to the accumulated heat parameters proposed by NOAA (2024), during the 2008-2022 period, VRS corals in general were exposed to a thermal stress equivalent to a level 1 bleaching alert, which indicated a low probability of bleaching across the entire reef.
Studies conducted in the Mexican Caribbean, a region neighboring our study area in the Gulf of Mexico, have documented that corals are highly susceptible to bleaching, with a percentage of bleached colonies of 20-45% (Randazzo-Eisemann and Garza-Pérez 2021, Sellares-Blasco et al. 2022, Muñoz-Castillo et al. 2024). In this context, the bleaching prevalence recorded in this study at the beginning of the 2022 sampling in both reefs (17%) reflected a relatively low value, which was mainly determined by the accumulated weekly heat degrees to which they were exposed (5 DHW). Specifically, for the 2022 to 2023 sampling, low DHW values explained the bleaching prevalence of 17% in both reefs. Furthermore, the first samplings (October and November 2022) corresponded to the nortes season, when mixing in the water column helps lower temperatures (Salas-Monreal et al. 2022) and decrease thermal stress. Therefore, the bleaching prevalence observed at the start of sampling was already the highest ever reached in the area.
In the VRS, the influence of sediments from adjacent rivers varies with the climatic season (Krutak 1997). During the rainy season, the contribution of the Papaloapan River, with 1,331.4 m3·s-1, and the Jamapa River, with 68.2 m3·s-1 (CNA 2021), directly affects the reefs located in front of the town of Antón Lizardo, particularly Blanca reef, with sediment deposition on the corals; during the nortes season, the contribution of these rivers does not reach the reefs (Salas-Monreal et al. 2022). Despite this, in this study, a higher sedimentation rate was recorded during the nortes season, which could be the result of sediment traps capturing suspended particles due to mixing in the water column during this season.
On the other hand, reefs are also exposed to wastewater discharges. Blanquilla reef is exposed to input from 54 wastewater discharges located along the port of Veracruz, and Blanca reef is influenced by 19 wastewater discharges reported for the southern zone (Mapel-Hernández et al. 2021). This could suggest that the sedimentation rate on these reefs is influenced by both sediment input from adjacent rivers and wastewater discharges from the area, since the recorded sedimentation rate did not vary between reefs. Furthermore, although these reefs were initially selected in the hope of finding differences in sedimentation rates and species susceptibility, it ultimately became clear that in both reefs the coral colonies were under the same degree of stress from sediment accumulation.
Rising temperatures are known to be the main stress factor for coral colonies (Eakin et al. 2009), a condition that was reaffirmed in this study by the positive correlation between the number of bleached colonies and accumulated heat stress. In the VRS, corals were exposed not only to rising temperatures but also to constant sediment stress; nonetheless, in this study, sedimentation rates did not directly influence bleaching. This demonstrates a certain tolerance of the colonies to the high sedimentation rates reported for the studied reefs. Despite this, the possibility that sediments play a secondary stressor role that increases the sensitivity of the colonies should not be ruled out; during the nortes season, the resuspension of sediments caused by mixing in the water column, which reached an average depth of 25 m (Salas-Monreal et al. 2022), could stress corals due to the friction of particles on the tissue and cause nutritional depletion, as mentioned by Salih et al. (2000) and López-Lodoño et al. (2023).
Short-term analysis: colony recovery
During the 2022-2023 sampling, we observed that the scleractinian coral species most susceptible to bleaching in both reefs (S. siderea, S. stellata, M. cavernosa, and C. natans) were the species that most contributed to the construction of the VRS reefs (Horta-Puga and Tello-Musi 2009), which Alemu and Clement (2014) and Pérez-España et al. (2015a) reported to be among the most affected by bleaching in the Caribbean and in the VRS, respectively.
However, in this work, most species (except C. natans and S. stellata) showed a recovery in a similar time to that obtained by Matsuda et al. (2020), who reported that recoveries occurred 1 to 4 months prior to the next bleaching event, and to that obtained by Hughes and Grottoli (2013), who reported that at 4 months the colonies had concentrations of photosynthetic pigments and photoautotrophic carbon assimilation at normal levels, appearing visually healthy. Therefore, the visual decrease in bleached tissue within the first 5 months after the bleaching event in the coral colonies analyzed in this work could indicate that there was also a physiological recovery during that time.
Field studies have shown that, with elevated temperatures, reefs characterized by turbid waters are less prone to coral bleaching than reefs with clear waters (Morgan et al. 2017). The abundant particulate organic matter in turbid reefs, together with thermal bleaching, can cause some coral species to become permanently or facultatively heterotrophic (Anthony and Fabricius 2000). Hughes and Grottoli (2013) reported this same event and indicated that corals that had experienced bleaching had higher amounts of heterotrophic carbon assimilated during their recovery process than non-bleached corals. The VRS reef system has input from rivers that carry organic matter (Carreón-Palau 2019); therefore, the high recovery rate observed in the species analyzed in this study could be due, in part, to the access to nutrients and energy through heterotrophy during the bleaching event, which would allow the colonies to resist and recover more quickly, as mentioned by Hughes and Grottoli (2013) and Tremblay et al. (2016). However, confirmation of this event in the colonies requires specific analysis.
The analysis of the species-specific response to bleaching indicated that C. natans took the longest to show visually healthy tissue, in addition to being the only colony to experience mortality. This suggests a greater sensitivity of the species to thermal stress, which is consistent with the reports of González-Gándara (2008) and Pérez-España et al. (2015a), who reported that this species is among those most affected by bleaching. On the other hand, considering that there was an El Niño event in 2023, in which temperatures were above the historical record and triggered a bleaching event that affected the Pacific, Caribbean, and Gulf of Mexico (Goreau and Hayes 2024, López-Pérez et al. 2024), the sensitivity of the colonies of the genus Siderastrea increased during the last sampling (July 2023) due to the thermal stress to which they were exposed, since by that date there was a heat accumulation of 2 °C in the VRS (Fig. 3).
Montastraea cavernosa has been shown to be able to survive in environments with constant sediment stress, with sedimentation rates as high as 400 g·m-2·d-1, without showing severe bleaching or mortality (Vargas-Ángel et al. 2007). In the Blanca and Blanquilla reefs in the VRS, this species was exposed to sedimentation rates of up to 1,434 g·m-2·d-1 and of 600 g·m-2·d-1 on average. Therefore, although M. cavernosa was one of the most affected by bleaching, its recovery within the first 5 months demonstrated its resilience in highly sedimented environments; studies have been shown that it has the ability to stop its growth rate to direct energy resources to reject sediments (Horta-Puga and Carriquiry 2008). The same mechanism for rejecting sediments could occur in Siderastrea colonies, as these also showed one of the highest percentages of bleaching in their colonies and the same recovery time.
On the other hand, P. astreoides was one of the species that showed complete tissue color recovery in all its colonies 5 months after the bleaching event. According to what was reported by Levas et al. (2018), this species has the capacity to recover after a month and a half; therefore, it is possible that, in the present study, P. astreoides colonies reached their maximum recovery even before the 5 months sampled. Furthermore, within the analyzed species, P. astreoides was one of the least affected by bleaching, despite being in an environment with various stressors for corals. This result is consistent with what was reported by Green et al. (2008), who pointed out that P. astreoides has the potential to grow in habitats that are not optimal for most corals. Likewise, P. astreoides has shown high recovery rates because its symbionts are from the genus Cladocopium (clade C), which are characterized by high photorepair rates and a wide tolerance to variations in temperature and irradiance, compared to the symbionts of species more sensitive to bleaching (Hennige et al. 2011).
Coral mortality and recovery have been associated with bleaching severity (López-Patoni 2014, NOAA 2023). Since this study only assessed the 2022 bleaching event, with the last sampling (July 2023) occurring just before the onset of the fourth bleaching event, colony recovery corresponds to low thermal stress, as mentioned above. Therefore, the impact bleaching would have on the recovery of scleractinian coral species in the event of a severe bleaching event is unknown.
Medium-term analysis: coral index (CI)
The corals of the studied reefs had high CI values during the 7 years analyzed. Although the Blanca and Blanquilla reefs are located close to the coast (2 km), the CI values were greater than 3, which contrasts with what was reported by Hernández-Delgado et al. (2018), who documented CI values lower than 2 in reefs located less than 4 km off the coast. According to what was reported by Meesters and Bak (1993), coral reefs in disturbed environments show higher rates of regeneration and pigment recovery after a period of bleaching, which is summarized as high resilience. Therefore, the good category found in both reefs could be the result of an acclimatization process in which the colonies have had phenotypic changes under the environmental and anthropogenic stress in the VRS, which has led to the readjustment of the tolerance levels of the coral colonies (Coles and Brown 2003).
Furthermore, in the deep part (>10 m), each reef shows different characteristics. Blanquilla is known to have the greatest coral cover, whereas Blanca is among those with the highest recruitment densities (Pérez-España et al. 2015a). This is consistent with our results; Blanquilla showed an average cover of 41% but a recruitment density of 5%, whereas Blanca showed a cover of 17% with a recruitment density of 16%.
The CI indicators considered in this study are essential for the coral community to be in a healthy state and recover from thermal stress (Maynard et al. 2017). In this sense, the recruitment density and coral cover indicators that characterized the study reefs have greater weight in the CI values and determine the condition of the coral community over time. However, it is important to consider that not all recruits contribute equally to the functioning of the ecosystem. Some opportunistic species can have high levels of recruitment, but limited contribution to the three-dimensional structure of the reef and, therefore, to the ecosystem services it provides (Cetz-Navarro et al. 2016). Thus, future analyses should specify recruitment composition to assess the recovery potential of the reef more accurately.
Considering colony recovery time, along with other key indicators for studying coral communities (coral cover, recruitment density, and species richness), will help us understand the response of reefs and each species over time. Horta-Puga and Tello-Musi (2009) mentioned that the VRS was dominated by species with broad tolerance limits, which we confirmed with the results of the recovery time of the dominant species. According to Lam et al. (2020), both the indicators used for the CI and the recovery of the colonies could denote that sites with a desirable set of metrics indicate greater resilience. However, due to the increasing thermal stress faced by the colonies and the anthropogenic stressors that harm their health, it is necessary to continue monitoring the colonies in situ to understand the recovery time following bleaching events, especially the 2023 event, and to identify if there are changes in the recovery of the species.
Furthermore, it is important to highlight that in this study, we assessed colony recovery using tissue coloration. Therefore, to better understand the bleaching process in each species, we suggest that future studies address recovery from a physiological perspective and consider other environmental variables that could influence their health status.
CONCLUSIONS
Under a cumulative heat stress of 5 DHW and a sedimentation rate of approximately 600 cm3·m-2·d-1, M. cavernosa, S. siderea, P. astreoides, and A. lamarcki recovered tissue color, reaching mild bleaching in >80% of their colonies within the first 5 months after the bleaching event, regardless of the percentage of bleached tissue in the colonies, whereas C. natans was among the most sensitive species to heat stress and took the longest to recover (8.5 months). On the other hand, O. faveolata, M. decactis, A. fragilis, and S. intercepta were not affected by the level 1mild bleaching heat stress. The sedimentation rate to which the study reefs were exposed did not vary between reefs and did not directly influence coral colony bleaching. Rather, the main cause of bleaching was thermal stress, and recovery time depended on the decrease in accumulated heat levels. Finally, the lack of differences in the CI and BRI between reefs was influenced by the similar conditions to which the scleractinian corals of both reefs were exposed to, the recovery time of the dominant species at each reef, and the cover and recruitment density attributes that characterized them.

