


 nueva página del texto (beta)
 Inglés (pdf)
 Artículo en XML
 Referencias del artículo
 Enviar artículo por email
 Citado por SciELO
  Similares en
SciELO
Similares en
SciELO 
 Permalink
1 Introduction
Super Wide Angle Search for Planets (SuperWASP), an international team of many academic institutions conducting an ultra-wide angle search for exoplanets using transit photometry, discovered that V840 Lyr (1SWASP J183738.17+402427.2 = 2MASS J18373818+4024271) is an eclipsing binary star with a short period [Norton et al.(2011). In the General Catalogue of Variable Stars (GCVS) database, V840 Lyr was identified by Samus et al.(2017) to be an eclipsing W UMa (EW) type binary. The system’s ephemeris ( H eliocentric J ulian D ay-HJD) was provided by (GCVS) database Samus et al.(2017):
New high-quality photometric observations were made in order to study this binary. The multicolor light curves of the system demonstrated an O’Connell effect in the V, R c , and I c filters (see Figure 4). If the magnitude of the maximum-I is lower than that of the maximum-II, this is accepted as a positive O’Connell effect O'Connell(1951).
The presence of a dark cool spot on the secondary star provided an explanation for the asymmetric light curves. Their photometric investigation revealed that the V840 Lyr is a W-type over-contact binary with a small mass ratio. The binary star’s derived fill-out factor of 15.14 percent indicated that it is getting close to the end of its evolution. These characteristics suggest that V840 Lyr is a promising target for additional research, which is made in part in this work. When the binary system satisfies the well-known requirement that the orbital angular momentum is less than three times the total rotation angular momentum of the components (
In this paper we study V840 Lyr further by analyzing light curves using a standard software package, and provide different estimates of the physical parameters for this binary star. Table 1 contains details on V840 Lyr, comparisons, and check stars. A typical binary of the EW type is V840 Lyr. The parallax for this eclipsing binary was stated as
Table 1: The target stars’ coordinates
| Target | Stars | R.A.(2000) | DEC.(2000) | V | Ref |
|---|---|---|---|---|---|
| h:m:s | ° ‘ ´´ | mag | |||
| C1 | V840 Lyr | 18:37:38.18 | 40:24:27.09 | 14.45 | (1) |
| C2 | Comparison | 18:37:27.01 | 40:24:56.88 | 12.63 | (2) |
| C3 | Comparison | 18:37:25.32 | 40:26:03.59 | 13.19 | (2) |
| C4 | Comparison | 18:37:34.49 | 40:24:44.78 | 14.89 | (2) |
| C5 | Comparison | 18:37:47.46 | 40:25:29.24 | 14.47 | (2) |
| C6 | Check | 18:37:55.51 | 40:25:35.25 | 14.36 | (2) |
Ref: (1) SuperWASP Norton et al.(2011); (2) CCD photometry.
2 PHOTOMETRIC OBSERVATIONS
V, R c and I c observations were carried out with the Mexman filter wheel mounted on the 84 cm reflecting telescope at San Pedro Martir (SPM) Observatory during the nights of 2018 July 06 (2.6h), 2019 June 06 (0.9h), 2019 June 07 (3.2h) and 2021 September 27 (2.5h) using exposure times of 60s in V and 40s both in R c and I c . Additional observations where carried out in 2022 June 14 (2.3h) and 2022 June 17 (6.9h) with exposure times of 20s in V and 15s in both R c and I c . During the 2018 run the Spectral Instruments CCD camera was employed while the Marconi 5 camera was used during the other runs. Table 1 contains the coordinates of the variable (V840 Lyr), the comparisons and the check stars in the CCD camera’s field of vision. The PHOT aperture photometry routine of IRAF was used for the reduction of the observed CCD field images.
The epoch specified in the GCVS, however, is H eliocentric J ulian D ay-HJD Samus et al.(2017), needs to be transformed to B arycentric J ulian D ay-BJD to be compatible with TESS data. The following equation specifies the epoch as BJD:
To make this transformation, we used the code in the Eastman et al.(2010) study. Equation 2 specifies the epoch as BJD. In equation 2 period and epoch are taken from the GCVS catalog.
Table 2 lists the results of using the Gauss fitting method along with Monte Carlo Markov Chain (MCMC) to the following datasets: 14 CCD times of light minima from SPM observations, 18 from SWASP (Super Wide Angle Search for Planets Pollacco et al.(2006), 3 from CRTS (Catalina Real-time Transient Survey, Drake et al. 2009), 9 from ZTF (The Zwicky Transient Facility Bellm et al.(2019), and 10 from TESS (the Transiting Exoplanet Survey Satellite Sullivan et al.(2015).
TABLE 2 New CCD minimum times for V840 Lyr, from SPM and other surveys
| Observed | Instrument | Min | Ref. | Observed | Instrument | Min | Ref. |
|---|---|---|---|---|---|---|---|
| BJDmin(2.4M+) | (filter) | I/II | BJDmin(2.4M+) | (filter) | I/II | ||
| 53143.68187 | CCD | Min.II | (1) | 58305.76370 | Ic | Min.II | (4) |
| 53144.67801 | CCD | Min.I | (1) | 58305.87452 | Rc | Min.I | (4) |
| 53201.55432 | CCD | Min.I | (1) | 58305.87460 | Ic | Min.I | (4) |
| 53204.54147 | CCD | Min.II | (1) | 58305.87476 | V | Min.I | (4) |
| 53231.54280 | CCD | Min.II | (1) | 58305.98481 | V | Min.II | (4) |
| 53232.53755 | CCD | Min.I | (1) | 58305.98539 | Rc | Min.II | (4) |
| 53526.87864 | CCD | Min.I | (2) | 58427.59401 | CCD | Min.I | (3) |
| 53669.62683 | CCD | Min.I | (2) | 58588.93059 | CCD | Min.I | (3) |
| 54275.57350 | CCD | Min.I | (1) | 58640.93952 | Ic | Min.I | (4) |
| 54276.56826 | CCD | Min.II | (1) | 58640.93956 | Rc | Min.I | (4) |
| 54297.59319 | CCD | Min.II | (1) | 58640.93980 | V | Min.I | (4) |
| 54298.58886 | CCD | Min.I | (1) | 58641.93571 | Ic | Min.II | (4) |
| 54327.47016 | CCD | Min.II | (1) | 58641.93576 | V | Min.II | (4) |
| 54328.46606 | CCD | Min.I | (1) | 58641.93584 | Rc | Min.II | (4) |
| 54628.56379 | CCD | Min.I | (1) | 58700.80260 | CCD | Min.II | (3) |
| 54628.67418 | CCD | Min.II | (1) | 59012.18724 | CCD | Min.II | (5) |
| 54644.49783 | CCD | Min.I | (1) | 59012.51913 | CCD | Min.I | (5) |
| 54645.49342 | CCD | Min.II | (1) | 59019.82226 | CCD | Min.I | (5) |
| 54683.44789 | CCD | Min.I | (1) | 59019.93293 | CCD | Min.II | (5) |
| 54684.44347 | CCD | Min.II | (1) | 59023.36325 | CCD | Min.I | (5) |
| 56592.59073 | CCD | Min.II | (2) | 59023.47392 | CCD | Min.II | (5) |
| 58204.95510 | CCD | Min.I | (3) | 59024.35929 | CCD | Min.II | (5) |
| 58205.95317 | CCD | Min.II | (3) | 59024.46998 | CCD | Min.I | (5) |
| 58210.93182 | CCD | Min.I | (3) | 59034.53962 | CCD | Min.II | (5) |
| 58235.93964 | CCD | Min.I | (3) | 59034.87159 | CCD | Min.I | (5) |
| 58237.93292 | CCD | Min.I | (3) | 59484.68517 | Ic | Min.II | (4) |
| 58290.93488 | CCD | Min.II | (3) | 59484.68518 | Rc | Min.II | (4) |
| 58305.76346 | V | Min.II | (4) | 59484.68519 | V | Min.II | (4) |
| 58305.76355 | Rc | Min.II | (4) |
Equation 2 is used to calculate the minima, with Min.I denoting the primary minimum and Min.II denoting the secondary minimum. Ref: (1) SWASP, (2) CRTS, (3) ZTF, (4) SPM-This study, (5) TESS-internet-This study.
3 INVESTIGATION OF THE O-C CHANGE
Since the variable’s discovery, no period change studies have been undertaken. We gather all available photoelectric and CCD times of minimum light from the other works, websites, and other surveys (SWASP, CRTS, ZTF, TESS) to examine the variations in the orbital period. Table 2 contains a list of minimum times of all primary and secondary eclipses. The seventh column of Table 2 contains a list of the (O-C) values ( O bserved times of light minima minus C omputed times of light minima), which are plotted in the top panel of Figure 1 and are calculated by equation 2. In this figure, black-filled and empty circles signify data from the SPM Observatory, black-filled and empty diamonds indicate data obtained from TESS light curves, black-filled and empty squares refer to data from SWASP, black-filled and empty triangles indicate data obtained from ZTF, and the black plus and the black cross refer to data from CRTS.
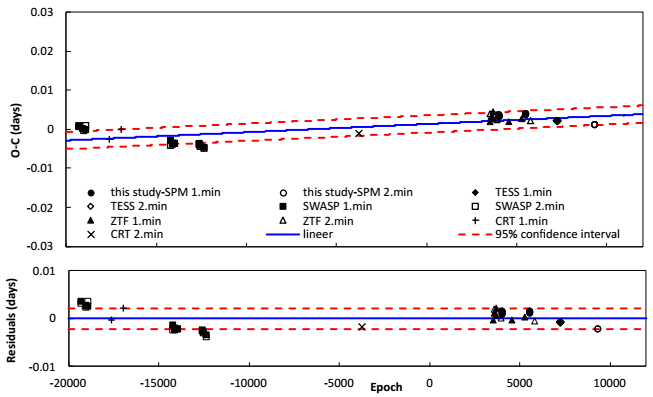
Fig. 1 According to all primary and secondary minimum times, the (O-C) diagram of the short period V840 Lyr binary. The blue solid line depicts a linear fit. In the lower panel, residuals pertaining to the linear ephemerides are shown. The red dashed lines represent a 95% confidence interval. The color figure can be viewed online.
The following ephemeris is provided by the (O-C) values’ least-squares solution:
This ephemeris’ linear term allows to calculate the new period and new initial minimum time. These minimum times of the binary system were used to calculate the revised orbital period, as provided by equation 4:
Using equation 4, we found the revised period to be 0d.22131121 for V840 Lyr.
The bottom panel of Figure 2 displays the residuals from equation 3, and Column 8 of Table 2 lists them.
4 THE SOLUTION OF THE PHOTOMETRIC LIGHT CURVE
In this work, the V, R
c
and I
c
light curves described above are used. The W-D code-based & Phoebe0.31a interface program was used to analyze the light curves of V840 Lyr in order to understand its geometrical structure and evolutionary state Wilson & Devinney(1971), Wilson(1979), van Hamme & Wilson(2003), Wilson et al.(2010), van Hamme(1993). The O’Connell effect can be seen in the binary system’s light curves, and it can be explained by dark-cool spot activity on the secondary component Qian et al.(2017). The O’Connell effect can be modeled by placing a spot on any of the system components. At the same time, the study of Kallrath & Milone(1999) explains how to determine the hotter and cooler spot. As specified by Kallrath & Milone(1999), ‘colour amplitudes increase when going to
where
where
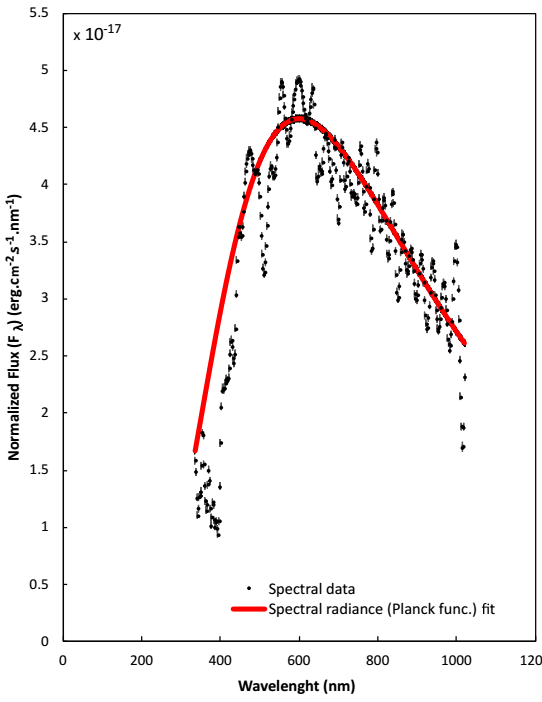
Fig. 2 The Gaia energy distribution spectrum of the V840 Lyr binary star system. The black dots along with the errors show the spectral data of the system. The red solid line depicts a black-body (Planck function) fit. The color figure can be viewed online.
TABLE 3 Effective temperature and spectral classifications for V840 Lyr according to several catalogues
| Catalogue / Survey | (J-H)0 | ±σ |
|
BCb | Spt.Typec |
|---|---|---|---|---|---|
| MASS Cutri et al.(2003) | 0.537 | 0.115 | 4535* | -0.61* | K4.5* |
| TESS Input Catalog Paegert et al.(2021) | 0.455 | 0.122 | 4910* | -0.37* | K2.6* |
| APASS DR9 Henden et al.(2015) | 0.505 | 0.085 | 4718* | -0.49* | K3.6* |
| Worthey Lee(2011) | 0.540 | 0.101 | 4758 | -0.41 | K3.4* |
| Gaia DR2 (Gaia Collaboration et al. 2018) | 0.485 | 0.075 | 4801 | -0.43* | K3.2* |
| Drilling Landolt(2000) | 0.537 | 0.135 | 4718 | -0.50 | K3.3 |
The depths of both minima in the light curves are approximately equal, indicating that both components are roughly at the same temperature. The gravity-darkening coefficients and bolometric albedo are therefore set to the same values for both components, g
1 = g
2 = 0.32 Lucy(1967) and A
1 = A
2 = 0.5 Ruciński (1969). According to Claret & Gimenez(1990), the bolometric and bandpass limb-darkening coefficients (x and y) were applied to model the light curves. The parameters include the star 1 and star 2’s dimensionless potential (
The mass ratio of the system was determined using the q-search technique (q = M
2
/M
1
). For a variety of mass ratio values, solutions were obtained. We discovered that the answers typically converged to mode 3 for each value of q. The calculation began in mode 2 (detached mode) for each value of q. Figure 3 shows the relationship between q and the sum of the results of the weighted squared deviations,
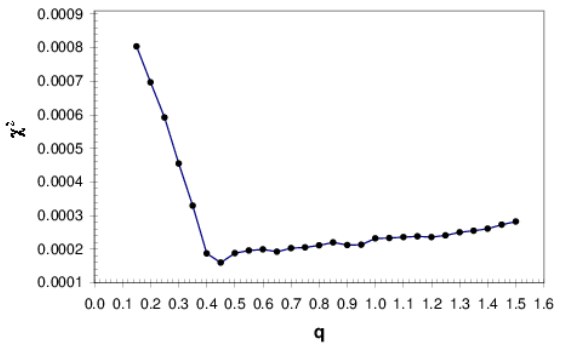
Fig. 3 The relation between
TABLE 4 V840 Lyr’s solution parameters with dark, cooler spot
| No third light | Third light | ||||
|---|---|---|---|---|---|
| Description | Parameters | Values | ±σ | Values | ±σ |
| The initial point of the ephemeris | T0 (HJD) | 2457422.6180 | fixed | 2457422.618 | fixed |
| Orbital period | P (days) | 0.221311 | fixed | 0.221311 | fixed |
| Semi major axis |
SMA |
1.57903 | fixed | 1.57903 | fixed |
| Mass ratio | q | 0.4509 | 0.0705 | 0.4543 | 0.0710 |
| Orbital inclination | i | 80.44 | 0.09 | 80.49 | 0.07 |
| Fill-out parameter | f | 0.1514 | 0.0568 | 0.2323 | 0.0871 |
| The ratio of frac. radii | k = r 2/r 1 | 0.6919 | 0.6986 | ||
| Temperature ratio | T 2/T 1 | 0.9907 | 0.9913 | ||
| Temperature of primary comp. | T 1 (K) | 4820 | fixed | 4820 | fixed |
| Temperature of secondary comp. | T 2 (K) | 4775 | 110 | 4778 | 112 |
| Surface potential of components | Ω1 = Ω2 | 2.7389 | 0.0052 | 2.7234 | 0.0044 |
| Bol. albedo of components | A 1 = A 2 | 0.50 | 0.50 | ||
| Gravity darkening exponents | g 1= g 2 | 0.32 | 0.32 | ||
| Bolometric limb darkening | (V) | 0.800, 0.066 | 0.800, 0.066 | ||
| Logarithmic coefficients of | (R c ) | 0.721, 0.146 | 0.721, 0.146 | ||
| pri. component (x 1, y 1) | (I c ) | 0.625, 0.175 | 0.625, 0.175 | ||
| Bolometric limb darkening | (V) | 0.800, 0.066 | 0.800, 0.066 | ||
| Logarithmic coefficients of | (R c ) | 0.721, 0.146 | 0.721, 0.146 | ||
| sec. component (x 2, y 2) | (I c ) | 0.625, 0.175 | 0.625, 0.175 | ||
| The fractional luminosities | (V) | 0.6816 | 0.0251 | 0.6778 | 0.0820 |
| of primary component | (R c ) | 0.6802 | 0.0260 | 0.6736 | 0.0891 |
| L1/(L1 + L2) | (Ic) | 0.6794 | 0.0272 | 0.6656 | 0.0942 |
| The fractional luminosities | (V) | 0.3184 | 0.0252 | 0.3222 | 0.0822 |
| of secondary component | (R c) | 0.3198 | 0.0263 | 0.3264 | 0.0890 |
| L2/(L1 + L2) | (Ic) | 0.3205 | 0.0271 | 0.3344 | 0.0941 |
| Third light | l3 (V) | 0 | 0.0020 | 0.0007 | |
| l3 (Rc) | 0 | 0.0011 | 0.0008 | ||
| l3 (Ic) | 0 | 0.0033 | 0.0009 | ||
| The frac. radii of | r1 (pole) | 0.4351 | 0.0012 | 0.4302 | 0.0010 |
| primary component | r1 (side) | 0.4658 | 0.0014 | 0.4595 | 0.0011 |
| r1 (back) | 0.4969 | 0.0039 | 0.4899 | 0.0033 | |
| The frac. radii of | r2 (pole) | 0.2994 | 0.0014 | 0.2993 | 0.0011 |
| secondary component | r2 (side) | 0.3138 | 0.0017 | 0.3133 | 0.0013 |
| r2 (back) | 0.3539 | 0.0031 | 0.3513 | 0.0023 | |
| The mean frac. radii of pri. comp. | r1,mean | 0.4659 | 0.0018 | 0.4598 | 0.0015 |
| The mean frac. radii of sec. comp. | R2,mean | 0.3224 | 0.0020 | 0.3213 | 0.0016 |
| Spot parameters of the secondary component | |||||
| (lr)1-4 (lr)5-6Spot co-latitude | Θ[°] | 100.00 | 3.82 | 100.00 | 3.82 |
| Spot longitude | ϕ[°] | 80.00 | 1.93 | 80.00 | 1.93 |
| Angular radius | r S [°] | 20.00 | 1.75 | 20.00 | 1.75 |
| Temperature factor | fraction | 0.7376 | 0.7376 | ||
Note: The errors (
TABLE 5 The absolute parameters of V840 Lyr
| Description | Parameters | This Study | Gaia-DR3a | Tessb |
|---|---|---|---|---|
| values ± σ | values ± σ | values ± σ | ||
| The first Lagrangian point’s equipotential |
|
2.773046 | ||
| The second Lagrangian point’s equipotential |
|
2.502974 | ||
| The primary comp.’s mass |
|
0.744 ± 0.097 | 0.754 ± 0.043 | 0.760 |
| The secondary comp.’s mass |
|
0.336 ± 0.052 | 0.341 ± 0.019 | 0.343 |
| The primary comp.’s radius |
|
0.735 ± 0.039 | 0.757 ± 0.018 | 0.774 |
| The secondary comp.’s radius |
|
0.508 ± 0.029 | 0.523 ± 0.013 | 0.535 |
| The primary comp.’s temperature | T 1(K) | 4820 | 4829 ± 33 | 4726 ± 155 |
| The secondary comp.’s temperature | T 2(K) | 4775 ± 110 | 4784 ± 33 | 4682 ± 155 |
| The primary comp.’s bol. absolute magnitude |
|
6.26 ± 0.12 | ||
| The secondary comp.’s bol. absolute magnitude |
|
7.05 ± 0.13 | ||
| The primary comp.’s logarithmic surface gravity | log(g1)(cgs) | 4.58 ± 0.10 | 4.56 ± 0.02 | 4.54 |
| The secondary comp.’s logarithmic surface gravity | log(g2)(cgs) | 4.55 ± 0.11 | 4.53 ± 0.02 | 4.51 |
| The primary comp.’s luminosity |
|
0.257 ± 0.052 | 0.257 ± 0.007 | 0.269 |
| The secondary comp.’s luminosity |
|
0.119 ± 0.025 | 0.119 ± 0.003 | 0.125 |
| The primary comp.’s density |
|
2.80 ± 0.14 | 2.45 ± 0.01 | 2.31 |
| The secondary comp.’s density |
|
3.67 ± 0.20 | 3.35 ± 0.01 | 3.03 |
| Distance of the system | d(pc) | 443.6 ± 28.2 | 448.5 ± 5.3 | 444.0 ± 4.2 |
| Total mass |
|
1.080 ± 0.149 | 1.094 ± 0.062 | 1.103 |
| The system’s mass function |
|
1.036 ± 0.151 | 1.049 ± 0.068 | 1.057 |
a; Ref; Gaia Collaboration(2022), b; Ref; Stassun et al.(2019).
Final solutions were derived after applying differential corrections until they converged. For no third light and third light, our solution respectively converged at
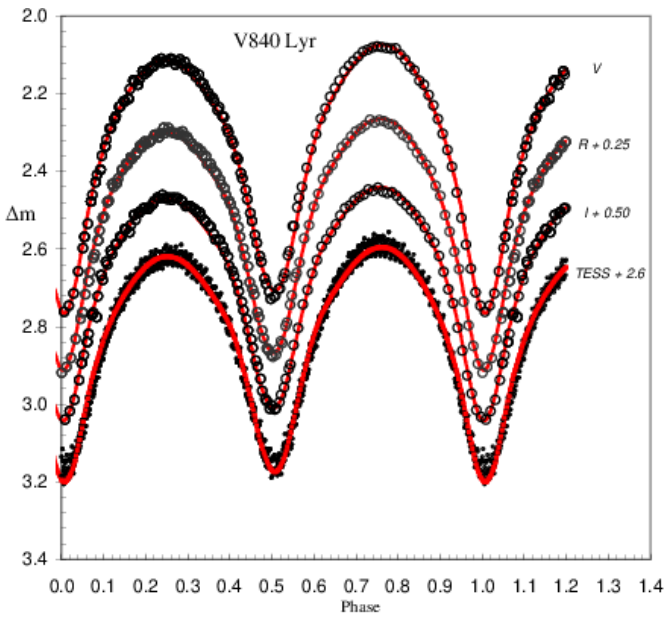
Fig. 4 The photometric light curves and synthetic/model fit with the dark-colder spot (solid-red line) of V840 Lyr in the V, R c and I c filters. The observational light curve and synthetic/model fit of TESS data are given at the bottom. The color figure can be viewed online.
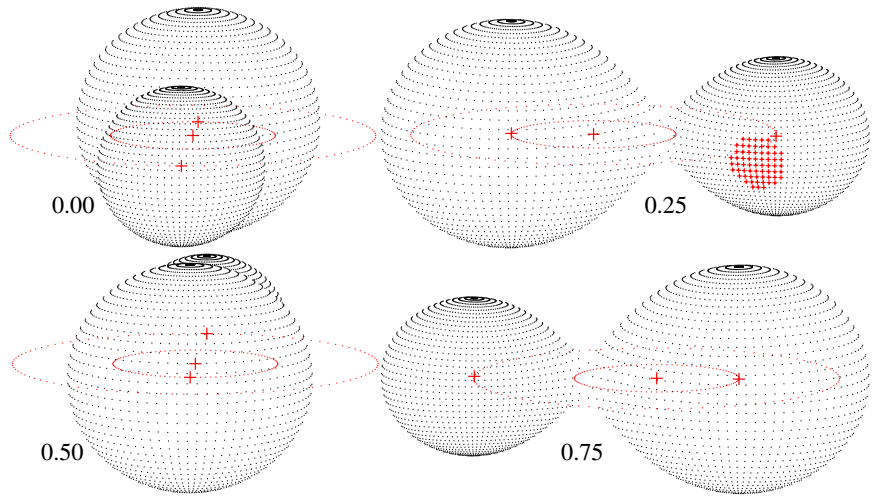
Fig. 5 The W-type contact binary V840 Lyr’s Roche configuration at phases 0.00, 0.25, 0.50, and 0.75. The color figure can be viewed online.
5 ABSOLUTE PARAMETERS
For V840 Lyr a W-subtype W UMa binary system, we estimated the absolute parameters listed in Table 5 using the best model for the 2020 light curves as a guide. Without radial velocity information, the total mass cannot be calculated directly. The binary stars’ masses, radii, and luminosities are, however, listed from the literature.
The absolute parameters were calculated using statistical relationships. For short period binaries with
with the parabolic fit’s standard error given as
The V840 Lyr eclipsing binary system’s q mass ratio was estimated to be
Lucy & Wilson(1979) calculated the fill-out parameter (f), which indicates the degree of contact between companion stars in a binary system using the formula
Using the astrophysical well-known equations:
where the prefix (*) refers to system component stars, and
The log(g) values of V840 Lyr are compatible with the values calculated to be
We used the IPAC’s database given in NASA/Extragalactic and the reddening maps from Schlafly & Finkbeiner(2011) for the interstellar extinction value (A v ) to the distance of the V840 Lyr binary system,
to be
We display on the
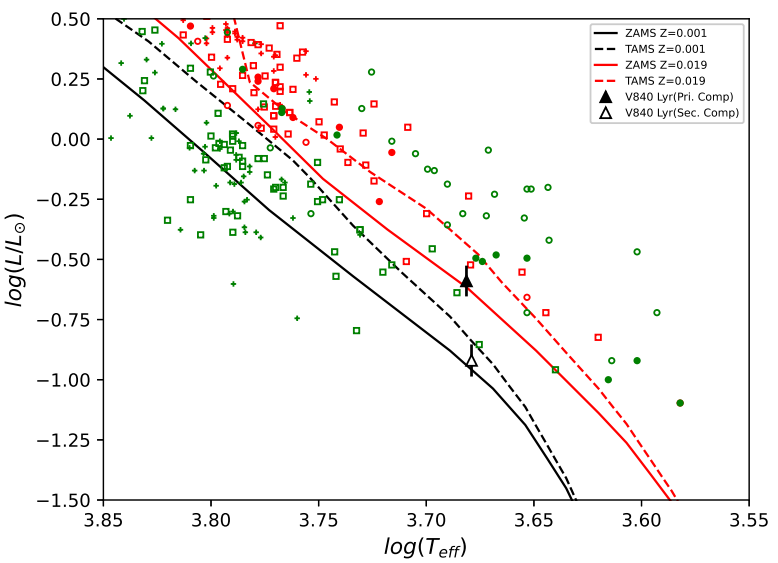
Fig. 7 The locations of V840 Lyr along the ZAMS and TAMS lines from Girardi et al.(2000) (Z = 0.001 and 0.0019) on the HR diagram. The black-filled and empty triangles display V840 Lyr’s primary and secondary stars. The example systems of Yakut & Eggleton(2005) are presented. ’

Fig. 8 V840 Lyr’s location on the mass-luminosity diagram. The sample systems, symbols, and other details are indicated in Figure 3. The color figure can be viewed online.
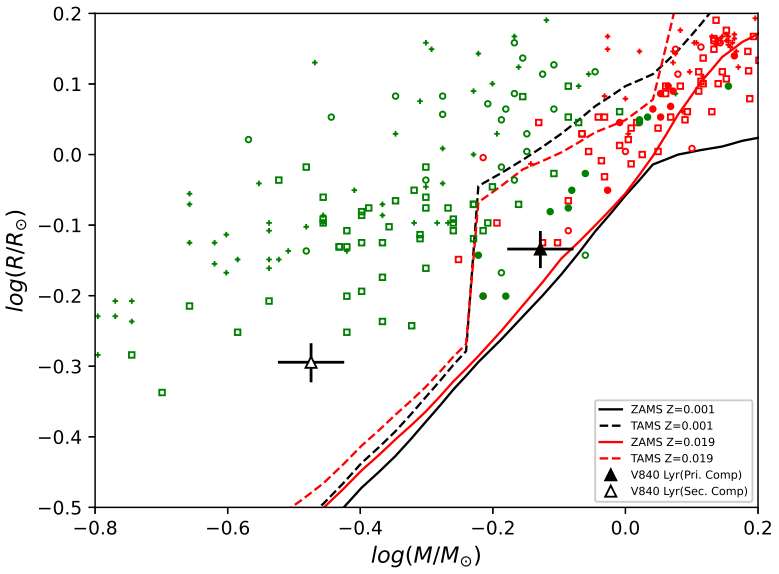
Fig. 9 V840 Lyr location on the mass-radius diagram. The sample systems, symbols, and other details are indicated in Figure 3. The color figure can be viewed online.
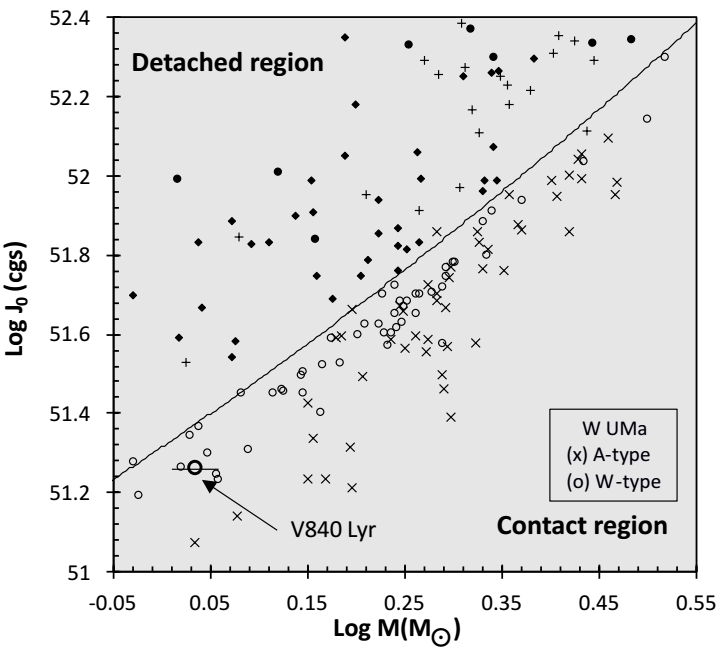
Fig. 10 The location of V840 Lyr on the mass-angular momentum diagram according to Eker et al.(2006), under the
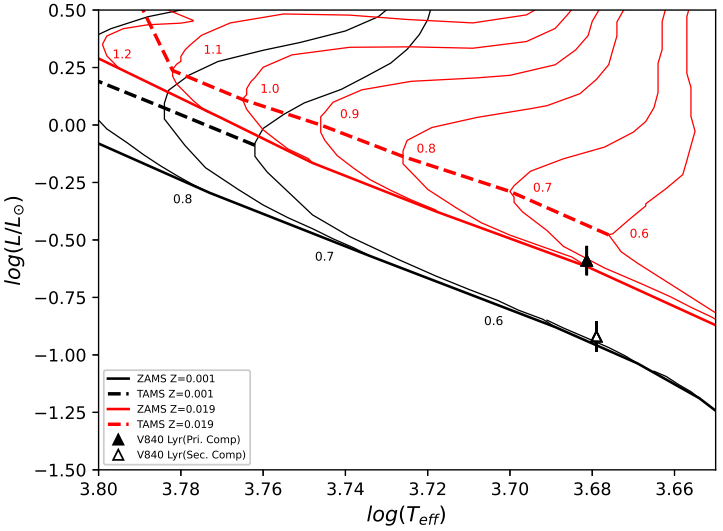
Fig. 11 V840 Lyr’s components (triangles) plotted in the HR diagram with ZAMS, TAMS, evolutionary tracks and isochrone derived from Girardi et al.(2000) for Z = 0.001 and 0.019. The errors are within the symbol’s size. The color figure can be viewed online.
6 DISCUSSION AND CONCLUSIONS
The asymmetrical light curves of V840 Lyr we acquired from the SPM observatory show the O’Connell effect. It is clear that the maximum level at phase 0.75 of our multicolour light curves is, respectively, around 0.033 mag, 0.030 mag, and 0.024 mag higher than those at phase 0.25 despite the fact that the Min-I and Min-II minimum depths of our multicolour light curves are nearly equal. The light curves we acquired do not demonstrate a large scatter, as shown in Figure 4. This suggests that more credible solutions might be found using our light curves.
The secondary component’s dark-cool spot was considered to account for the asymmetries in our light curves. With the help of the Phoebe0.31a interface software based on the WD method, we discovered that V840 Lyr is an extreme mass ratio (q = 0.4509) W-subtype contact W UMa type binary star with a 15.14% fill-out factor. The photometric results showed that the more massive component’s temperature is about 45 K higher than that of the less massive component. Over four years, V840 Lyr was observed, and 17 times of light minima were discovered.
According to the absolute parameters estimated in this work, the angular momentum
We compared the component locations of the target system with LTCBs (A type), LTCBs (W type), NCBs, and DCBs samples in the
Regarding the absolute parameters of the primary component, V840 Lyr is also compatible with the evolutionary tracks for
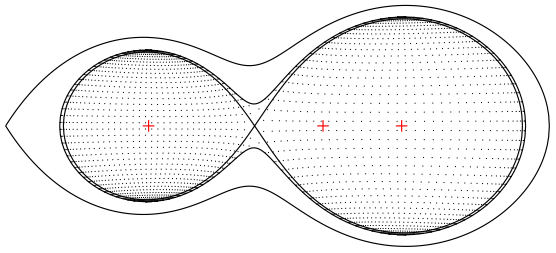
Using the Binary Maker 3.0 tool Bradstreet & Steelman(2002), we created Roche configurations of the components that make up the V840 Lyr in accordance with the target system’s absolute parameters (see Figure 5-6).
Using the estimated absolute parameters, we computed the distance of the V840 Lyr to be
In summary, V840 Lyr is quite remarkable and seems to be an overcontact binary star. The stars that make up our target binary system have filled Roche lobes. The target system V840 Lyr’s estimated absolute parameters are roughly within the predicted limits, as demonstrated by a comparison with the other W UMa stars. However, the absolute solution parameters of the target system V840 Lyr in this work should be considered as preliminary values in the absence of spectroscopic studies, which are necessary for the more reliable identification of the spectral types, the semi-major axis, and the mass ratio.
Combining more sensitive photometric and spectroscopic observations of this binary star would be a significant step forward in advancing our comprehension of contact binaries, validating the existing results, and revealing the true structure of this system. We encourage researchers to do the appropriate photometric and spectroscopic measurements to confirm the existence of starspots and establish their locations. This will help us to learn more about this system.

