


 nueva página del texto (beta)
 Inglés (pdf)
 Artículo en XML
 Referencias del artículo
 Enviar artículo por email
 Citado por SciELO
  Similares en
SciELO
Similares en
SciELO 
 Permalink
1 INTRODUCTION
Our knowledge of binary systems allows us to divide them in three large groups. (1) The detached systems, in which both the stars are inside their respective Roche lobes without interactions between the components. (2) The semi-detached systems, with mass transfer from a component that fills its Roche lobe to the other one. And (3) contact, or over-contact, binaries that share the same outer atmosphere, the common convective envelope (CCE), and generally are in thermal and physical contact.
The transition between semidetached to contact phase, and viceversa, is predicted by the thermal relaxation oscillation theory (TRO theory) (Lucy 1976; Flannery 1976; Robertson & Eggleton 1977; Yakut & Eggleton 2005; Li et al. 2008). TRO considers that the mass transfer between the components causes them to evolve oscillating in a cycle, where the flow of mass is reversed and the contact binary evolves toward small mass ratios q. Upon reaching the q min the contact binary becomes unstable and may coalesce as progenitor of a single rapidly rotating star ([Stepien 2011]); [Tylenda et al.(2011)]; [Zhu et al.(2016)]; [Liao et al.(2017)]; [Li et al.(2021)]; [Li et al.(2022)] .
All the systems analyzed in this work belong to the spectral type K. The contact K-type systems here presented are of particular interest because only a few of them are well studied, especially systems with periods shorter than 0.25 days that are important objects for explaining the period cut-off phenomenon ([Paczynki et al.(2006)]; [Rucinki & Pribulla(2008)]; [Liu et al.(2014)]; [Li et al.(2019)]).
It is clear that the study of binary systems is fundamental to acquire information about their formation and evolutionary status. The objective of this work is to acquire and estimate properties of a set of CBs using high quality photometric data and empirical relations.
2 Information about the systems
1SWASP J105924.30+220458.0 (J105924) and 1SWASP J123609.78+341159.5 (J123609) were found to be variable stars in the region covered by the Catalina Surveys Data Release-1 (CSDR1) [Drake et al.(2014)]. The type of variation was given for both systems (W UMa type), the amplitude as 0.12 mag. and the period as 0.231092 days for J105924; and the amplitude as 0.19 mag. and the period as 0.248408 days for J123609.
1SWASP J132308.74+424613.3 (J132308 = HW CVn): the type of variability was reported by [Butters et al.(2010)] as a generical EA/EB in the first WASP public data release. The period was identified by [Lohr et al.(2013)] as 19451.249s or 0.225130 days while the 5 th edition of the General Catalogue of Variable Stars (GCVS) by [Samus' et al.(2017)] report the first complete ephemerides:
The type of variability is EW and the amplitude of the light variation is 0.35 mag.
The first period for 1SWASP J161858.05 +261303.5 (J161858 = V1458 Her) was found by [Lohr et al.(2013)] as 19766.679s or 0.228781 days, and [Samus' et al.(2017)] in the GCVS report the complete ephemeris
suggesting the type of variation and a low amplitude of 0.17 mag. The system was analysed in a 2020 article [Li et al.(2020)] together with other eight contact binaries around the short-period cutoff; a comparison of the results will be discussed later.
1SWASP J164349.61+325637.8 (J164349 = V1475 Her) was first reported as a Delta Scuti star in the Robotic Optical Transient Search Experiment I (ROTSE-I) surveys [Akerlof et al.(2000)] with the half period of 0.11255 days. The correct period (19447.858s or 0.225091 days) and the nature of the eclipsing system was reported again by [Lohr et al.(2013)]. The complete ephemerides was published in the GCVS [Samus' et al.(2017)]:
The amplitude of the EW light variation was found to be 0.21 mag.
J123609 and J164349, with a mass ratio q > 0.72 are considered high mass ratio systems, or H-type systems, as suggested by [Csizmadia & Klagyivik(2004)].
3 Observations and new ephemerides
The preliminary available information about the targets was taken from the AAVSO Variable Star Index database (VSX) and is presented in Table 1.
Table 1 Parameters of the targets from the VSX database
| Target | RA(2000) | Dec(2000) | Period, d | Ampl. | Reference |
|---|---|---|---|---|---|
| J105924 | 10 59 24.30 | +22.04.58.5 | 0.231092 | 0.12 | [Drake et al.(2014)] |
| J123609 | 12 36 09.75 | +34.11.59.7 | 0.248408 | 0.19 | [Drake et al.(2014)] |
| J132308 | 13 23 08.74 | +42 46 13.0 | 0.225133 | 0.16 | Butters et al.(2010) |
| J161858 | 16 18 57.85 | +26 13 38.5 | 0.228779 | 0.17 | Butters et al.(2010) |
| J164349 | 16 43 49.61 | +32 56 37.8 | 0.2250909 | 0.11 | [Akerlof et al.(2000)] |
All the observations were carried out at the San Pedro Mártir National Observatory (SPM, México) with the 0.84-m telescope (an f/15 Ritchey-Chretien), the Mexman filter-wheel and the Marconi 5 CCD detector (an e2v CCD231-42 chip with
Alternated exposures in filters B, V, R c and I c were taken during the observing runs. The details of the observations are shown in Table 2.
Table 2 Log of the observations
| Object | UTObsDate | Hours | ExpTime B | ExpTime V | ExpTime R | ExpTime I |
|---|---|---|---|---|---|---|
| J105924 | 2022-03-27 | 5.75 | 40 | 20 | 15 | 15 |
| J123609 | 2022-03-26 | 7.53 | 40 | 20 | 15 | 15 |
| 2022-04-27 | 2.63 | 80 | 40 | 30 | 30 | |
| 2023-03-29 | 6.54 | 60 | 40 | 25 | 25 | |
| J132308 | 2022-03-23 | 5.47 | 40 | 20 | 15 | 15 |
| 2022-03-25 | 1.88 | 40 | 20 | 15 | 15 | |
| J161858 | 2022-04-23 | 4.44 | - | 40 | 20 | 15 |
| 2022-04-25 | 5.71 | 40 | 20 | 15 | 15 | |
| J164349 | 2022-04-14 | 5.81 | 40 | 20 | 15 | 15 |
All the images were processed using IRAF1 routines. Images were bias subtracted and flat field corrected before the instrumental magnitudes were computed with the standard aperture photometry method.
In Table 3 are reported the ToMs and the new ephemerides derived from our observations.
Table 3: Times of minimum and new ephemerides from our observations
| Object | HJD | Epoch | O-C | Error | Source | New Ephemerides | |
|---|---|---|---|---|---|---|---|
| J105924 | 2459665.6977 | -0.5 | 0 | 0.0027 | [1] | HJD 2459665.8122(10) | 0.d2290620(5) |
| 2459665.8122 | 0 | 0 | 0.0032 | [1] | |||
| J123609 | 2459664.7260 | 0 | 0.0002 | 0.0057 | [1] | HJD 2459664.7258(11) | 0.d2484199(171) |
| 2459664.8480 | 0.5 | -0.002 | 0.0047 | [1] | |||
| 2459664.9760 | 1 | 0.0018 | 0.0044 | [1] | |||
| 2459696.6477 | 128.5 | 0 | 0.0028 | [1] | |||
| J132308 | 2456311.0270 | 0 | 0 | - | [2] | HJD 2456311.0270(14) | 0.d2251345(1) |
| 2459661.8169 | 14883.5 | 0.001 | 0.0016 | [1] | |||
| 2459663.9537 | 14893 | -0.001 | 0.002 | [1] | |||
| J161858 | 2456395.9480 | 0 | 0 | - | [2] | HJD 2456395.9480(20) | 0.d2287771(2) |
| 2459694.8008 | 14419.5 | 0.0014 | 0.0024 | [1] | |||
| 2459694.9124 | 14420 | -0.0014 | 0.0019 | [1] | |||
| J164349 | 2456459.8550 | 0 | 0 | - | [2] | HJD 2456459.8550(13) | 0.d2250909(1) |
| 2459683.8340 | 14323 | 0.0014 | 0.0016 | [1] | |||
| 2459683.9439 | 14323.5 | -0.0012 | 0.0018 | [1] | |||
| 2459711.8561 | 14447.5 | -0.0002 | 0.0018 | [1] |
[1] This paper. [2] AAVSO VSX.
The Transiting Exoplanet Survey Satellite (TESS; [Prsa et al.(2022)]) provides some photometric data for our binary systems expressed in what are called T-magnitudes. These magnitudes are derived under some assumptions from the properties of the binary stars and their magnitudes at different wavelengths [Stassun et al.(2018)]. Here we abstain from using T-magnitude data and prefer to use our four clear-cut photometric bands data from SPM, and leave for future work a possible comparison on how the derived parameters here are affected when using the TESS data. Given the excellent quality and multi-wavelength data of our terrestrial observations we conjecture that differences might be in the last one or two digits of our derived values reported below.
4 Photometric solution with the W-D method
The light curves of the systems were analyzed using the latest version of the Wilson-Devinney (W-D) code ([ Wilson & Devinney(1971)]; [Wilson(1990)]; [Wilson & van Hamme.(2016)]).
Before starting the analysis some input parameters must be fixed, one of the most important being the temperature of the primary component (T 1). For this purpose, we have averaged the temperatures published in different stellar surveys (Table 2) and used this value in our set of parameters.
The temperature of the primary component of the systems suggests a convective envelope. Hence, we fixed in the W-D code the following atmospheric parameters to their theoretical values: the gravity-darkening coefficients g 1 = g 2 = 0.32 [Lucy(1967)] and the bolometric albedos A 1 = A 2 = 0.5 [Rucinki(1973)]; the limb-darkening values originate from [van Hamme(1993)] for longg = 4.0 and solar abundances.
The other parameters left as adjustable during the calculation were those suggested by the operation Mode 3 of the code; Mode 3 is used for the analysis of binary systems in contact and the free parameters are the orbital inclination i, the mean surface effective temperature of the secondary component T
2, the dimensionless surface potentials of the primary and secondary stars
The well-known q-search method was used to find the best initial mass ratio value fixed at each iteration and increased by 0.05 from q = 0.05 to 1 and by 0.1 beyond q = 1, since the mean residual showed a minimum.
For the systems J105924 and J164349, the results indicated the presence of a third light while for the other three systems the values for third light were negligible (smaller than the uncertainties).
The well know O’Connell effect, i.e. the different height of the maxima, [ O'Connell(1951)] is visible in the light curves of four of the systems (Figure 4). For this reason the spot parameters, co-latitude
For system J132308 we were not able to find a good fit to its light curves using Mode 3, so we switched to Mode 2, a detached configuration with no constraint on the potentials [Leung & Wilson(1977)] to test the semi-detached configuration. After few iterations, the solution converged to Mode 5- a semi-detached configuration with star 2 filling its Roche lobe. Using this Mode, the fixed parameters are the same of Mode 3 while among the free parameters
In Figure 1 the behavior of the q search procedure is visible, where the mean residual for the input data (
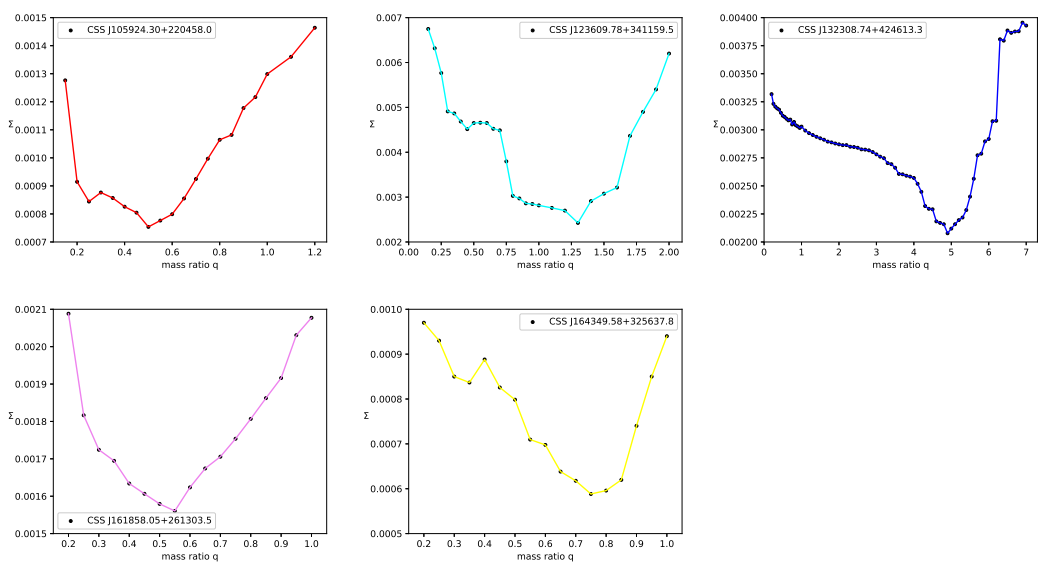
Fig. 1 The relation
The value of q corresponding to the minimum value of
The final results obtained are listed in Table 5 where, for systems with mass ratio q > 1 the use of the reciprocal value of q (
Table 4: Target temperature
| Target | [1] | [2] | [3] | [4] | [5] | [6] | [7] | [8] | [9] | [10] |
|---|---|---|---|---|---|---|---|---|---|---|
| J105924 | 5022 | 5022 | ||||||||
| J123609 | 4996 | 4890 | 4890 | 4731 | 4844 | 4814 | 4860 | |||
| J132308 | 4447 | 4447 | 4377 | 4638 | 4452 | 4542 | 4480 | |||
| J161858 | 4580 | 4580 | ||||||||
| J164349 | 4457 | 4324 | 4361 | 4380 |
[1] LAMOST DR7, (Qian et al. 2020), [2] CRTS VSC, (Marsh et al. 2017), [3] ATLAS Refecat2, (Tonry et al. 2018), [4] Gaia DR2, (Brown et al. 2018), [5] Regression in GaiaDR2, (Bai et al. 2019), [6] Gaia EDR3, (Anders et al. 2022), [7] TESS Input Catalog - v8.0, (Stassun et al. 2019), [8] TESS Input Catalog - v8.2, (Paegert et al. 2021), [9] SDSS, (Miller 2015), [10] Average.
Table 5: Values of the fixed and calculated parameters
| Parameter | J105924 | J123609 | J132308 | J161858 | J164349 |
|---|---|---|---|---|---|
| Spectral type | K2 + K2 | K3 + K6/K7 | K4 + K6/K7 | K4 + K7 | K5 + K9 |
| i | 55°.028(0.129) | 40°.980(0.710) | 62°.070(0.392) | 46°.040(0.289) | 59°.368(0.055) |
| T 1 | 5022K Fixed | 4860K Fixed | 4480K Fixed | 4580K Fixed | 4380K Fixed |
| T 2 | 5018K(71) | 4216K(42) | 4209K(24) | 4065K(18) | 3909K(10) |
| Ω1,2 | 2.5898(0.0017) | 3.9074(0.0042) | 8.6765(0.0472) | 2.7618(0.0039) | 2.9562(0.0018) |
| Ω2 | 9.03996 Fixed | ||||
| mass ratio q or q inv | 0.5017(0.0091) | 0.7470(0.0261) | 0.2020(0.0524) | 0.5486(0.0048) | 0.7499(0.0010) |
| ΔT | 4K | 644K | 271K | 515K | 471K |
| f | 93.30% | 54.80% | 6.70% | 63.60% | 78.90% |
| F2 | 0% | ||||
| L1B | 0.2189(0.0214) | 0.5601(0.0192) | 0.2755(0.0076) | 0.6711(0.0060) | 0.2908(0.0026) |
| L1V | 0.2227(0.0186) | 0.5283(0.0172) | 0.2623(0.0060) | 0.6510(0.0054) | 0.2802(0.0024) |
| L1R | 0.2233(0.01869 | 0.5083(0.0153) | 0.2509(0.0048) | 0.6411(0.0050) | 0.2674(0.0021) |
| L1I | 0.2225(0.0175) | 0.4909(0.0136) | 0.2453(0.0039) | 0.6286(0.0045) | 0.2405(0.0018) |
| L2B | 0.1304(0.0099) | 0.2423(0.0101) | 0.6060(0.0020) | 0.1664(0.0008) | 0.0976(0.0010) |
| L2V | 0.1327(0.0092) | 0.2807(0.0081) | 0.6304(0.0018) | 0.1910(0.0009) | 0.1107(0.0008) |
| L2R | 0.1331(0.0088) | 0.3185(0.0085) | 0.6484(0.0027) | 0.2162(0.0011) | 0.1211(0.0011) |
| L2I | 0.1329(0.0086) | 0.3525(0.0094) | 0.6726(0.0031) | 0.2375(0.0008) | 0.1218(0.0012) |
| L3B | 0.5809(0.0193) | 0 | 0 | 0 | 0.5485(0.0003) |
| L3V | 0.5755(0.0189) | 0 | 0 | 0 | 0.5510(0.0003) |
| L3R | 0.5844(0.0186) | 0 | 0 | 0 | 0.5556(0.0005) |
| L3I | 0.5914(0.0182) | 0 | 0 | 0 | 0.5844(0.0004) |
| R1pole | 0.4679(0.0018) | 0.3745(0.0035) | 0.2572(0.0043) | 0.4421(0.0011) | 0.4408(0.0002) |
| R1side | 0.5134(0.0030) | 0.4008(0.0049) | 0.2712(0.0053) | 0.4780(0.0016) | 0.4817(0.0003) |
| R1back | 0.5760(0.0069) | 0.4679(0.0123) | 0.3339(0.0157) | 0.5255(0.0030) | 0.5635(0.0008) |
| R2pole | 0.3575(0.0041) | 0.4192(0.0026) | 0.4856(0.0008) | 0.3436(0.0019) | 0.3948(0.0002) |
| R2side | 0.3859(0.0060) | 0.4516(0.0039) | 0.5278(0.0010) | 0.3659(0.0025) | 0.4286(0.0003) |
| R2back | 0.5240(0.0520) | 0.5078(0.0082) | 0.5505(0.0010) | 0.4342(0.0067) | 0.5436(0.0017) |
| Σ | 0.00075351 | 0.00237069 | 0.00207468 | 0.00155913 | 0.00058782 |
| Latspot | 89°.4(0.9) | 41°.7(1.2) | 121°(1.9) | 99°.5(1.7) | |
| Longspot | 110°.6(1.3) | 285°.2(1.9) | 79°.2(1.4) | 85°.2(1.2) | |
| Radius | 28°.7(0.56) | 35°.5(0.89) | 36°.7(0.63) | 48°.5(1.11) | |
| T/F | 1.035(0.04) | 0.945(0.08) | 0.750(0.08) | 1.03(0.06) | |
| Component | 1 | 2 | 1 | 1 |
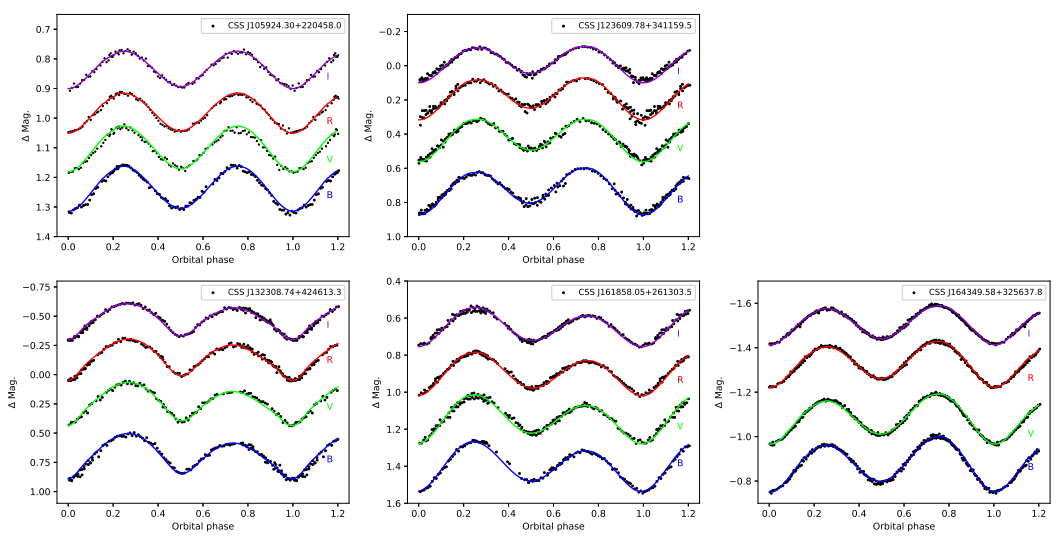
Fig. 2 CCD light curves of the systems. The points are the original CCD observations and the full lines are the theoretical fits with the surface spot contribution and third light. The color figure can be viewed online.
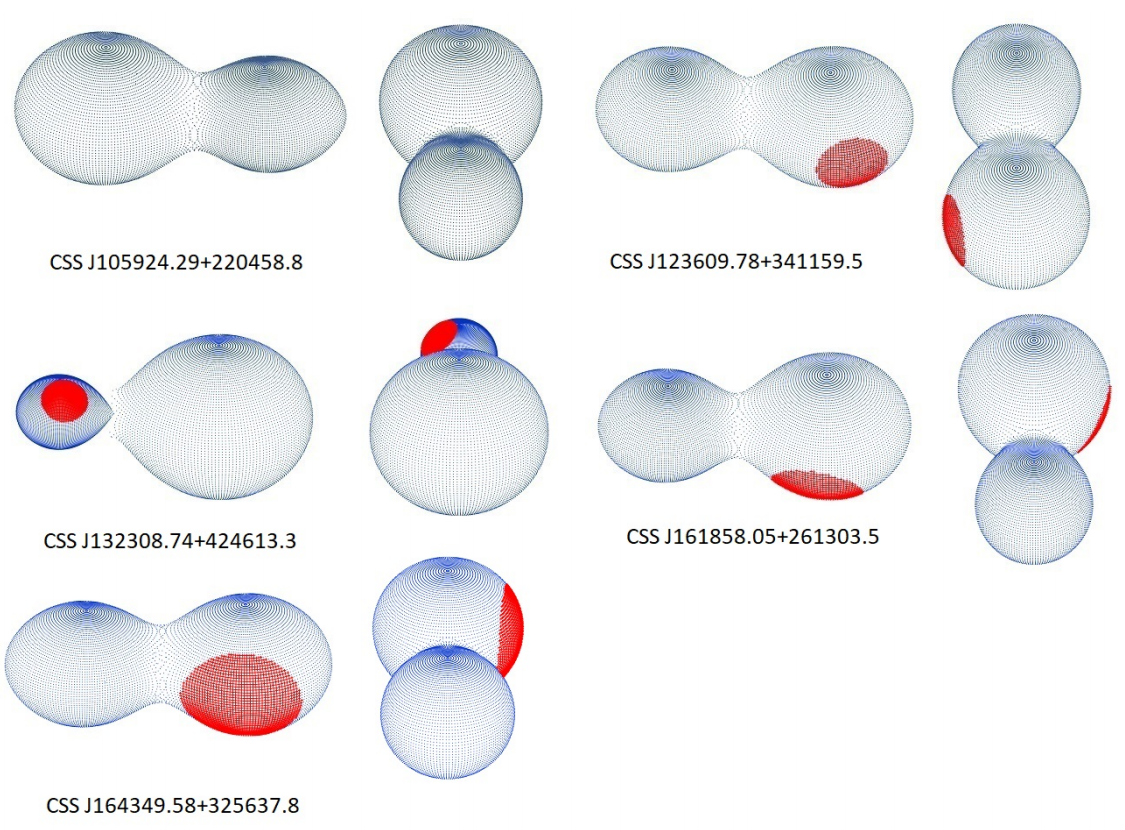
Graphic representations of the systems are shown in Figure 3, using the Binary Maker 3.0 software [Bradstreet & Steelman(2002)].
5 Evolutionary status of the systems
For the determination of the absolute parameters of the systems under study, we used the relationship P - a (period-semi-major axis) developed by [Dimitrov & Kjurkchieva(2015)]. This relationship was developed based on 14 binary stars having P < 0.27d as follows:
where P is given in days and a in solar radii.
Knowing the semi-major axis a the total mass was determined and, with the fractional radii of the systems r 1,2, we calculated the absolute radii R 1,2 and therefore the absolute luminosities L 1,2.
Finally, following [Wilson(1978)], we may make a comparison between the absolute separation a k from Kepler’s law:
and the separation that the system would have in contact a z
For the value of M 1 as given in Table 4 all the systems turns out to be not a zero-age contact systems, because we have always a k > a z .
To investigate the current evolutionary status of our systems, the physical parameters listed in Table 6 are used.
Table 6 Estimated absolute elements
| Target | J105924 | J123609 | J132308 | J161858 | J164349 |
|---|---|---|---|---|---|
| Sub-type | A | W | Semidetached | A | A |
| L1⊙ | 0.423(0.033) | 0.361(0.024) | 0.201(0.017) | 0.252(0.021) | 0.212(0.013) |
| L2⊙ | 0.280(0.035) | 0.166(0.019) | 0.078(0.009) | 0.098(0.011) | 0.114(0.008) |
| R1⊙ | 0.860(0.033) | 0.848(0.028) | 0.843(0.025) | 0.797(0.027) | 0.801(0.025) |
| R2⊙ | 0.700(0.030) | 0.764(0.029) | 0.464(0.025) | 0.630(0.030) | 0.737(0.024) |
| a | 1.65(0.05) | 1.84(0.05) | 1.61(0.05) | 1.65(0.05) | 1.61(0.05) |
| M1⊙ | 0.773(0.078) | 0.780(0.050) | 0.931(0.077) | 0.748(0.073) | 0.639(0.058) |
| M2⊙ | 0.388(0.046) | 0.582(0.096) | 0.188(0.020) | 0.410(0.044) | 0.479(0.044) |
| logg1 | 4.40 | 4.41 | 4.50 | 4.45 | 4.38 |
| logg2 | 4.28 | 4.38 | 4.32 | 4.39 | 4.33 |
| J0 | 2.1551 | 3.1951 | 1.2751 | 2.2151 | 2.2251 |
| logJ0 | 51.34 | 51.50 | 51.10 | 51.35 | 51.35 |
| Jlim | 2.6651 | 3.5351 | 2.5051 | 2.6551 | 2.4951 |
| logJlim | 51.42 | 51.55 | 51.40 | 51.42 | 51.40 |
In Figure 4, we plotted the primary, more massive (circles) and secondary, less massive (diamonds) components together with other W- and A-type W UMa systems collected by [Latkovic et al.(2021)] in the logarithmic mass-luminosity (M - L) relations along with the ZAMS and TAMS computed by [Girardi et al.(2000)].
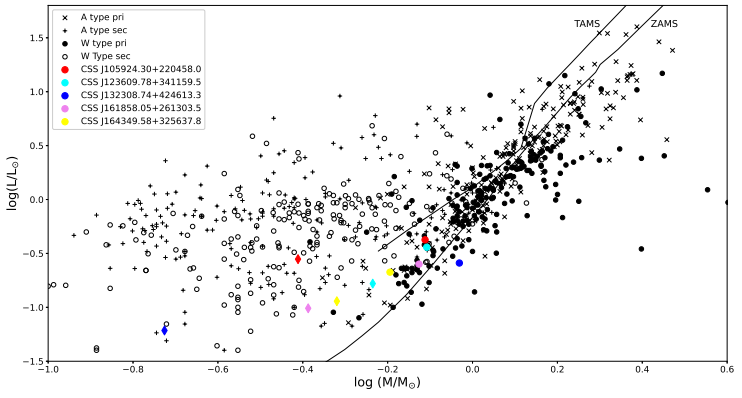
Fig. 4 Location of the components of our systems on the logM - LogL diagram. The primaries are marked with circles and the secondaries with diamonds. The sample of W UMa type systems was obtained from a compilation of [Latkovic et al.(2021)]. zero age main sequence (ZAMS) and terminal age main sequence (TAMS) are taken from [Girardi et al.(2000)] for the solar chemical composition. The color figure can be viewed online.
As it is clear from the Figure 4, both components of the systems seem to be in good agreement with the well-known W UMa binaries on the logM - LogL plane. The location of the primary components is between the ZAMS and TAMS lines; that means that they are slightly evolved. Only the primary component of J132308 is located under the ZAMS as an unevolved star.
On the other hand, the secondary components deviate significantly from ZAMS like most of the secondaries of other W UMa systems.
Also, the secondary component of J132308 is located far from the other secondaries, overluminous and oversized with respect to its present mass.
For all the systems we calculated the orbital angular momentum
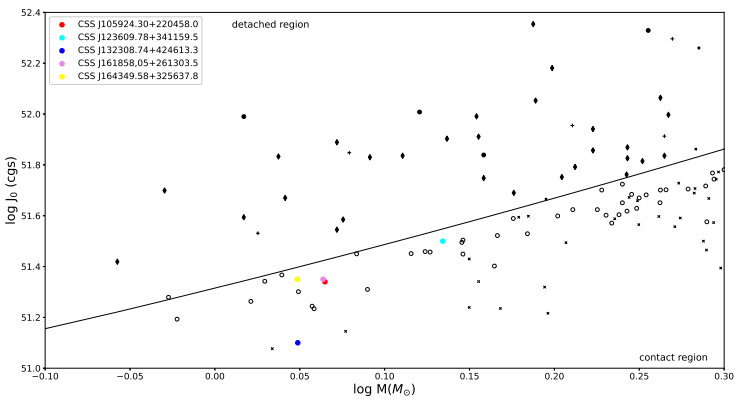
Fig. 5 The position of the five systems in the
The physical significance of this limit is that it marks the maximum orbital angular momentum (OAM) for a contact system to survive. If the OAM of a contact system is more than J lim , the contact configuration breaks.
Our semi-detached system J132308 is located in the contact region endorsing the hypothesis that the system is only formally semi-detached, and we can consider it as a contact system at a key turn-off as predicted by the TRO theory.
Finally, following the work of [Qian et al.(2020)], who investigated the period-temperature relation of contact binary systems using the LAMOST stellar atmospheric parameters, and constructed the heat map for this relation as shown in our Figure 6, we can see that our systems are located inside the red and blue lines that are the boundaries of the normal EW systems.
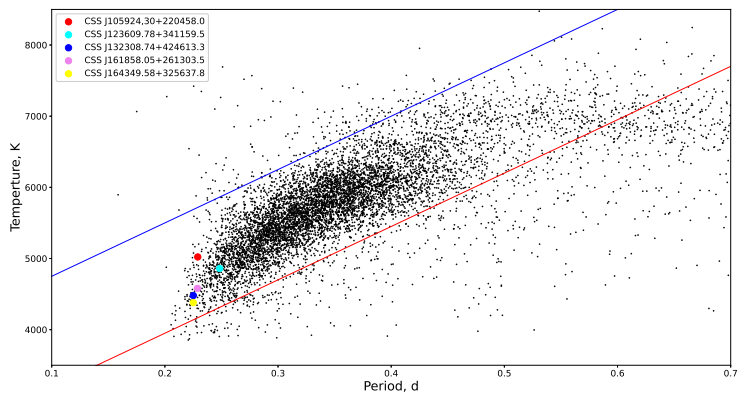
Fig. 6 Correlation between orbital period and temperature based on parameters of 8510 contact binaries from [Qian et al.(2020)]. The red and blue lines are the boundaries of normal EWs. The color figure can be viewed online.
The position of J132308 suggests again that it could be a system at the beginning of the contact phase.
6 Details of the systems and final remarks
6.1 Common Features
6.1.1 Short Period
Our systems possess a short period, four with
It is known that W UMa-type eclipsing binaries show a period cut-off around 0.22 day ([Rucinki(1992)]; [Rucinki(2007)]). Despite several theories (Stepień 2006; Jiang et al. 2012; Li et al. 2019) tried to explain this abrupt short period limit, the question is still open.
Thanks to the increase of survey missions newer EWs were found in the last years, so that it was possible to fix now this limit at the new value of
The systems near the short-period end, according to the period-color relation for contact binaries, are expected to be composed of two K or later-type components [Zhu et al.(2015)] with short periods (
6.1.2 K Spectral Type
K-type contact systems are rare objects and of great interest to investigate the cause of the period cut-off, and to study the structure and evolution of eclipsing binaries (TRO theory).
It is expected that K-type contact binaries, due to the presence of deep convective envelopes and fast rotation, would present magnetic activity, and dark/hot spots should be observed on one or both of the components.
Both components of the five systems studied here belong to the K spectral type and four are found to be spotted.
6.1.3 Low Inclination
The low inclination, between 41° and 62°, is another common characteristic of the systems here presented; values like this are often seen in other contact binaries.
Without spectroscopic data available, the W-D solution may not give the correct solution for such partially eclipsing binaries and hence the corresponding results are preliminary solutions to unveil the nature of the variables. To improve the determination of the mass ratios we applied the q-search procedure.
6.1.4 Low Mass Contact Binaries
Except for J123609, the other four systems possess the typical characteristics of the low mass contact binaries (LMCBs) as proposed by [Stepién & Gazeas(2012)], that is, systems where the total mass is under 1.0 - 1.2M
6.2 CSS J105924.29+220458.8 and CSS J161858.05+261303
J105924 and J161858 are short period (
Generally, deep, low mass ratio contact binaries (DLMR) have high fill-out factors (
The existence of a value of the mass ratio
J105429 and J161858 seem to be in contradiction, but they are not alone, other targets were found with those characteristics and they are summarized in Table 7.
Table 7 Characteristics of some overcontact systems with high fill-out and high mass ratio q
| Target | Period(days) | mass ratio | fill-out(%) | Sub-type | Spectral type | delta T(K) | 3d light | Source |
|---|---|---|---|---|---|---|---|---|
| NSVS 925605 | 0.217629 | 0.678 | 70.2 | A | M + M | 678 | Yes | [1] |
| SWASP | ||||||||
| J161858.05+261303.5 | 0.2287771 | 0.549 | 63.6 | A | K5 + K7 | 515 | No | [2] |
| SWASP | ||||||||
| J200059.78+054408.9 | 0.20569054 | 0.535 | 58.4 | A | K3 + K4 | 272 | not excluded | [3] |
| ER Cep | 0.28573901 | 0.45 | 62 | A | K0 + K2 | 232K | No | [4] |
| GSC | ||||||||
| 1387-0475 | 0.21781128 | 0.474 | 76.3 | A | K3 + K4 | 166 | Yes | [5] |
| EQ Cep | 0.30696328 | 0.526 | 62.1 | A | K2 + K3 | 111 | No | [6] |
| SWASP | ||||||||
| J075102.16+342405.3 | 0.20917273 | 0.78 | 95.4 - 98. 4 | A | M3.5 + M4 | 76 - 83 | Yes | [7] |
| SWASP | ||||||||
| J105924.29+220458.8 | 0.229062 | 0.502 | 93.3 | A | K2+K2 | 4K | Yes | [8] |
| OGLE-BLG-ECL | ||||||||
| 000104 | 0.2007504 | 0.42 | 80 | W | K3+K3 | -6K | No | [9] |
[1] Dimitrov & Kjurkchieva (2015), [2] this paper, [3] Liu et al. (2018), [4]Liu et al. (2011), [5]Yang et al. (2010), [6]Liu et al. (2011), [7] Jiang et al. (2015), [8] This paper, [9] Papageorgiou et al. (2023).
From Table 7 is easy to see that among the nine systems, eight belong to the subtype A of the W UMa group, all have late spectral types (from K to M), for four of them a third light was found during the analysis of the light curves, for another one the third light cannot be excluded, while for four the third light has not a relevant value.
The presence of a third body is, according to different authors, one of most probable causes of this contradiction. In fact, it justifies the deep fill-out factor, and the angular momentum loss (AML) extracted by the stellar companion can be the cause of this rapid orbit shrinking ([Stepién 2006)]; [Stepién 2011)]).
The light curves of J105924 are symmetrical and no significant evidence of inhomogeneities on the surfaces of the two components, i.e. the O’Connell effect, is noticeable. On the contrary, to obtain a good fit of its light curves it was necessary to invoke a cool spot on the primary component of J161858.
[Li et al.(2020)] analyzed the 2018 observations of J161858 done at the Ningbo Bureau of Education and Xinjiang Observatory Telescope and obtained values of the parameters sometimes similar to ours (the mass ratio, the inclination, the fractional radii) and sometimes very different.
The main differences are
The sometimes strong differences in the parameters that come out of the W-D analysis can be surely justified by the low inclination of the system. It is well established that low inclination values can bring a W-D solution that may not give the correct solution for partially eclipsing binaries [Rucinsk (2001)]. Moreover, the low inclination of the system influences also the correct determination of the spot parameters; the appearance (or disappearance) of a spot on one component of the system could even produce minimum depths reversal and thus the classification of the system could fluctuate between the A and W subtype, or vice versa, a classification as observed in several overcontact binary systems.
For J161858 we have calculated an orbital period decrease of
Another possible mechanism for the parabolic variation is the AML is caused by magnetic braking. [Guinan & Bradstreet(1988)] derived an approximate formula for the period decrease rate due to spin-orbit-coupled AML of binary systems as follows:
where k 2 is the gyration constant. With k 2 = 0.1 (see [Webbink(1976)]), and with the absolute dimensions of Table 6 we computed the AML rate to be
which is too small in comparison to the observed value. Therefore, with AML alone it is difficult to fully explain the observed secular period decrease.
For J161858 spectroscopic radial velocity observations are surely necessary in order to understand the configuration of the system.
6.3 CSS J123609.78+341159.5 and CSS J164349.58+325637.8
The principal common characteristic of these two systems is the large mass ratio (q > 0.72) that was first presented by [Csizmadia & Klagyivik(2004)].
The assumption is that in H-type contact binaries the energy transfer behavior is different than in other types of CBs, with the energy transfer rate less efficient at a given luminosity ratio.
Due to the mass ratio being close to unity, to equalize the surface temperature of the components less luminosity should be transferred, so they have a higher transfer parameter. The transfer parameter is defined as:
where
It is possible to calculate the bolometric luminosity ratio from the measured ratio in the V band via
Using all the data of [Csizmadia & Klagyivik(2004)], in Figure 7 we plot the transfer parameter
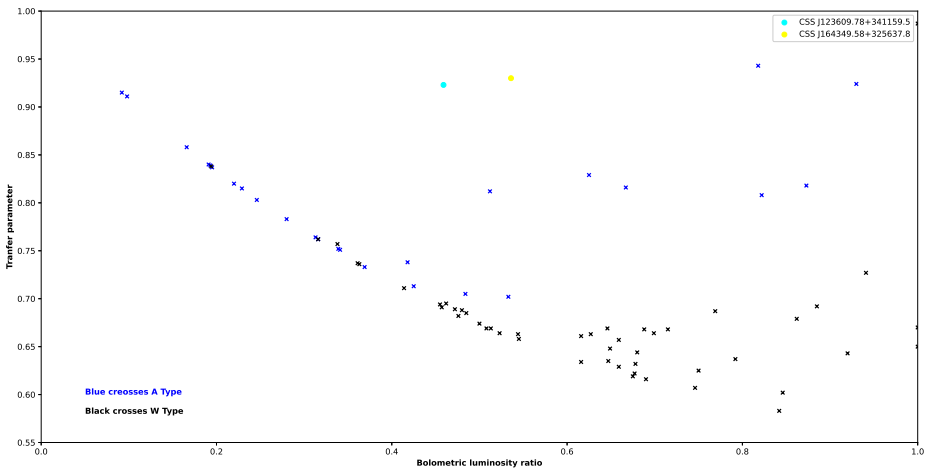
Fig. 7 Bolometric luminosity ratio
Figure 7 shows that, except for the system which has q > 0.72, our systems have a good correlation between the bolometric luminosity ratio and the transfer parameter.
However, subsequent work by [Sun et al.(2020)] showed that in H-type CBs the energy transfer behavior is not significantly different from that of the remaining CBs, but the interest towards these H-type systems remains.
The secondary components of both systems are brighter and larger than their main sequence counterparts, as firstly suggested by the work of [Lucy(1968)], showing that the transfer of energy from the primary to the secondary is the cause of these discrepancies of luminosity and size of the secondary component.
Both systems are in physical contact with a high fill-out value, while the thermal contact is relatively far away.
The presence of third light obtained from our analysis in J164349 can explain, as for the above system J105924, the major fill-out value and the minor difference in temperature in respect to J123609 that did not show the presence of third light.
To achieve a good fit of the light curves a spot solution was considered with the result of a hot spot on the primary component of both systems.
6.4 CSS J132308.74+424613.3
J132308 is a semi-detached system in which the primary component is slightly greater than its Roche lobe, while the secondary component fills it.
The studies of [Shaw(1994)] and [Zhu et al.(2010)] suggest that semi-detached binaries could be in the stage between a detached binary and a contact one.
The good thermal contact between the components (
A cool spot on the secondary component was necessary to better fit the light curves.
The star is clearly worthy of further investigation given its short period and its late spectral type.

