


 nueva página del texto (beta)
 Inglés (pdf)
 Artículo en XML
 Referencias del artículo
 Enviar artículo por email
 Citado por SciELO
  Similares en
SciELO
Similares en
SciELO 
 Permalink
1. Introduction
Nowadays the study of confined fluids is extensive, people have investigated them for several years using simple and more real fluid. Several authors have studied confinement in different geometries and research of phase transitions and structure of those fluids are reported in a lot of works. In fact, fluids can be confined in different natural or synthetic geometries, slit-like pores are present in clays and carbons, cylinder pores can be found in silica and carbon nano tubes whereas sphere pores can be in silica also and metal-organic framework (MOFs). In all these geometries a phenomenon widely known in the literature is that confined fluids exhibit a significantly distinct physical nature compared to bulk liquids [1-7]. Various factors influence this behavior, porous geometry, size and chemical nature of the pore, and the fluid-wall interaction, i.e., the energy between particles of fluid with particles of the solid [8, 9]. This interaction can be effectively described using several potentials such as the Steele potential, employing variations like the 9-3, 10-4, or 10-4-3 [8-10]. In several articles, it has been mentioned that the fluid-wall interaction modifies the phase diagram, change the critical temperature and capillary condensation occurs [2, 11, 12]. Moreover, confined fluids can induce alterations in phase compositions, interfacial tensions, fluid viscosities, and saturation pressures [4-6]. These variations have been observed experimentally and verified through theories such as Non-local density functional theory, NLDFT, or Monte Carlo simulations [7, 13]. In terms of the geometry of the solid some authors have found that capillary condensation of argon, occurs at a lower pressure in spherical than in slit pores. These results are attributed to the curvature of the pore walls and the fluid-wall interaction. In other hand, it also has been observed that for macroscopic pore size, the behavior of the confined fluids is very similar to the bulk fluids however, when the pore size decreases to the meso or microscopic level, fluid-wall interactions become quite dominant, i.e., the fluid properties depend highly on pore size and shape [13, 14].
The equivalent of the bulk liquid-vapor transition in the confined state is known as capillary condensation. This phenomenon constitutes the basis of one of the most fundamental techniques to characterize nanoporous media: the measurements of sorption isotherms [15]. Currently, research has been expanded to include more complex molecules, such as alkanes and liquid crystals, in order to understand in greater detail the phase transitions in these systems [6, 16, 17]. Phase transitions can be determined by a discontinuous jump in the order parameter. In bulk systems this jump can be observed in the fluid density for a given pressure (the saturated vapor pressure) at a constant temperature. The transition occurs when the low density vapor-like phase abruptly changes into a higher density condensed phase in the pore. However this behavior might be different in confined fluid, for instance the jump could be not perfectly vertical. In this sense, the transition pressure where the phase transition occurs could be complicate to locate and methods such as the graphical method, slope method, or Clausius-Clapeyron method can be used [18]. Additionally, this phase transition can only occur at conditions below the pore critical point, which has been validated to differ from the bulk critical point [19].
The Clapeyron approach has been long used for the enthalpy/heat of vaporization calculations in fluids in nanopores [20-22]. It has been found the changes in the enthalpy decreases with the temperature, very similar to that of the bulk. Also, the enthalpy has been studied in confined binary mixtures, which has been demonstrated that is larger than that of the bulk mixtures [23]. Other works have found that the heat of capillary condensation is higher as the pore size decreases [24].
This study focused on constructing phase diagrams for the nitrogen fluid, N 2, in its bulk and confined state within three types of confinement geometries, slit-like, cylindrical, and spherical. Nitrogen was selected because it corresponds to a standard fluid for the adsorption characterization of porous solids. We located and analyzed the liquid-vapor transitions in pores with the Clapeyron approach. We do not intend to repeat what is have done and observed in other works, here we want to explore how the coexistence lines can be obtained from the well known clapeyron equation, and to propose a functional form of those coexistence lines. Additionally we want to show how the latent heat associate with the transitions can be obtained directly from simulation data via the enthalpy.
2. Computational model
Simulations were conducted for Lennard-Jones (LJ) particles in bulk and confined systems. In all cases 1000 particles were initially placed randomly in a simulation box and they were simulated in a Monte Carlo (MC) isothermal-isobaric ensemble (NPT) using reduced LJ units.
Three confined geometries were used, slit-like, spherical and cylindrical pores. In all case the energy of the systems is the contribution of the fluid-fluid (U ff , potential between particles of the fluid) and the fluid-wall (U gs , potential between the wall and particles of the fluid).
where U ff is given by the shifted and cutoff Lennard-Jones (LJ) potential,
where ϵ ff and σ ff are the LJ parameter of the fluid and r c is the cutoff radius. The U gs energy has different expressions and it depends on the geometry variables of the walls. For the slit-like pore simulations were carried out in a NP xy T ensemble with particles confined between two walls separated a distance H in the z-direction, then the external pressure was imposed in the X - Y direction, parallel to the plates, and periodic boundary conditions were used in those directions. The fluid-wall interaction was a 10-4-3 steele potential [8, 9].
where z is the distance of the wall to one particle in the fluid.
The wall parameters were chosen to simulate a N2 fluid confined in silica
plates, ϵ
gs
and σ
gs
are 1.5595 and 0.8867, respectively and the wall density, ρ
s
is 0.9954, Δ = 0.61/
For the cylinder, the confinement was along its radial axis using a NP
z
T ensemble, i.e., pressure was fixed along the axis of the
cylinder, with periodic boundary conditions in the same direction only. The
fluid-wall interaction was the same 10-4-3 steele potential form but using the
appropriatep radial cylindrical coordinates, U
gs
= U
gs
(r) with
For the spherical geometry, the NPT ensemble with an input pressure in all direction was used, with the restriction that particles moved inside the sphere of fix radius. In this case the particle-wall interaction is given by the following equation [10],
where ϵ
gs
and σ
gs
are 1.5595 and 0.8867, respectively, the wall density, ρ
s
is 0.9954, Δ = 0.61/
Another spherical potential was simulated by incorporating the 10-4-3 Steele
potential, described by Eq. (3), with
the corresponding radial spherical coordinates. The potential is expressed as
U
gs
= U
gs
(r), where
In all cases the Monte Carlo moves were following the standard Metropolis method. Simulations were conducted for different reduced temperatures and pressure was changing until the vapour-liquid transition was observed by a discontinuous jump in the fluid density. All simulation were run with a cut-off of r c = 4.0 σ ff up to 250000 MC steps after equilibration of 100000. Equilibration was considered after the configurational energy and the structural properties did not change significantly.
3. Results
3.1. Phase transitions
For bulk systems the internal energy is:
For fluids with constant number of particles (constant mass) where the pressure and the temperature are the main thermodynamic variables the thermodynamic potential which describes the system is the Gibbs free energy
Then, the phase equilibria between two bulk phases, e.g., vapour and liquid, occurs when dG v = dG l and the phase transition is characterize by the Clapeyron equation,
For the slit-like pore the internal energy in the appropriate thermodynamic variables is:
where P xy is the pressure in the X-Y direction, H the walls separation with area A and γ the fluid-wall interfacial tension, the factor of 2 is because the two walls. The Gibbs thermodynamic potential is,
If Eq. (8) is integrated for constant T, P xy and μ we obtain
Then using Eq. (9) with Eq. (10),
The difference between vapour and liquid phases, G v , G l , with N constant
where γ sl and γ sv are the interfacial tension of the wall-liquid and wall-vapour, respectively. if we consider that both phases are in equilibrium, G v = G l , then condensation occurs when
with ρ l and ρ v the densities in the liquid and in the vapour, respectively. Similar relation is obtained in previous works of confined fluids [26, 27]. From Eqs. (8) and (10) is possible to write a Gibbs-Duhem equation for this system,
On the other hand, using Eq. (8) in Eq. (9),
where we have considered that H and N are fixed in the present simulations. The phase equilibria of the confined fluid between two phases, vapor and liquid, occurs when dG v = dG l , i.e.,
resulting in the following Clapeyron equations,
and
For the cylinder the total internal energy is,
here P r is the pressure along the radial axis of the cylinder, V = πr 2 L, where L and A are the volume, the length and the area of the cylinder in contact with the fluid and γ the fluid-wall interfacial tension. The Gibbs free energy is,
If Eq. (20) is integrated for constant T, P r and μ we obtain
Then using Eqs. (21) and (22),
Evaluating the free energy in the vapour and in the liquid considering that in the equilibrium G v = G l ,
with γ sl and γ sv are the interfacial tension of the wall-liquid and wall-vapour and ρ l and ρ v the densities in the liquid and in the vapour, respectively. From Eqs. (20) and (22) is possible to write a Gibbs-Duhem equation for this system,
On the other hand, using Eq. (20) in Eq. (21),
where we have considered that the number of particles, N, and the radius of the cylinder, r, are fixed. The phase equilibria between the two phases, vapor and liquid, occurs when dG v = dG l , and the corresponding Clapeyron equations are,
and
where V is the volume of the cylinder.
For the case of the sphere, the total internal energy is,
here V and A are the volume and area of the sphere and P r is the pressure along the radial axis and γ the fluid-wall interfacial tension. The Gibbs free energy is,
If Eq. (30) is integrated for constant T, P r and μ we obtain
Then using Eqs. (31) and (32),
with a similar analysis for the other geometries, evaluating the free energy in the vapour and in the liquid and considering that in the equilibrium G v = G l we obtain,
with γ sl and γ sv are the interfacial tension of the wall-liquid and wall-vapour and ρ l and ρ v the densities in the liquid and in the vapour, respectively. r v and r l are the radius of the sphere in the vapour and the liquid, respectively. Moreover, from Eqs. (30) and (32) is possible to write a Gibbs-Duhem equation for this system,
with V the volume of the sphere. On the other hand, using Eqs. (30) and (31),
using that N is fixed in the simulations. The corresponding Clapeyron relations for the equilibrium between the two phases are
and
For all systems the variation of the pressure with the temperature dP/dT can be used to determine the phase transition, which is characterized by a discontinuous jump in the order parameter, the volume or the density.
3.2. Isotherms
As it was mentioned above all simulations were conducted in reduced units of the fluid then, from now on all quantities are given in reduced units.
Simulations were conducted for several temperatures and the vapour-liquid transition was characterized by a jump in the fluid density for a given transition pressure. Since the number of particles is fixed the numerical density was defined as the number of particles divided by the volume of the pore, slit-like, cylinder or spherical. In Fig. 1, the isotherms are shown for the different pore geometries. The isotherms for the sphere geometry with the fluid-wall interaction given by Eq. (4) [Fig. 1a)] do not show any discontinuity in the density, all the plots look continuous, most probably the chosen temperatures are above the critical and there is not phase transition. We change the fluid-wall interaction potential to the same form as the slit-like and cylinder pores, i.e., 10-4-3 potential, with radial coordinates to see if any change is observed. In Fig. 1b), the isotherms for this new sphere was plotted and it is possible to observe now discontinuous jumps in the density indicating that the systems suffer a first order phase transition. As the temperature increases this discontinuity becomes smaller. In the case of the cylinder [Fig. 1c)] and the slit-like [Fig. 1d)] pores once again it is observed how the fluid density increases as the pressure increases until an evident jump occurs indicating that the systems go to a phase transition, from vapour to liquid. It is also noted that the interval of the transition pressure among temperatures is higher for the cylinder and the sphere pores whereas for the slit-like pore the transition pressure occurs in a narrower interval.
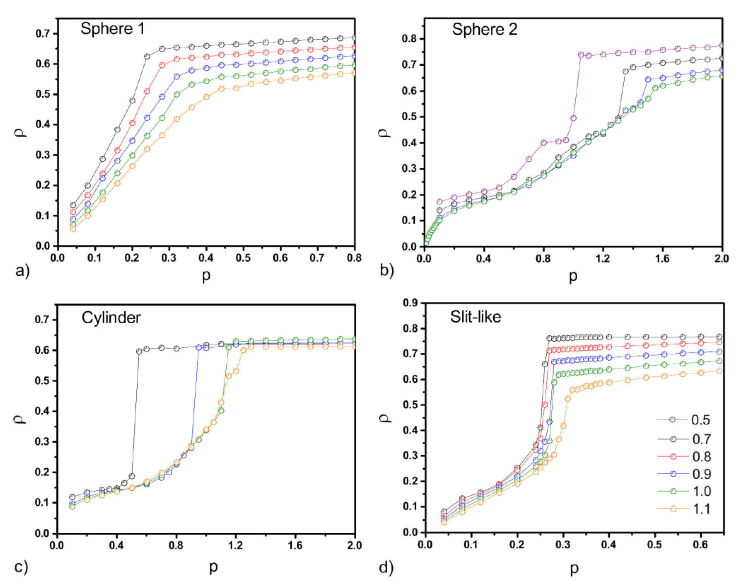
Figure 1 Isotherms, for the ρ-P plots for all the
confined geometries. a) spherical pore using Eq. (4) for the
fluid-wall interaction, b) p spherical pore using Eq. (3) for the
fluid-wall interaction with the variable
3.3. Phase diagrams
In Fig. 2 the, T-ρ, phase diagrams are shown for all the confined geometries and bulk systems. Bulk data are in good agreement with those reported in previous works [28]. The confinement makes a significant change in fluid phase diagrams respect to the bulk, reducing not only the critical temperature, similar to what was observed in previous works [28], but also changing the shape of the vapour-liquid equilibrium (VLE) curves, they are shifted to the right and they become narrower. Since the sphere is a completely closed geometry with the smaller size parameter, it could be the reason that the VLE curve is the narrowest of all the pores. It is observed that the gas phase extends more respect to the bulk in all the geometries, whereas the liquid is reduced for the sphere and the cylinder pores. However, for the cylinder the gas branch is longer than for the slit-like pore while the opposite occurs for the liquid branch, it extends further for the slit-like pore than for the cylinder. Interesting is that in all the geometries the reduction of the critical temperature is nearly the same, however, it occurs at different densities.
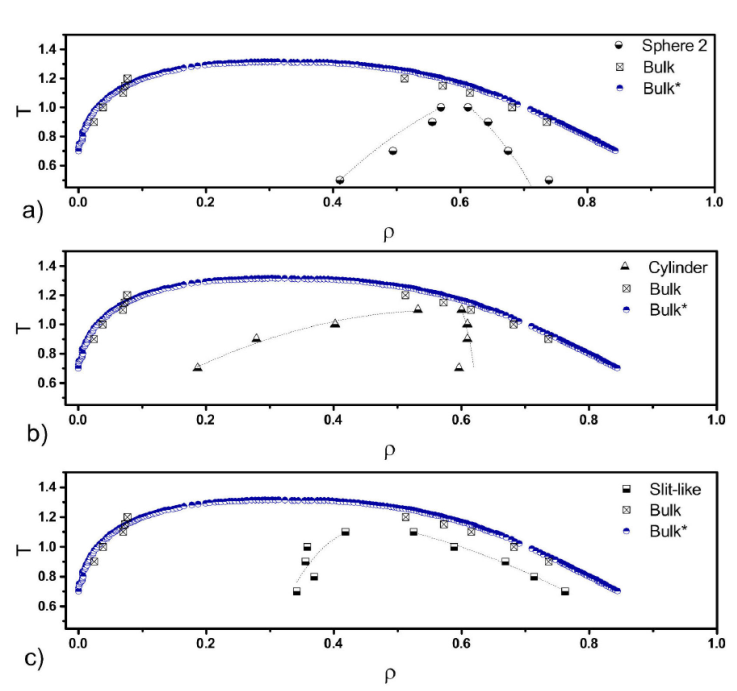
Figure 2 T-ρ phase diagrams for all confined fluids and bulk systems. Symbols are indicated in the figures. Bulk data are our results and Bulk* data were taken from reference [28].
Another way to see phase transitions is in the P -T diagram. In Fig. 3 the coexistence lines for all the confined geometries simulated are shown. The lines were fitted with equation,
where A’s are constants to fit. In Eq. (40) the value of the critical temperature is needed and it is estimated with equation
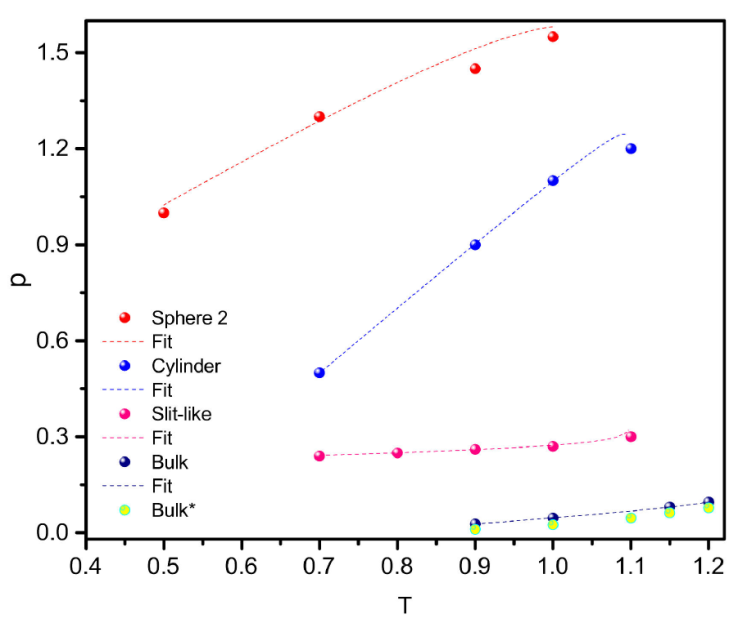
Figure 3 Coexistence lines in the P -T diagram for all the confined fluids and bulk. Bulk* are from reference [28].
Since the pores are not too small, i.e., it is possible to observe a bulk fluid in the middle, we can consider that they are not strictly a two (or one) dimensional systems, therefore we used β = 0.32 [29] as an approximation, close to the critical temperature, where it is valid Eq. (41). The critical temperatures and coefficients in Eq. (40) are given in Table I.
Table I Critical temperatures and fitted coefficients of Eq. (40).
| system | T c | A1 | A2 | A3 |
|---|---|---|---|---|
| bulk | 1.2400 | -0.0099 | 0.1583 | -0.1256 |
| slit | 1.1009 | -0.0131 | 0.0468 | 0.1967 |
| sphere 1 | 1.1005 | 0.1270 | 1.5670 | 0.3060 |
| sphere 2 | 1.1004 | 0.0040 | 0.3086 | -0.0059 |
| cylinder | 1.1002 | 0.0174 | 2.0770 | -0.9387 |
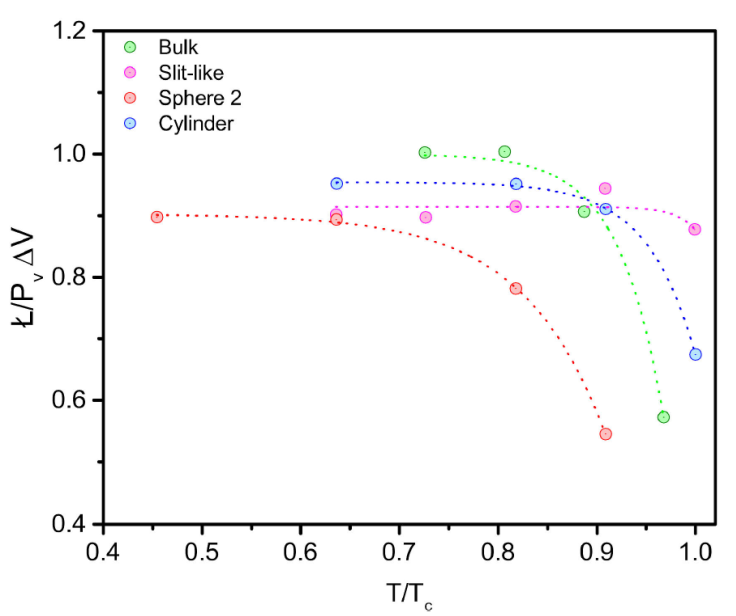
From previous section the Clapeyron equation of each geometry are written in terms of differences in the entropy and volume. However, it is also possible to write the equation in terms of the specific latent heat, Ł, using T ΔS = Ł, which is related with the enthalpy for a constant pressure. In Table II the enthalpy difference (latent heat) is calculated, Ł = Δh vl = h v - h l , where h = U + PV. Recall that U, P and V are in reduce units, therefore, h is also given in reduce units (h = h/ϵ).
Table II Latent heat (Ł) for the different temperatures and pore geometries.
| T | bulk | slit | sphere 2 | cylinder |
|---|---|---|---|---|
| 0.5 | 598 | |||
| 0.7 | 475 | 631 | 1745 | |
| 0.8 | 365 | |||
| 0.9 | 1232 | 314 | 279 | 1660 |
| 1.0 | 585 | 287 | 99 | 848 |
| 1.1 | 423 | 132 | 173 | |
| 1.2 | 293 |
In Fig. 4, the latent heat divided by P v ΔV is plotted with the temperature parameter T =T c , P v is the pressure in the gas and ΔV is the difference in between the gas and liquid volumes. This figure can be compared with previous works where they study thermodynamic properties of a van der Waals fluid [30] where we can see a similar behaviour. As we expected the latent heat becomes smaller as the temperature increases, i.e., it approaches to the critical value, since there is no phase transition at high temperatures. From the Fig. 4, we observe that the fluid in the sphere presents lower latent heats compared with the other geometries. The slit and the cylinder have similar values of the latent heat at low temperatures until their temperatures approach the critical values, then the latent heat drops more rapidly for the cylinder than for the slit-like pore. In fact the slit-like pore does not change significantly the latent heat for the simulated temperatures.
3.4. Fluid structure
It is also possible analyzed the vapour-liquid transition by looking at the fluid structure given in the density profiles (Figs. 5-7). The density profiles for the different geometries have the following expressions, for the slit-like pore,
where dN is the number of particles in a bin of thickness dZ and A(= XY ) is the area of the plates.
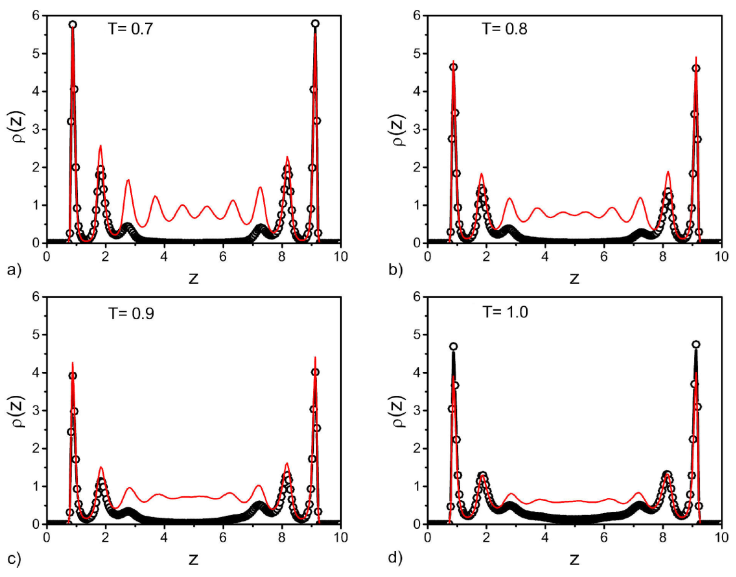
Figure 5 Density profiles for the slit-like pore, before (black circles) and after (red lines) the vapour-liquid transition. Plots are given for different temperatures as indicated in each panel.
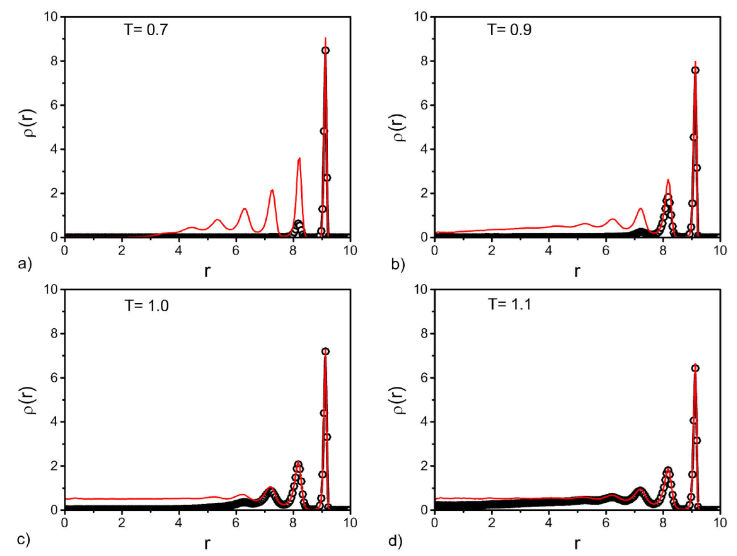
Figure 6 Density profiles for the cylinder pore, before (black circles) and after (red lines) the vapour-liquid transition. Plots are given for different temperatures indicated in each panel.
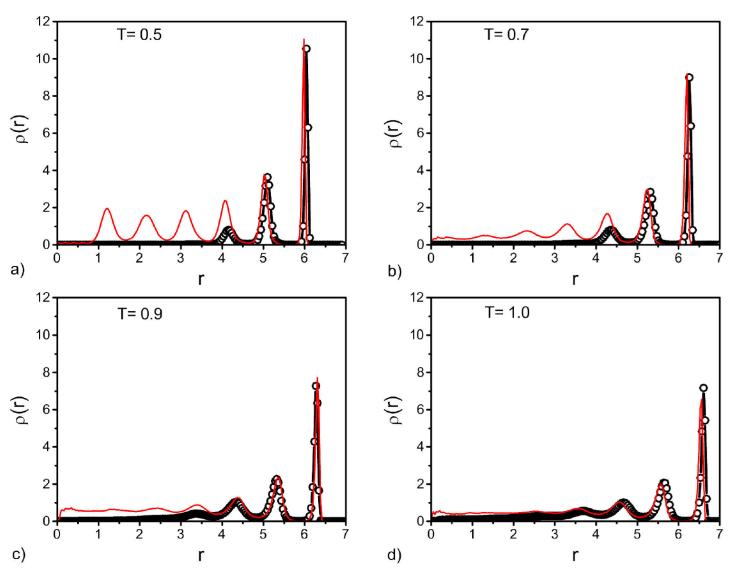
Figure 7 Density profiles for the sphere pore, before (black circles) and after (red lines) the vapour-liquid transition. Plots are given for different temperatures indicated in each panel.
For the cylinder,
where r is the radius and L is the length of the cylinder, respectively. dN is the number of particles in a cylinder shell of thickness dr.
For the sphere,
where r is the radius of the sphere and dN is the number of particles in a spherical shell of thickness dr.
For the slit-like pore, as expected and also shown by several authors, symmetrical layers are developed close to the walls (Fig. 5). Before the transition we observe gas density in the middle of the pore and after the transition pressure the density in the middle looks nearly homogeneous with liquid values for the reduced temperatures T = 0.9 and 1.0. For the low temperatures, T = 0.7 and T = 0.8, the overall densities increase, the first peaks are higher and the liquid becomes more structured indicated by the oscillations in the density profiles, see Fig. 5a). Similar profiles are obtained for the other geometries, sphere and cylinder, however, in these cases the profiles are not symmetric, since they are measure from the cylinder axis (Fig. 6) or center of the sphere (Fig. 7).
In the case of the cylinder is possible to see a liquid region close the axis of the cylinder (i.e., in the center of the pore) after the vapor-liquid transition (red lines in Fig. 6) for the reduced temperatures T = 0.9, 1.0 and 1.1. It is also noted that the first peak, close to the wall, becomes higher as the temperature decrease. For the lowest temperature, T = 0.7, the fluid shows the formation of more peaks (three well structured) indicating that the fluid presents a layer structure as the vapour-liquid transition is reached. Interesting in this case, is also the presence of a gas region in the middle of the pore suggested by the fluid density profile.
For the sphere pore we can also see two well structured layers close to the wall before and after the vapour-liquid transition indicated by the density profiles (Fig. 7). Before the transition a gas region is observed in the middle of the sphere (black circles) and after (red lines) there is an homogeneous liquid in the centre of the sphere for the reduced temperatures, T = 0.9 and 1.0. However, for the intermediate temperature the fluid becomes more structured, T = 0.7 [Fig. 7b)], and for the lowest temperature, T = 0.5, there is a structured liquid in all the pore due to the fluid-wall interaction. Since in this case the radius of the sphere shrinks, to adjust the input pressure, the confinement of this fluid is greater compared with the cylinder and the slit-like pores, i.e., more structured layers are formed.
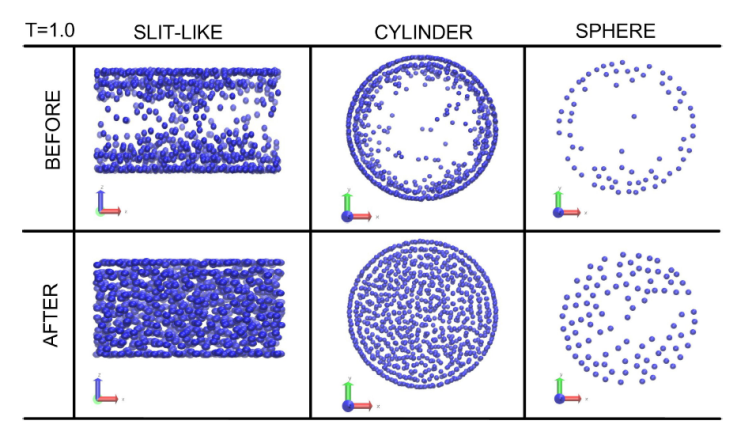
Typical structures of the fluids in the pores before and after the vapour-liquid transitions are shown in Fig. 8 at tem perature T = 1.0 for all the geometries. In the slit-like pore is observed a gas region in the middle of the pore before the transition and how the pore is filled once the transition occurs. More over, in both cases is possible to depict well adsorbed layers close to the walls. For the cylinder pore, the images are shown along the projection in the cross section of the area, the fluid particles are mainly attached to the cylinder surface until the transition pressure is reached and condensation occurs, the fluid fills the pore space with two well structured layers next to the wall in agreement with the density profiles. In the case of the sphere, the picture is taken from a cross section in the region 0 < z < 1. it is noted the presence of particles close to the wall with a well defined structure before and after the phase transition however, before the transition there is a gas in the middle of the pore and liquid after, as clearly shown in the pictures.
4. Conclusions
In the present work we studied the behaviour of a confined fluid, using a simple Lennard Jones model, inside different geometries, spherical, cylindrical and slit-like pores. Several isotherms were simulated and the vapor-liquid transition was estimated by a discontinuous jump in the fluid density where the fluid structures changed as the density profiles shown. The phase diagram of all the systems were calculated and we observed that the VLE become narrow for all geometries, the critical temperature is reduced, and in general the vapour-liquid transition occurs at lower temperatures than that in the bulk. From the ρ-P isotherms it was constructed the T-ρ and the P - T phase diagrams and for the last one it was also possible to obtain the vapour-liquid coexistence lines from the critical temperatures of each system, i.e., an equation of the pressure as a function of the temperature was constructed which works for all the confined and bulk fluids. Finally, it was also possible to calculate the enthalpy for the vapour-liquid transitions which is related with the latent heat. This latent heat depends on the geometry and fluid-wall interaction.

