


 nueva página del texto (beta)
 Inglés (pdf)
 Artículo en XML
 Referencias del artículo
 Enviar artículo por email
 Citado por SciELO
  Similares en
SciELO
Similares en
SciELO 
 Permalink
1. Introduction
Coronavirus disease 2019, better known as COVID-19, is an infectious disease caused by the SARS-CoV-2 virus. This produces severe clinical pictures and serious cases such as pneumonia and acute respiratory distress syndrome. Infected patients have had post-COVID symptoms that worsen their physical and mental state; using diagnostic imaging (radiography, tomography, and ultrasound) findings such as bronchial dilations, pulmonary fibrosis and opacities have been found [1]. These conditions, considered sequelae of infection, are usually diagnosed three months after suffering from the disease and cause general symptoms, mainly affecting the brain, lungs, heart, and kidneys. This article proposes a CAD (Computer-Aided Diagnostic) of possible pulmonary sequelae by imaging, using artificial intelligence (AI), specifically, deep learning methods. The use of AI in the field of imaging has been an auxiliary tool in medical diagnosis, due to its precision and response time optimization. The proposed model makes use of artificial neural network architectures that can provide an automatic and objective estimation of post-COVID conditions, facilitating the expert’s interpretation [2].
AI in recent research has been an auxiliary tool in medical image processing, due to the success of artificial neural networks (deep learning). The interest in generating a reliable and accurate medical diagnosis in a short period can be achieved using this technique. The number of scientific contributions to the automatic detection of medical imaging pathologies has increased significantly in recent years [3,4].
Computational techniques have been developed through classification models that have allowed them to learn, but above all, to identify the characteristics of disease from digital processing.
Neural network algorithms are made up of layers of artificial neurons, connected to transmit signals. Networks contain three important structures: the input layer, intermediate layers, and the output layer; the intermediate layers are called hidden, and the more there are, the deeper the network [5]. Deep learning is constituted by these networks, followed by more complex learning methods, which generate optimal and accurate classification models. Deep learning classification scenarios are made up of a set of algorithms that attempt to model high-level abstractions in supervised and unsupervised learning. Supervised learning starts from a set of data previously labeled by an expert, while unsupervised learning is not labeled, so the model generates groups based on characteristics, shapes, or properties of the number of elements present in the set of data and groups them by class using statistical procedures [6].
In the present research, a supervised learning classification methodology is proposed through image processing using a deep neural network (50 intermediate layers) to identify post-COVID conditions. The dataset is classified into two categories: post-COVID findings and no post-COVID findings. Image processing is a technique used in various research articles, due to its application. It is used to extract regions of interest, with properties that can potentially be related to computer-aided medical diagnosis [7].
It is well known that there are several non-AI methods that obtain feature vectors from image and texture analysis. However, these methods do not obtain optimal and reliable values to generate an adequate classification, it is important to recognize that the models that are made for the medical area must have the slightest error and obtain competitive values [8, 9]. At this point, AI represents an emerging area through deep learning, since it uses artificial neural networks that improve classification scenarios and above all, generates a reliable model from these advanced algorithms that simulate the human brain, therefore that the present work shows evidence of the advantage of AI over classical methods [10].
2. Materials and methods
The data set used in the present investigation was provided by the Unidad Médica de Alta Especialidad No. 1 (High Specialty Medical Unit) of the Instituto Mexicano del Seguro Social (Mexican Institute of Social Security), T1-IMSS of León, Guanajuato, Mexico, from Mexican patients infected with COVID-19. The post-COVID diagnosis was made to 16 patients: approximately one year after their infections. The medical diagnosis was obtained from the imaging study, through computed tomography (CT) of the chest, which is more sensitive than conventional radiography, and for this reason, it was the main diagnostic method used in the pandemic [11]. In the tomography, two types of cases were observed: normal and abnormal. 57 CT images with postCOVID findings and 57 images without findings were obtained (symmetrical set). The most common findings were ground glass image, which can be translated into an acute inflammatory process and possibly represents immature fibrosis that can resolve or progress over time, and pulmonary fibrosis; mainly made up of findings such as architectural distortion, traction bronchiectasis, and cobblestone pattern. These conditions are usually undetectable on radiography, so tomography is more efficient. Axial CT slices of the patients were 0.5 mm, to detect these patterns. Figure 1 shows the two types of labels in the dataset.
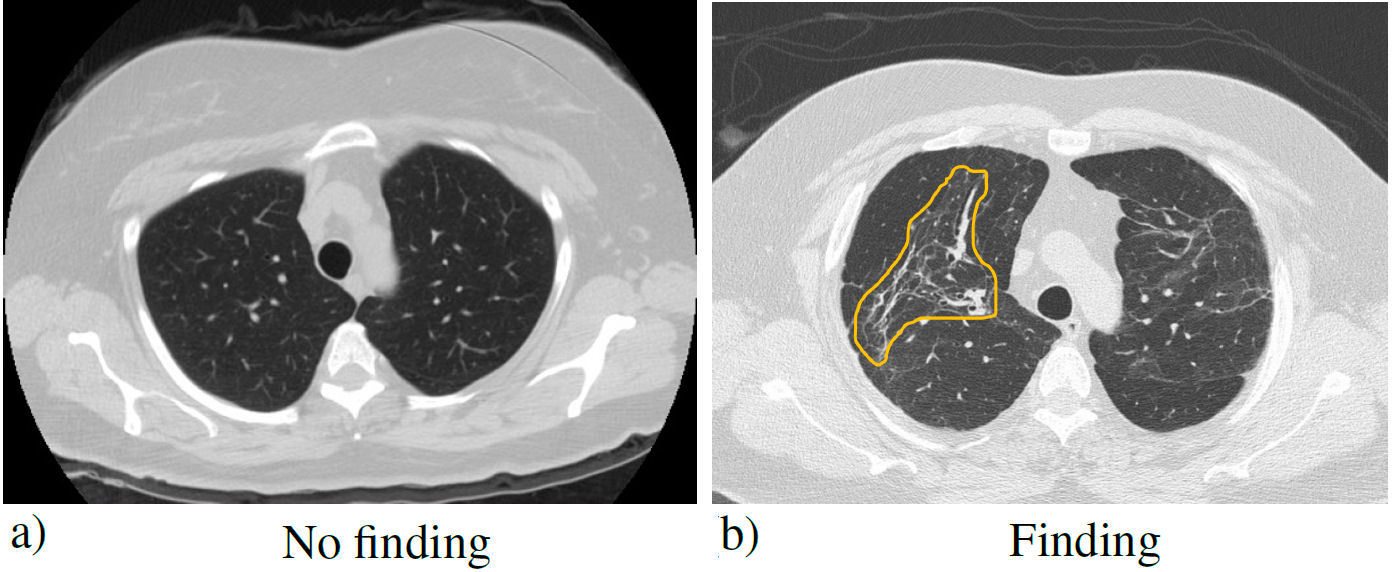
FIGURE 1 Simple chest tomography with the pulmonary window in the axial section, where a) no finding is observed and b) a typical pattern of pulmonary fibrosis (distortion of the pulmonary architecture) derived from COVID-19 (yellow outline).
The different conditions observed by CT are listed in Table I [12].
TABLE I Brief description of the patterns found in the post-COVID computed tomography scans.
| Concept | Description |
| Subsegmental | Partial collapse of a |
| atelectasis | part (segment) of the lung. |
| Ground/Frosted | Area of greatest pulmonary attenuation |
| glass pattern | within which the vascular structures can be visualized since they are not erased. |
| Pulmonary | It occurs when lung tissue is damaged, and |
| fibrosis | scarring occurs. This thickened, stiff tissue makes it harder to breathe and the blood doesn’t get enough oxygen. |
| Secondary | Airways are dilated by |
| Traction | parenchymal distortion because |
| Bronchiectasis | of pulmonary fibrosis. |
| Cobblestone | The reticular pattern often with the |
| pattern | appearance of interlobular septal thickening, superimposed on ground-glass opacities, simulating cobblestones. |
Next, the methodology based on deep learning is presented to classify the dataset of Mexican patients with and without post-COVID findings. The proposed method is based on the use of a convolutional neural network (CNN) to extract features from tomographic images.
3. Proposed model
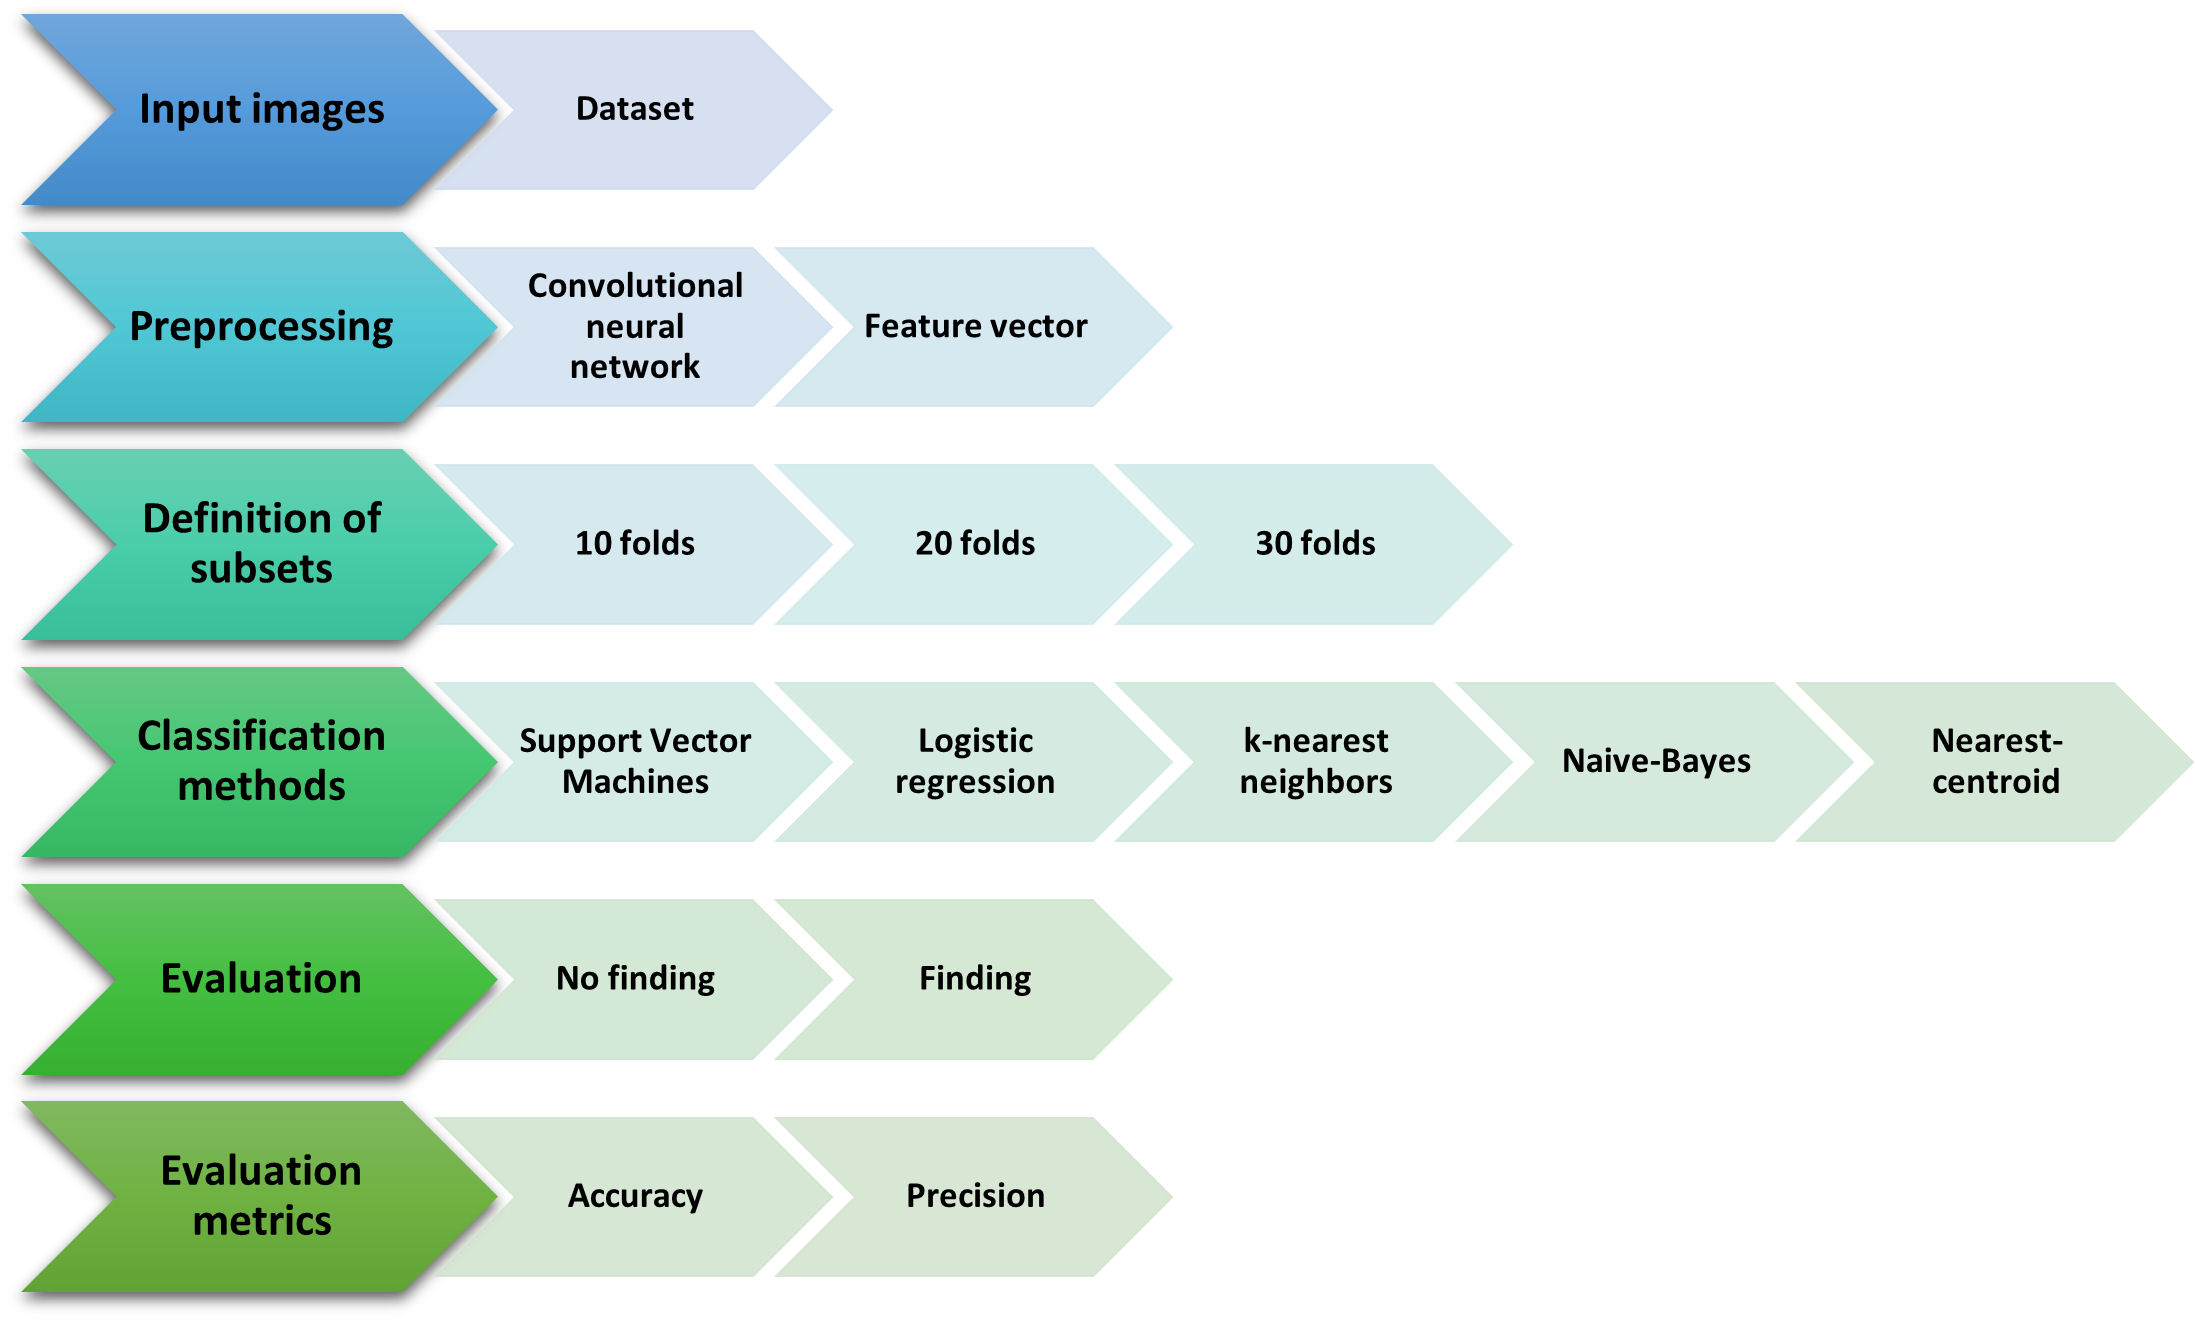
The model is based on the classification of the images of tomographic findings, in Fig. 2, the diagram of the methodology is detailed, with the data set of the Mexican patients. The best conditions are identified (scenario, classifiers, metrics, etc.) to carry out the model, with a high degree of reliability. It was developed in the open programming language Python.
The methodology consists of different stages; however, the preprocessing stage is of vital importance to be able to carry out the classification. In the same way, the first stage highlights the investigation, since the experiment was carried out based on the data set provided by the T1-IMSS of Mexican patients, so that, with the CNN, it will be possible to extract the characteristics of the post-COVID discovery images. In Fig. 3, the schematic diagram of the first and second stages is shown.
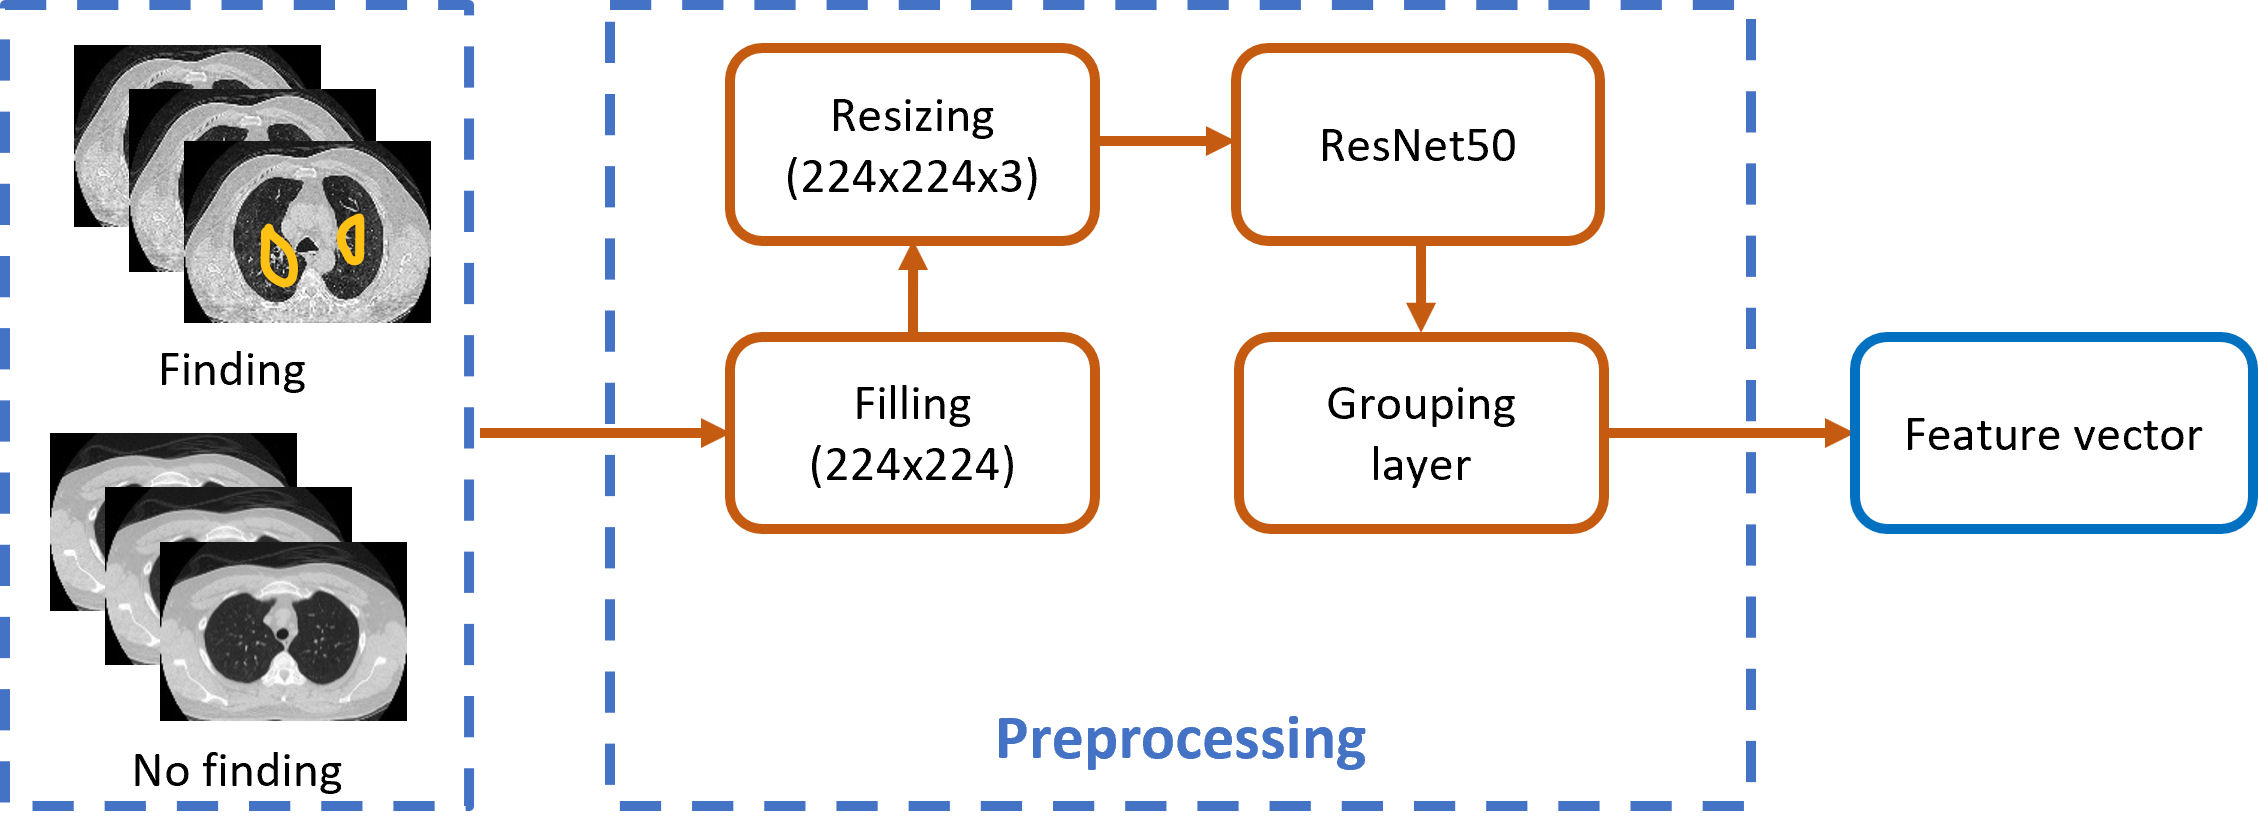
The residual neural network ResNet50, with 50 hidden layers, was used [13]. This artificial neural network is made up of three layers of artificial neurons: one input, fifty intermediate (hidden), and one output. It is based on residual learning to obtain a matrix that is formed from the feature vectors. Residual learning improves the reliability of neural architectures by subjecting them to performance tests with partial and random alterations to their connections that solves complex tasks and improves model accuracy. The four preprocessing processes in Fig. 3 are listed:
Filling: All input images are resized to 224×224 pixels, and zero is added to the perimeter of the original image until the desired dimensions are reached. The pixel values of each layer are rescaled in the range 0 to 255.
Resizing: Get the image to have three layers (RGB), giving a new matrix with dimensions of 224×224×3. For images that had only one layer, the same layer is replicated across all channels.
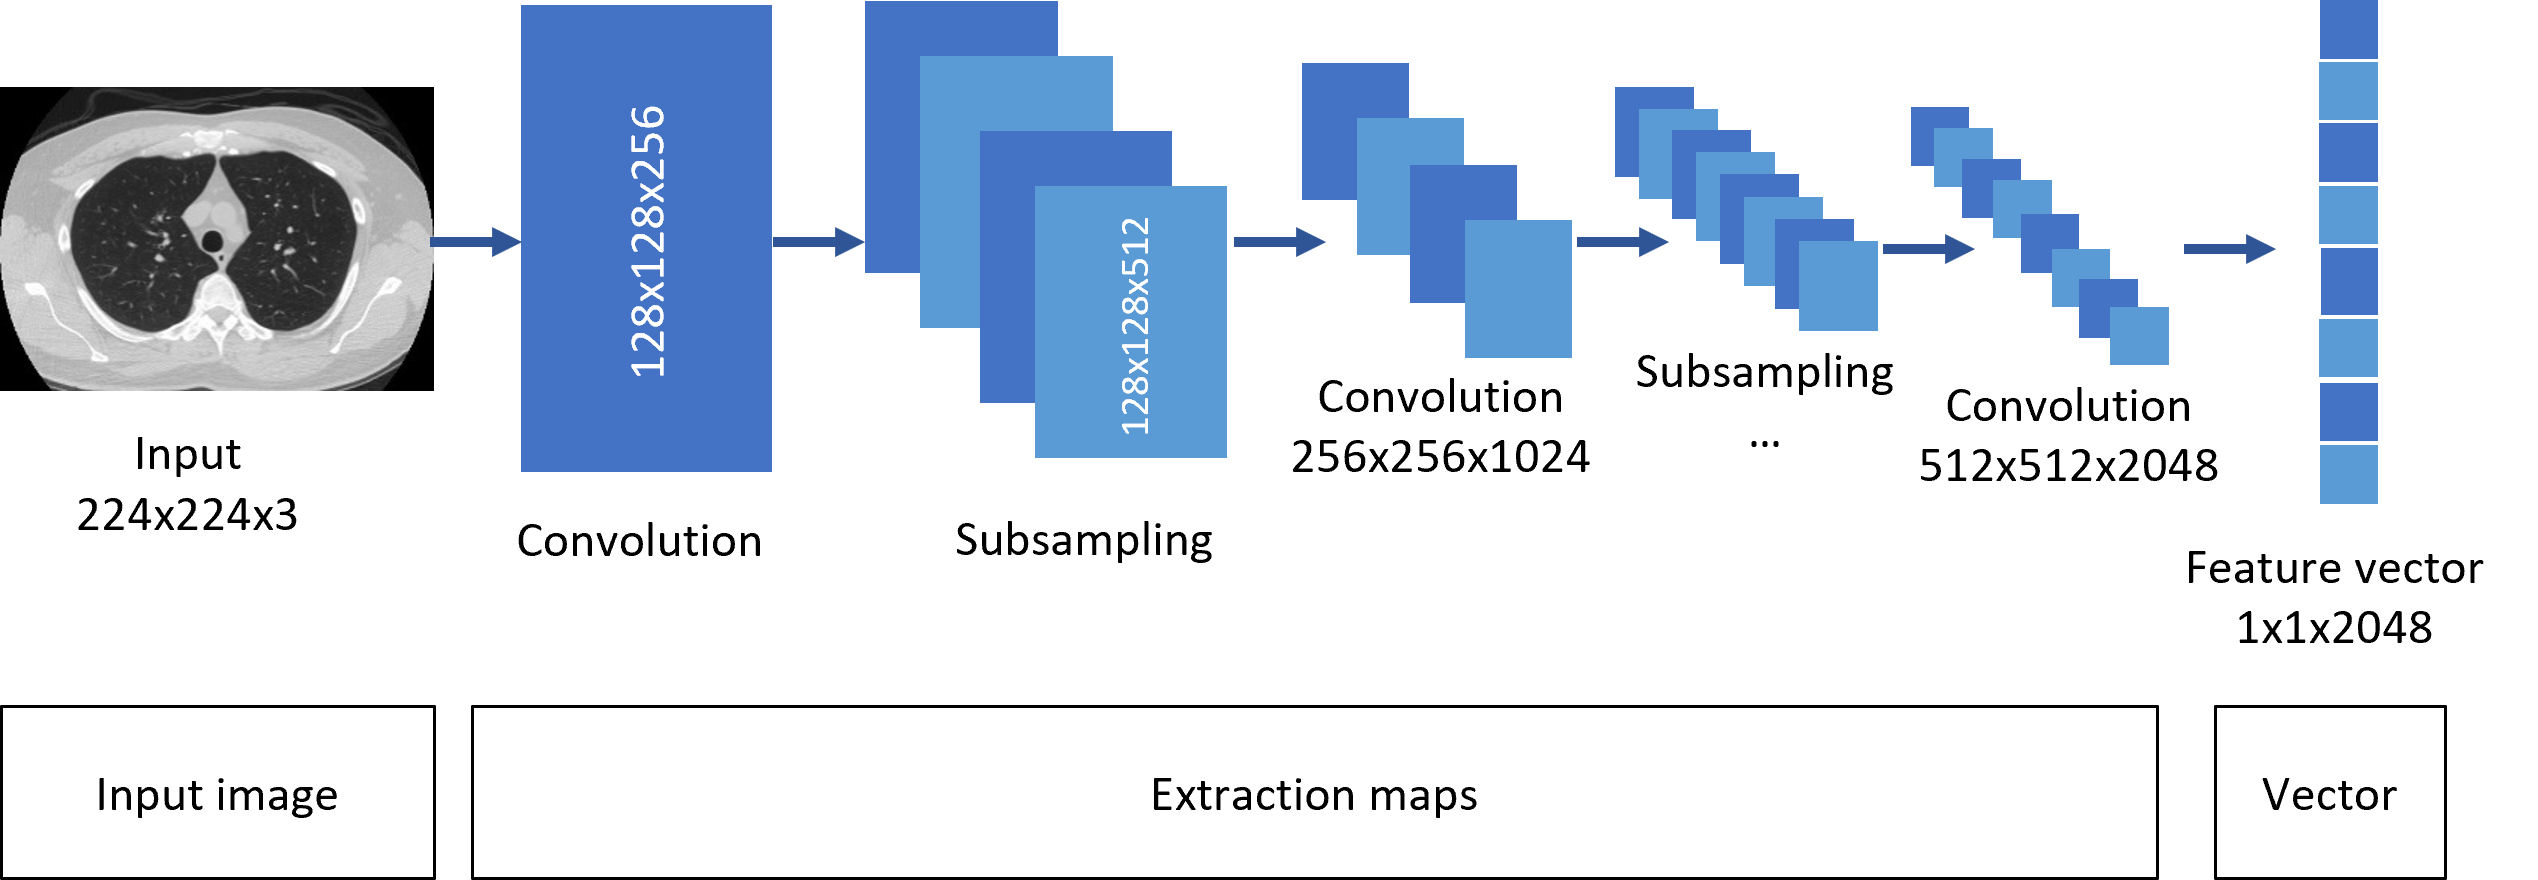
ResNet50: Once the image has gone through the above processes, they enter the ResNet50 network. The simple architecture of the network is shown in Fig. 4, where the convolutional evolution is observed. The input image is subjected to consecutive stages of convolution and subsampling, ending with the middle pooling layer.
Grouping layer: In this layer, the characteristics are extracted in the form of a vector of dimensions 1×1×2048. This vector is generated for each image in the dataset and contains the general image features extracted by the model, such as intensity, lightness, and saturation.
When obtaining the feature vector, the final stage is performed by machine learning techniques, in other words, classifier algorithms are used to perform the classification of the data set. It is important to mention that the ResNet50 neural network is used as an image feature extractor, in order to use the convolutional basis of this network to obtain the most important and outstanding features of the images, this is not achieved with machine learning, but deep learning through this type of artificial networks that extract the best features to be able to classify optimally. There are several reasons why the final classification task might not be performed by the same CNN that is used for feature extraction [14,15]:
Specialization: By having separate models for feature extraction and classification, each model can be optimized for its specific task. The feature extraction model can be designed to focus on finding the most relevant features in the input data, while the classification model can be designed to make the best use of those features to make a prediction.
Modularity: Having separate models for feature extraction and classification makes it easier to modify or replace one component without affecting the other. For example, if a new feature extraction technique is developed that provides better results, it can be integrated into the system without having to retrain the entire model.
Transfer learning: Pre-trained models for feature extraction can be used for multiple tasks with different classification models, allowing transfer of knowledge across tasks and speeding up the training process.
Computational efficiency: Large CNNs can be computationally expensive to train, especially when they have multiple layers and many parameters. By separating the feature extraction and classification tasks, the overall computational cost can be reduced.
In summary, while it is possible to perform both feature extraction and classification using a single CNN, there are several benefits to using separate models for each task. For this reason, an automatic classification model divided into three scenarios was used: preprocessing, feature extractor (CNN) and classification system.
4. Experiment setup
The proposed model was based on the cross-validation classification scenario [16]. The number of images with and without findings post-COVID was homogeneous and symmetric, with 57-57 tomographic images; 114 images were partitioned by following a cross-validation scheme. This type of classification is appropriate when there are not enough images in the dataset [17]. In Fig. 2, the cross-validation scenario with the automatic classification methods was illustrated.
The classification methods used are widely known in the state of the art, due to their success in binary classification, where the elements of a set are classified into two groups based on a classification rule [18]. Support Vector Machines (SVM) generate an optimal separation that maximizes separation and minimizes classification risk, and with it the error. Logistic regression (LR) predicts the probability of a categorical dependent variable being dichotomous, in other words, is classified into two categories. On the other hand, Nearest Neighbors (KNN) is based on discrete sample classification and finds similar data points by closeness, thereby predicting and estimating future values based on the closeness classification. Naive-Bayes (NB) owes its success to feature independence, which allows one to calculate the probability that a test example has certain feature values.
Finally, the centroid-based classifier (NC) considers the similarity with the centroid of each class and is obtained from the distances from the center; the centroid is the vector of the average frequencies of each term among the elements of a specific class. Three divisions were built to perform the validation. The divisions were 10, 20, and 30 folds. Evaluation data were obtained with the evaluation metrics: accuracy (A) and precision (P). These metrics describe the performance of the supervised model with the dataset [19]. They are based on the following four aspects [20]:
True positive (TP): when the actual class of the data set (finding) and the one predicted by the model coincide (finding).
True negative (TN): when the actual class of the dataset (no finding) and the one predicted by the model match (no finding).
False positive (FP): when the actual class of the dataset (no finding) and the one predicted by the model do not match (finding).
False negative (FN): when the actual class of the dataset (finding) and the one predicted by the model do not match (no finding).
Metrics are obtained as follows [21]:
Accuracy is defined as the number of correct predictions made as a proportion of all predictions. While precision indicates how often the values are correct, in other words, the number of true positives that are positive compared to the total number of predicted positive values.
5. Results
Figure 5 shows the most common findings from the dataset of Mexican patients.
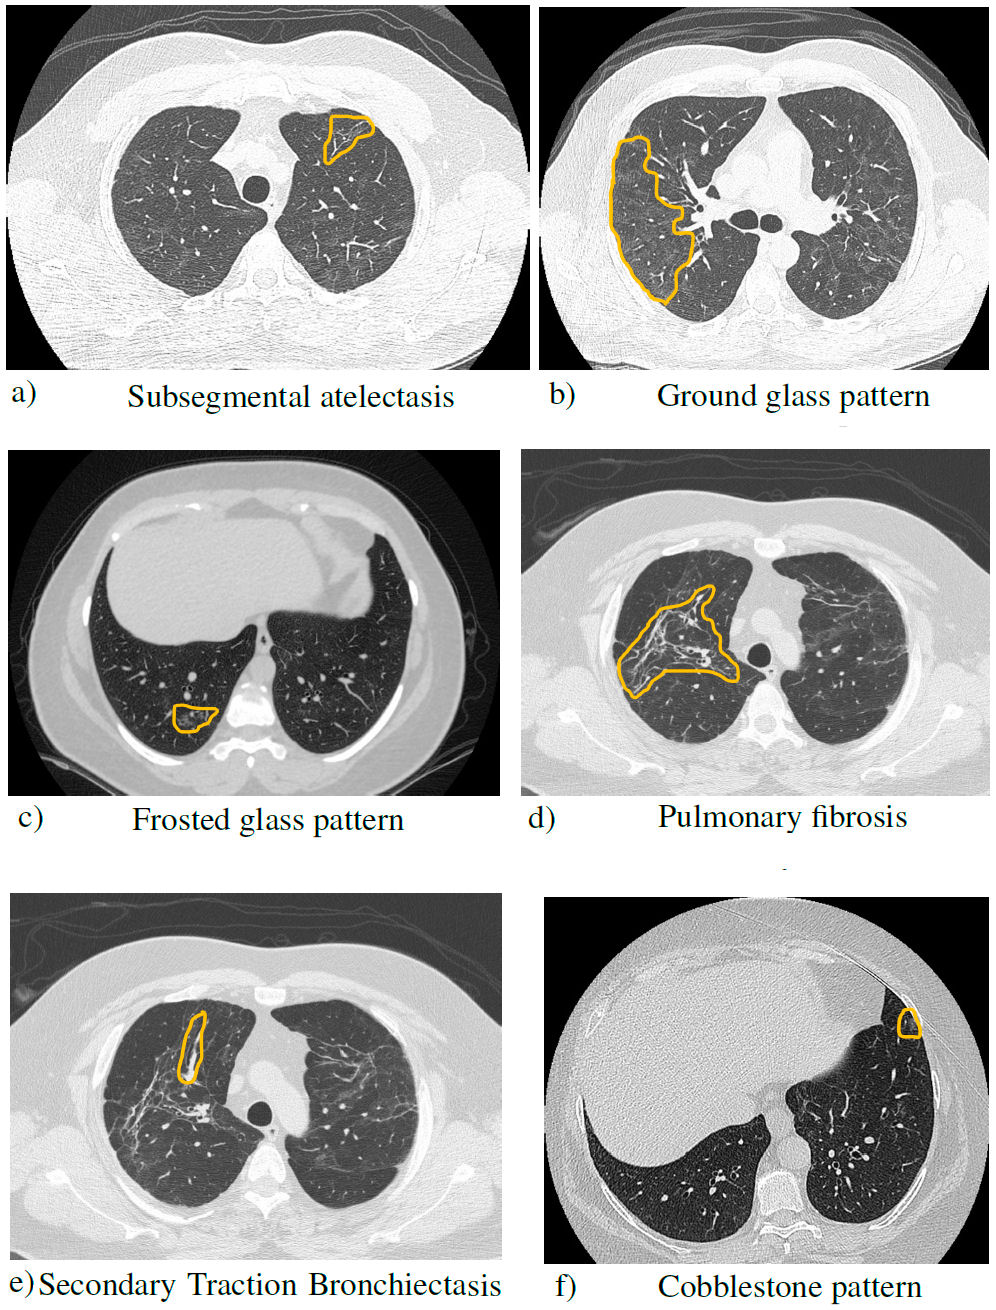
FIGURE 5 Simple chest tomography with lung window in axial section, where the findings of the pathologies are observed.
The cross-validation classification scenario uses four methods of classifier algorithms as the learning method. As mentioned, the data set was divided into three experiments: 10 folds, 20 folds, and 30 folds. The dataset was randomly split at the above splits K = 10,20,30. By randomly dividing into K parts, K −1 parts are used for model fitting and the remaining part for performance evaluation. This was repeated K times to obtain K models and evaluation results. After obtaining the evaluations, the average was calculated. Subsequently, the model was retrained for the following corresponding divisions. The performance E of the model is evaluated as [22]:
Figure 6 shows the K- folds cross-validation scheme, with K =10,20,30 and a single classifier.
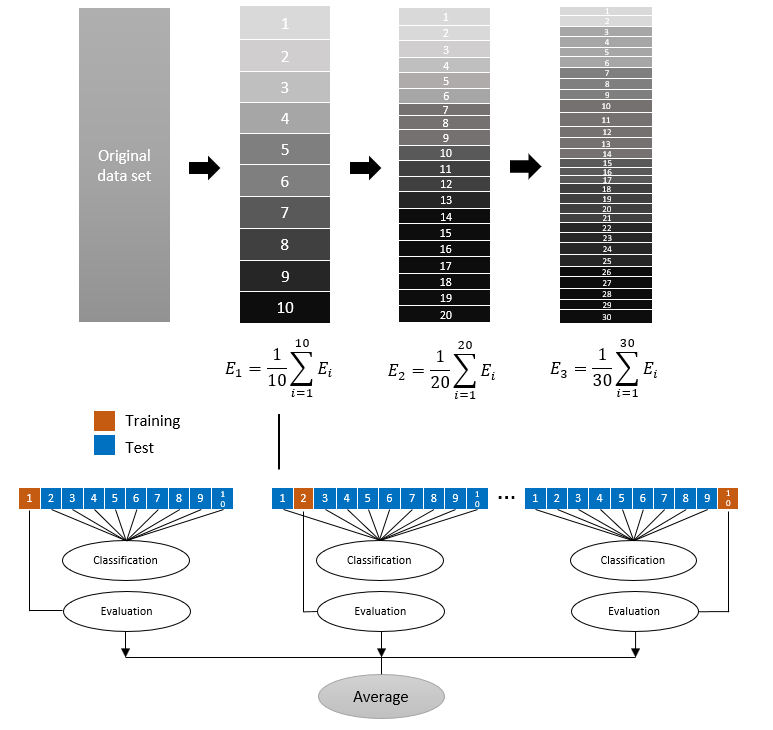
In Fig. 6, the divisions of the folds of the data set are illustrated, as well as the process for 10 divisions. This same process happens with 20 and 30 divisions, to obtain the performance E. Cross-validation was used to compare the results of different predictive classification procedures, that is, the five learning models that allow us to classify the images. Table II shows the results of the different classification methods, where the procedures of the divisions and the evaluation metrics that allow for determining which classifier is the most accurate are compared.
TABLE II Cross validation classification scenario results.
| Folds | 10 | 20 | 30 | |||
| Classifier | A | P | A | P | A | P |
| SVM | 0.92±0.05 | 0.94±0.05 | 0.93±0.11 | 0.95±0.07 | 0.93±0.13 | 0.94±0.13 |
| LR | 0.90±0.07 | 0.92±0.06 | 0.90±0.11 | 0.92±0.08 | 0.89±0.17 | 0.90±0.20 |
| KNN | 0.95±0.06 | 0.95±0.04 | 0.95±0.08 | 0.96±0.06 | 0.95±0.10 | 0.97±0.07 |
| NB | 0.93±0.07 | 0.94±0.05 | 0.93±0.11 | 0.96±0.07 | 0.93±0.13 | 0.94±0.14 |
| NC | 0.92±0.07 | 0.94±0.05 | 0.93±0.11 | 0.95±0.07 | 0.93±0.13 | 0.94±0.13 |
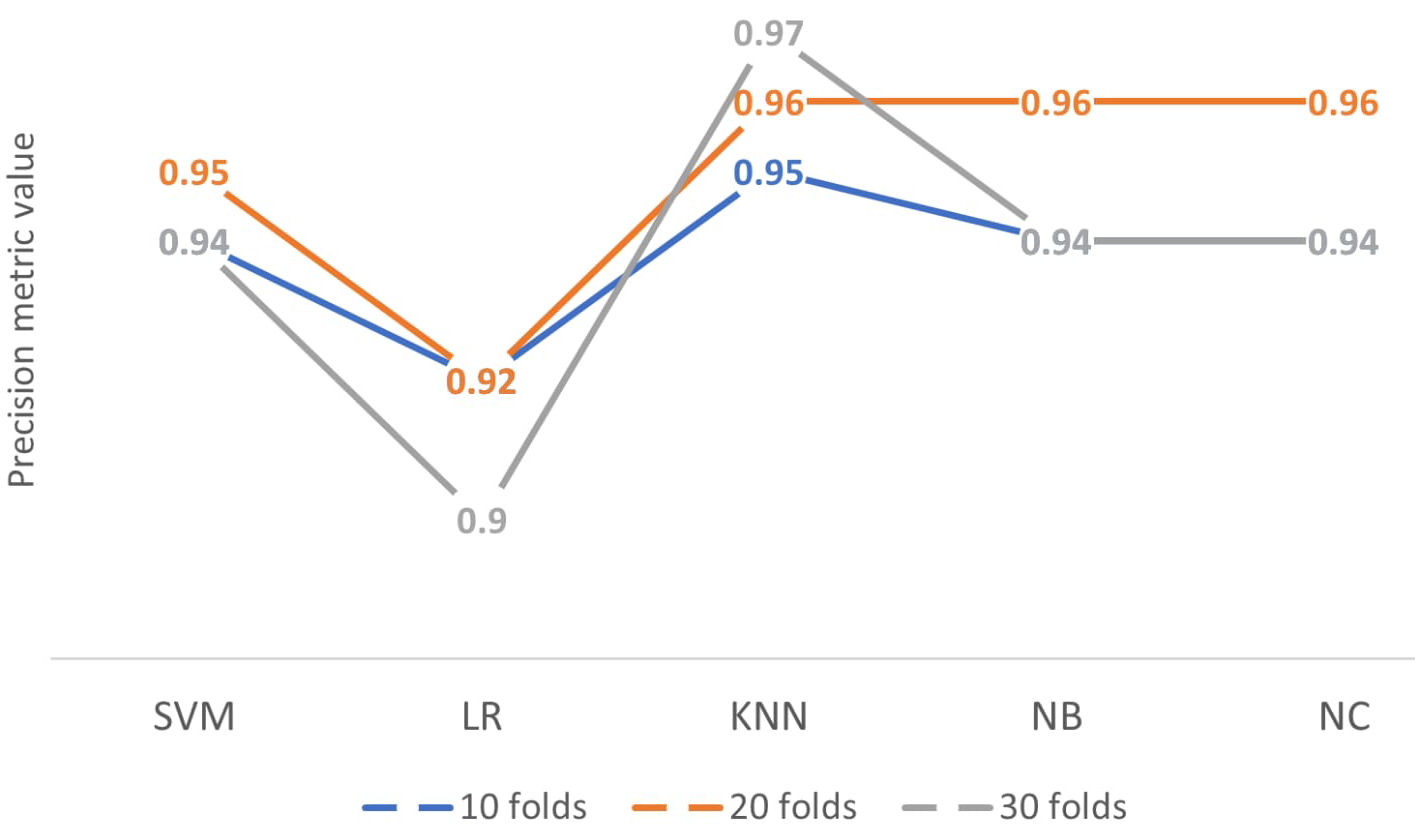
As can be seen, the KNN classifier, nearest neighbors, obtains the highest values in the precision metric, which increases as the fold increase [23]. This indicates that the classification percentage in 10 divisions is 95%, in 20 divisions it is 96% and finally 30 divisions it would be 97%. The precision gives us the quality of the classification scenario and tells us the percentage of the positive class predicted by the model and the actual positive class of the dataset. The classifier with the best values tends to work optimally in small data sets, as is the case with the present set, with 114 tomography images with and without post-COVID findings. Similarly, accuracy is a good measure when the classes of the variables in the data set are balanced, that is, homogeneous. The set has 57−57 for the types of the present case, so in each division, it gives us a percentage of 95% of the quality of the KNN classifier above the remaining learning methods. Figure 7 shows the learning methods with the different folds and the precision metric.
The proposed methodology tells us that, indeed, the cross-validation classification scenario with 10, 20, and 30 folds, as well as the KNN classifier and the reported metrics, represent an optimal automatic classification model for the dataset of Mexican patients with post-COVID tomographic findings. Through the ResNet50 network, the characteristic vectors of the tomographic images are extracted, which when combined with the methodology generates values that are competitive with the state of the art. As shown, this method allows us to extract the areas of interest from the images, in the present investigation focused on a binary classification, however, the model can be extended to classify multiple pathologies, as has been shown. Regions of interest (ROI) are being extracted as a part of the feature extraction process performed by the deep neural network. The input to the network is a CT slice and the network is designed to identify the most relevant features within the slice. These features are then combined and passed on to the final classification model, which uses them to make a prediction. The ROI extraction process typically involves identifying a specific region within the CT slice that is most relevant for the task at hand. For example, in medical imaging, the ROI might correspond to a specific organ or tissue that is of interest. The deep neural network is then trained to focus on this region and extract the most relevant features from it. In this way, the deep neural network acts as a feature extractor, not only transforming the input CT slice into a vector of features, but also highlighting the regions within the slice that are most relevant for the final classification task.
6. Conclusion
The efficacy of the method proposed in this article, based on the dataset of Mexican patients, demonstrates that using the nearest neighbor classifier, classification results of 97% precision are obtained given the binary labels: with the finding of lesions post-COVID lung lesions and no post-COVID finding. As the splits of the dataset increase, an increase in the accuracy classification percentage is obtained, thus demonstrating an increase in model performance, in addition to the fact that the accuracy indicates the quality of the classification scenario and the percentage of the positive class predicted by the model and the actual positive class of the dataset.
The ResNet50 convolutional neural network is an essential part of the methodology, since, from it, the characteristics are extracted through deep learning of the post-COVID findings in medical images, and thus be able to compare them with those that do not have lesion findings, through classifiers that are evaluated using metrics that provide us with the performance of the model.
The results obtained allow this article to report the classification of medical images of Mexican patients granted by UMAE T1-IMSS of León, Guanajuato Mexico. The viability of the values identified by the scenario and binary classifier in the quantitative analysis of the imaging study serves as a more accurate diagnosis, through the model that provides an automatic and objective estimation of the classification of the post-COVID findings, facilitating the expert interpretation during the COVID-19 pandemic. The classification method serves as an auxiliary tool in the medical diagnosis of post-COVID findings, due to the results obtained.

