


 nueva página del texto (beta)
 Inglés (pdf)
 Artículo en XML
 Referencias del artículo
 Enviar artículo por email
 Citado por SciELO
  Similares en
SciELO
Similares en
SciELO 
 Permalink
1. Introduction
Structural and vibrational studies on organic materials have attracted the attention of many researchers because it can give fundamental information about molecular conformation, normal mode behavior under different experimental conditions, intra- and intermolecular bonding, stability and phase transition as a function of temperature and pressure variations as well as understanding the nature of hydrogen bonding [1,2]. For example, variable pressure and temperature studies are interesting because they can change weak bonds, such as van der Waals interactions and hydrogen bonding, which are essential for the stability of the crystal structure. Also, when pressure is applied, the equilibrium of chemical reactions can be affected, leading to a phase transition [3-6]. Also, the vibrational and structural properties of the crystal under high pressure are important parameters in the pharmaceutical industry because they can alter the medical properties of drugs [7]. Moreover, it is possible to produce polymorphic compounds with different physical and chemical properties under pressure conditions, which facilitates the design of products for various medical applications [8,9].
Our main interest here is to study the vibrational properties of 4-(benzenesulfonyl)-morpholine, C10H13NO3S, as a function of pressure variation (0 to 3.2 GPa) in order to observe the phonon anharmonicity, stability and to show any phase transition that may alter the biological properties of the material. It is worth mentioning that C10H13NO3S is an interesting sulfonamide derivative showing antibacterial and antibiotic modulatory activities with potential application against drug resistant bacteria [10-14]. Therefore, this study is essential from both academic and industrial perspectives because it can reveal new information about the physical, chemical and biological properties of this substance. Finally, normal mode assignment is also given to help interpret the changes in this material by varying thermodynamic parameters.
2. Experimental procedures
2.1. Synthesis
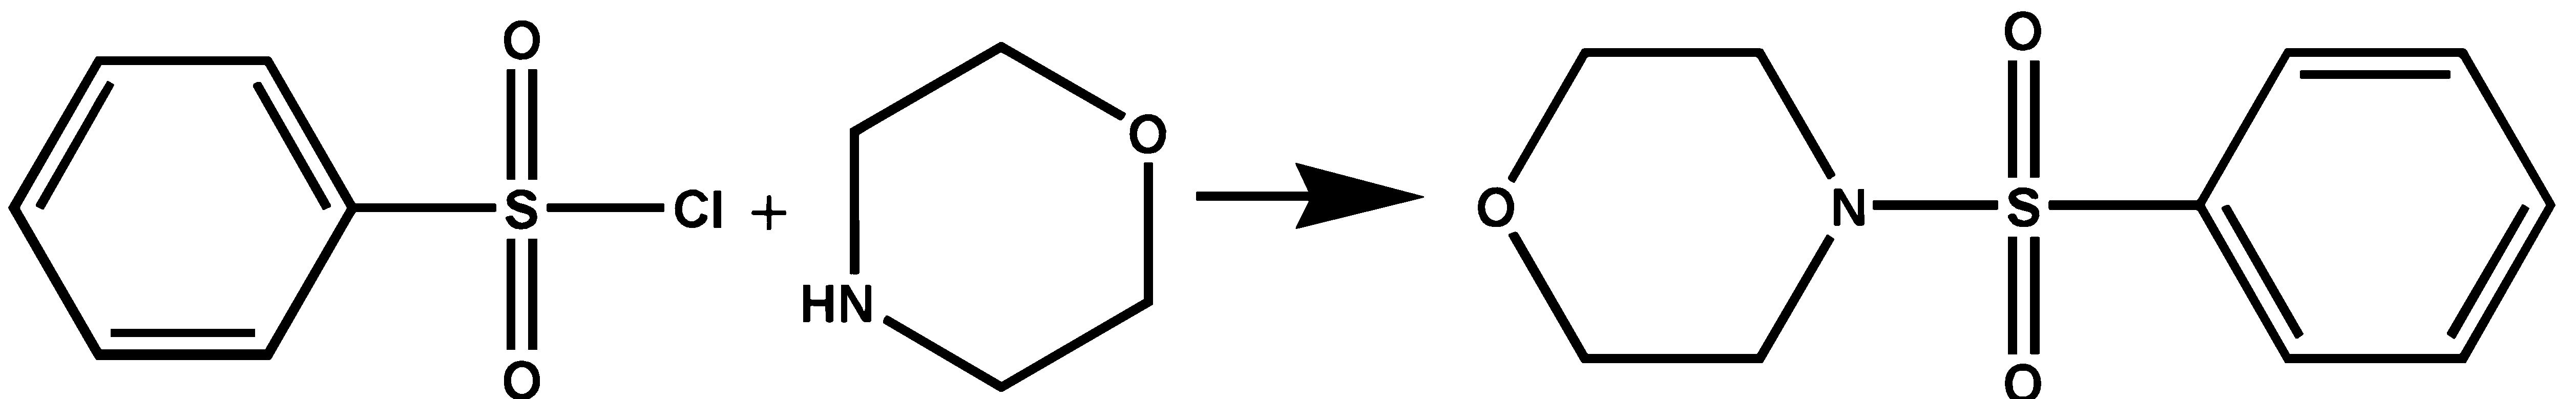
The synthesis of the sulfonamide followed the routine well defined in the literature [15]. The precursor benzenesulfonyl chloride and morpholine were purchased commercially from Sigma-Aldrich. The precursors were used without further purification. The title compound was prepared in a methanolic mixture of pyridine, benzenesulfonyl chloride and morpholine at low temperature (∼0◦C) with stirring for two hours. The material formed in this way was filtered and washed with a methanolic solution and then dried. The resulting material was recrystallized by heating the methanolic solution. The crystals were formed by slow evaporation of the solvent at room temperature. The synthesis can be described by the scheme shown in Fig. 1.
2.2. Experimental measurements
The FTIR spectrum was recorded on a Variant-660 spectrometer using the KBr disk method. Crystals were prepared in DMSO-d6 solutions. Raman spectra were recorded on backscattering geometry using Jobin-Yvon T6400 microRaman system coupled to Olympus microscope at 514 nm. High pressure Raman studies were performed on standard diamond anvil cell (DAC) load with mineral oil Nujol as pressure transmitting medium. The pressures in the DAC were determined by using the pressure shift in ruby (Al2O3:Cr3+) luminescence lines.
3. Theoretical calculations
The calculated Raman spectrum is compared with experimental spectra to determine the accuracy of the calculations and to gain insight into molecular structure and interactions. By using DFT methods, we can obtain a deeper understanding of the vibrational modes of organic molecules and how they are influenced by various factors, which can have important implications in fields such as drug design, catalysis, and materials science.
In DFT calculations, the potential energy surface of the molecule is calculated by solving the Schrödinger equation using an appropriate exchange-correlation functional and basis set. From this potential energy surface, vibrational frequencies and intensities can be calculated using harmonic and anharmonic vibrational analysis methods.
Harmonic vibrational analysis assumes that the molecule vibrates on a harmonic potential energy surface, which is a reasonable approximation for small vibrational amplitudes. This method can provide accurate predictions of vibrational frequencies, but it does not account for anharmonicity, which can lead to overestimation of vibrational frequencies in some cases.
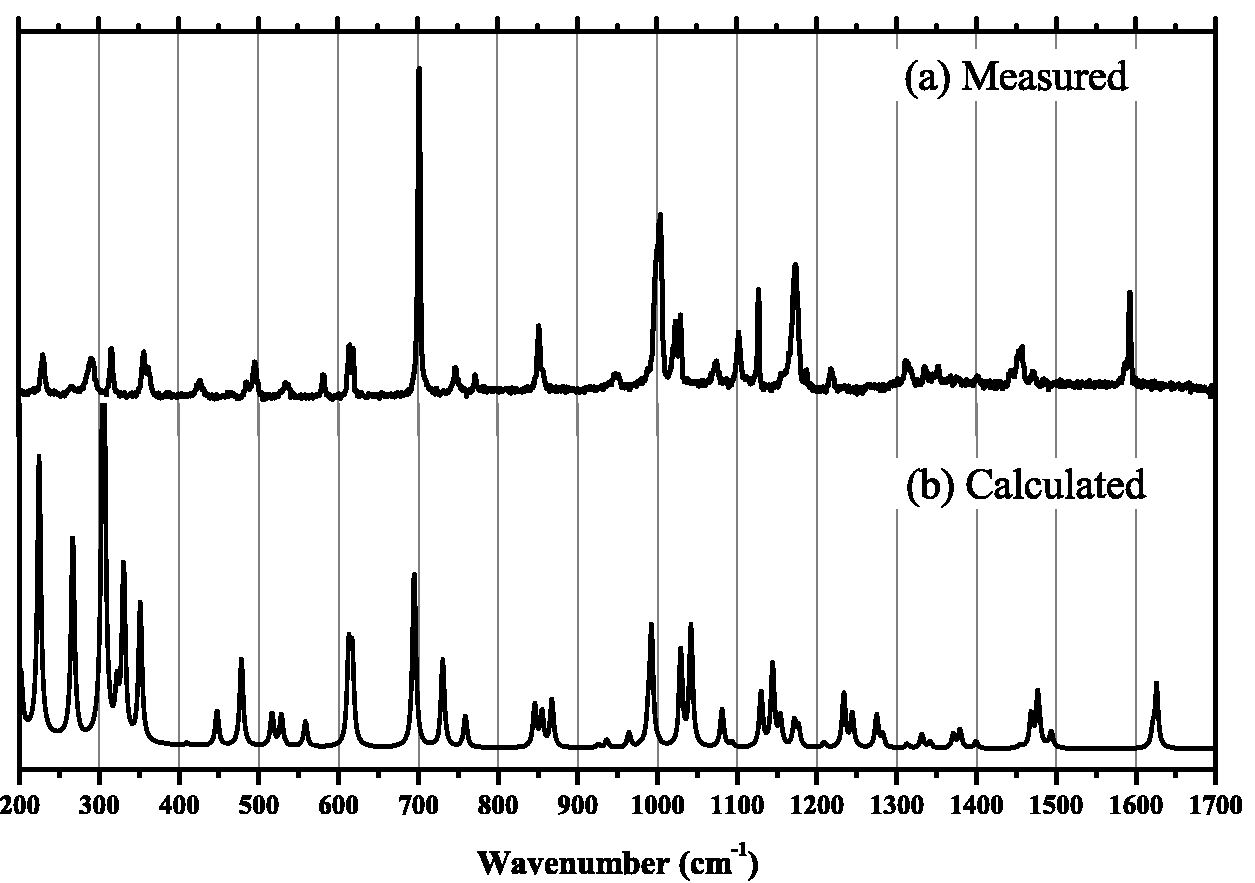
The calculated Raman spectrum of the free 4-(benzenesulfonyl)-morpholine molecule compared to the spectrum obtained by Raman scattering at room temperature is shown in Fig. 2. Here a scaling factor of 0.965 was used for the wavenumbers of the bands calculated by DFT to adjust for overestimated values [16]. The calculations were performed with the Gaussian 2009°R package. The functional chosen was B3LYP due to its lower computational cost and higher efficiency for organic molecules [17, 18]. The 6-31G(d,p) basis set used here is commonly used in a variety of calculations, including molecular energy calculations, reaction mechanisms, and molecular geometry optimization [18,19].
4. Results and discussion
4.1 Structural properties
Figure 3 illustrates the optimized chemical structure and atomic numbering scheme used to discuss the structural and vibrational properties of C10H13NO3S. This molecule consists of two rings, viz: 4-phenylsulfonyl (R1) and morpholine (R2). The presence of the 4-substituted benzene ring is identified in the 13C NMR spectrum (Fig. 4). These results are summarized in Table I.
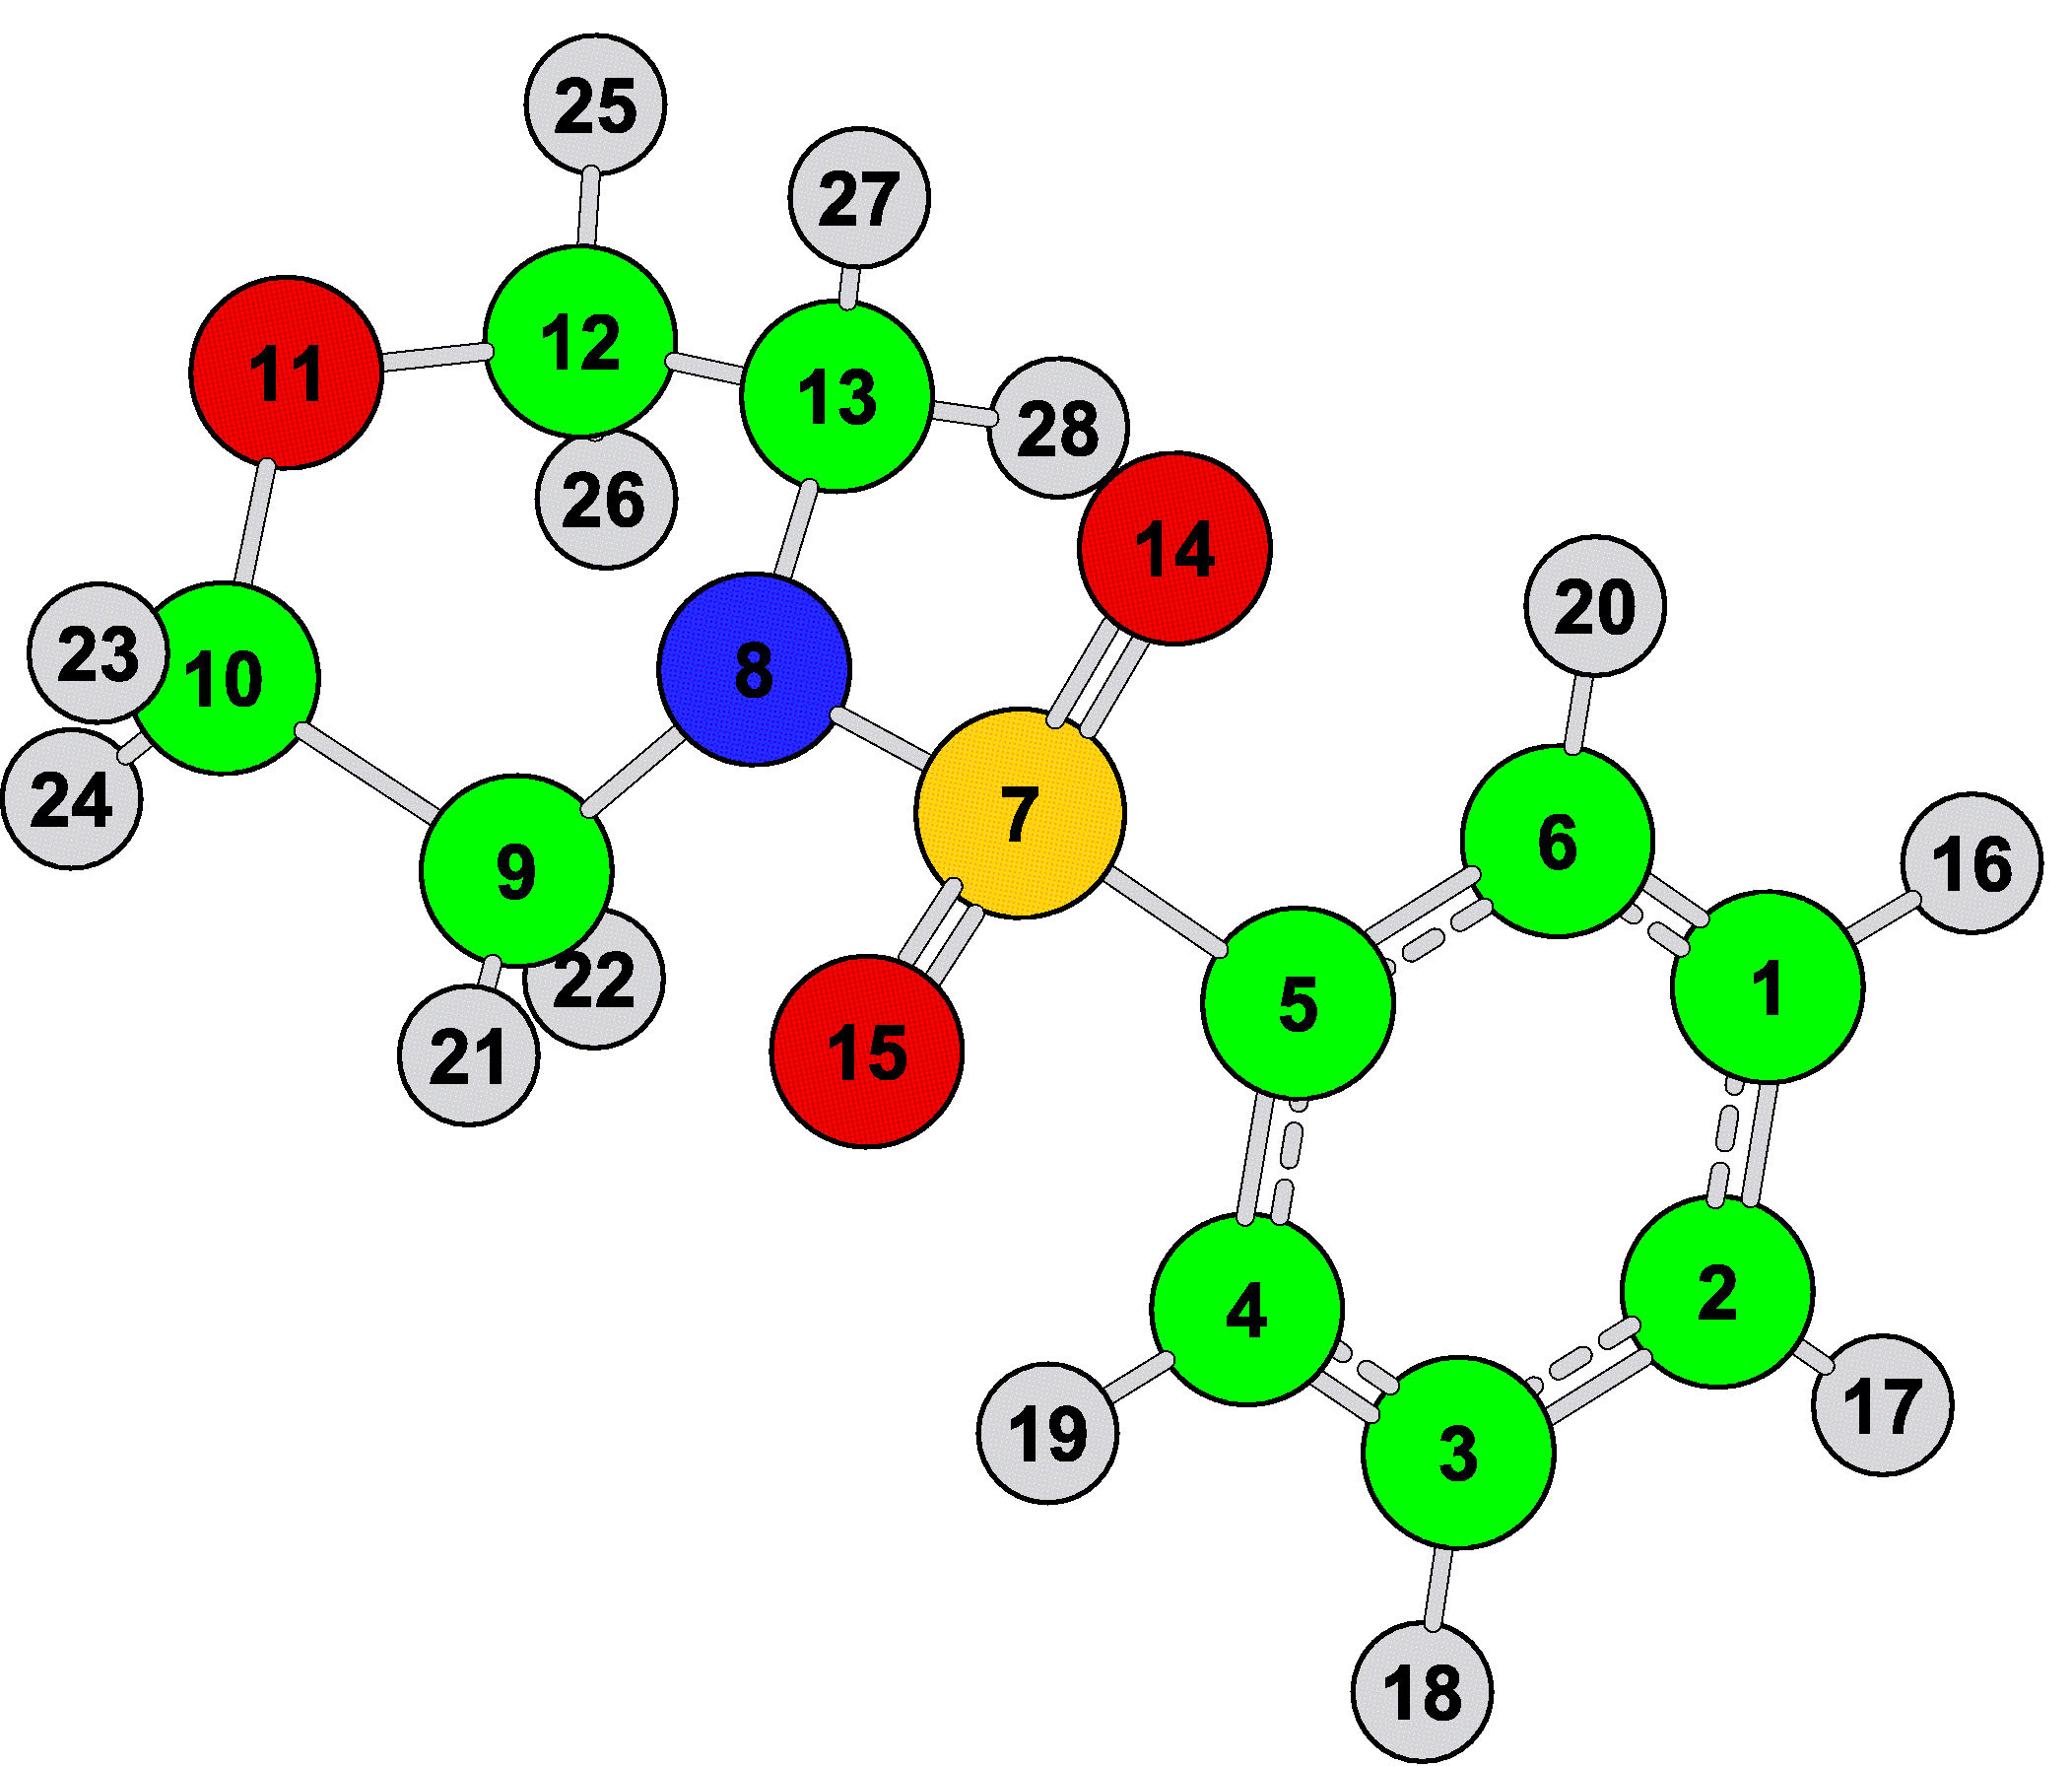
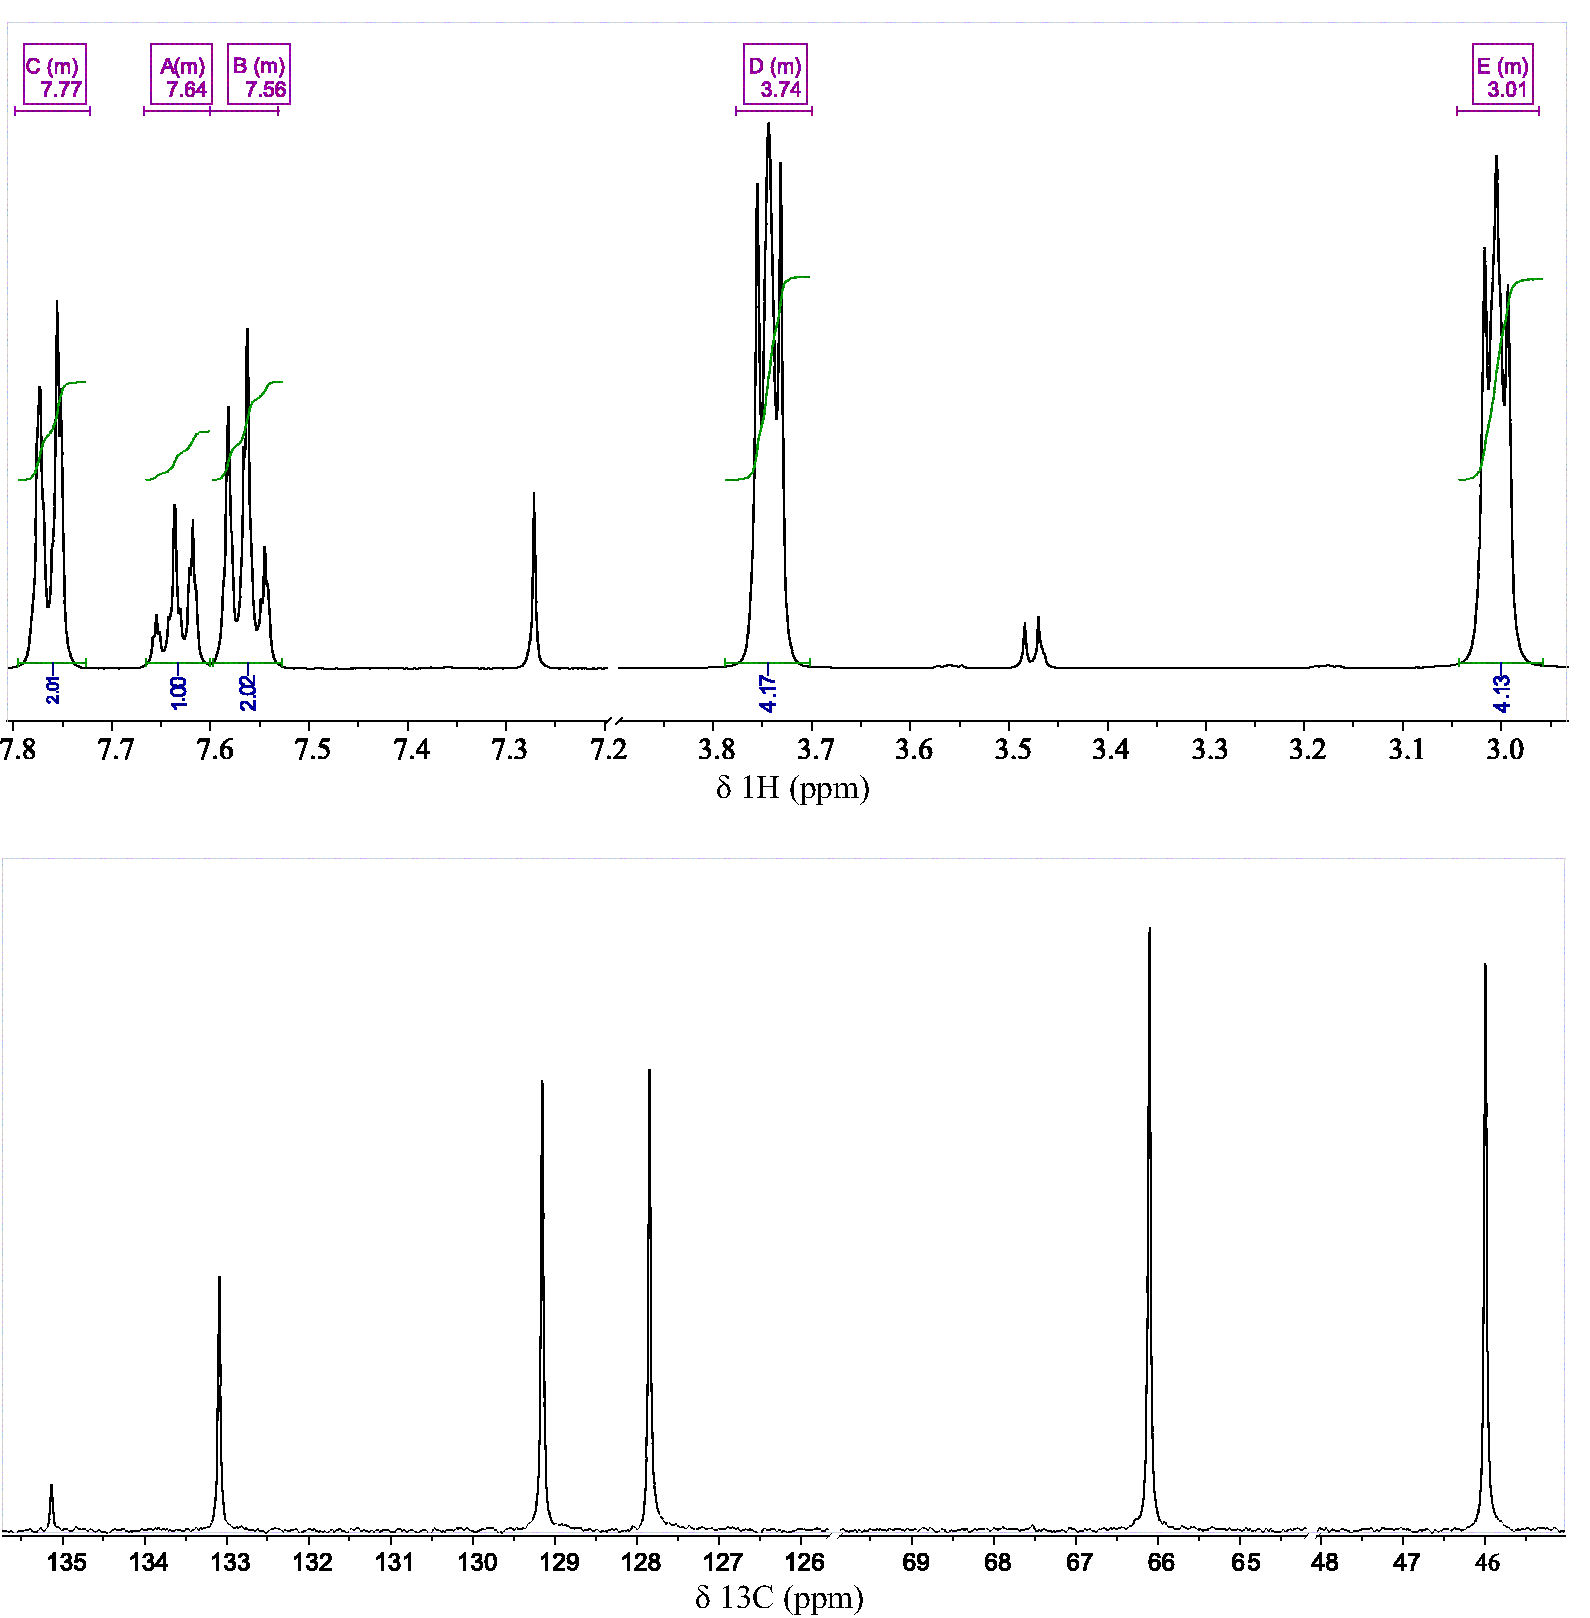
TABLE I Comparative between NMR δ 13C and δ 1 H in ppm of C10H13NO3S and C4H9NO.
| Chemical equivalence |
C10H13NO3S | C4H9NO [20] | ||
| 13C | 1H | 13C | 1H | |
| 1 | 135.13 | - | - | - |
| 2 | 127.85 | 7.79 - 7.73 | - | - |
| 3 | 129.15 | 7.59 -7.53 | - | - |
| 4 | 133.09 | 7.67 - 7.61 | - | - |
| 5 | 46 | 3.04 - 2.96 | 47.19 | 2.54-2.57 |
| 6 | 66.10 | 3.77 - 3.72 | 68.14 | 3.63-3.67 |
4.2. Vibrational properties
Here we will discuss the vibrational spectra at room conditions in order to assign the functional groups and describe the normal vibrational modes. Figure 5 shows the IR and Raman spectra of C10H13NO3S.
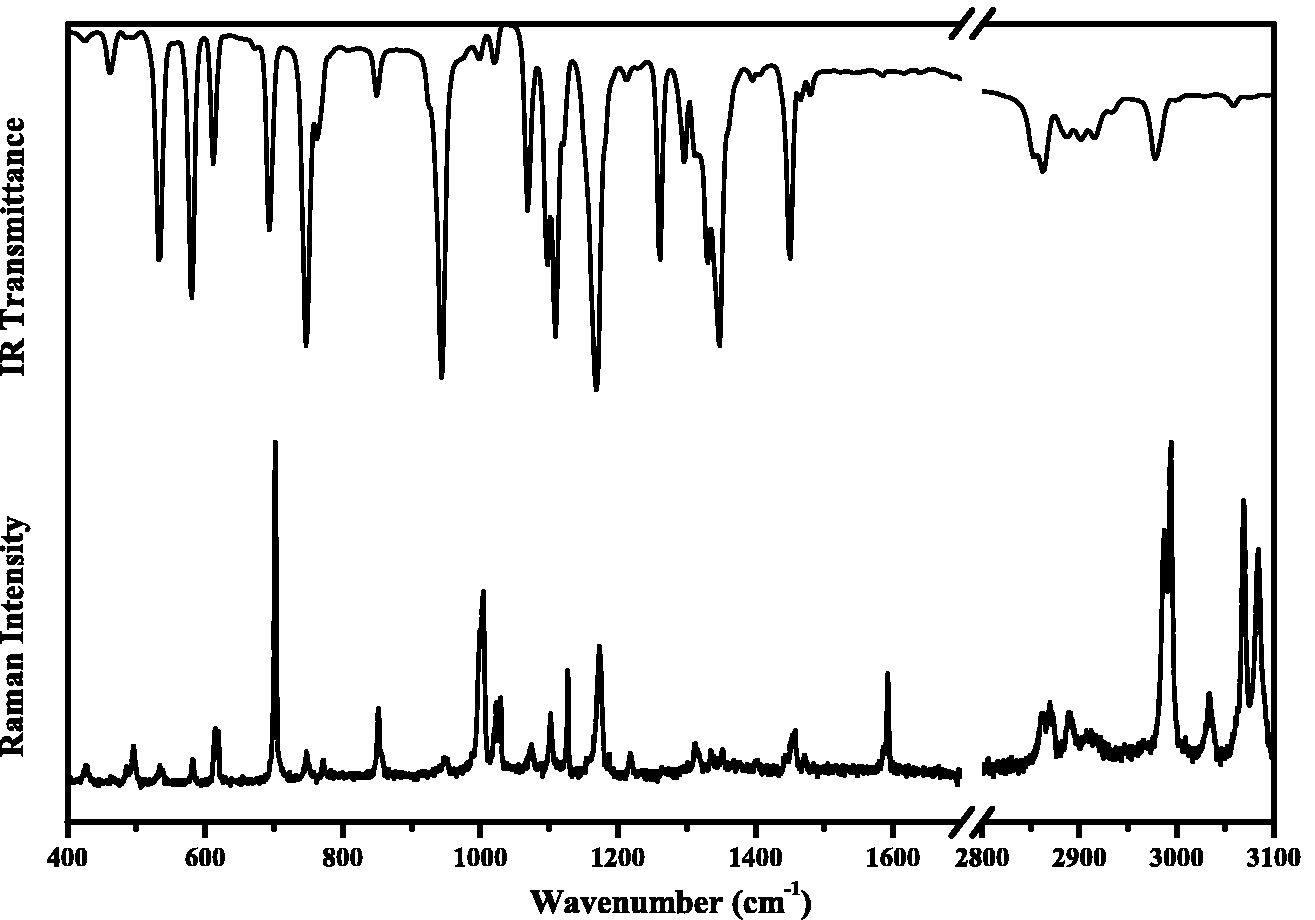
FIGURE 5 IR (above) and Raman spectra (below) of 4-(benzenesulfonyl)-morpholine at room temperature in range of 400 to 3100 cm−1.
In the FTIR spectrum, the bands between 3056 cm−1 and 2977 cm−1 are assigned as C-H stretching mode of the aromatic ring. On the other hand, the bands between 2915 and 2865 cm−1 are assigned to the stretching mode of CH2. At the same time, the stretching mode of CH2 is observed at 2862, 2870, 2889, 2910, 2987 and 2994 cm−1, while the stretching of =C-H is observed at 3033, 3069 and 3084 cm−1.
It is interesting to note that the four bands present in the IR spectrum of C10H13NO3S in the frequency range 20001800 cm−1 are generally associated with benzene monosubstitution pattern (radical-C6H5), which is in agreement with the NMR spectrum. The latter is not observed in the Raman spectrum. The bending/scissoring mode of CH2 is observed at 1480 and 1466 cm−1 as a very weak peak in the FTIR spectrum, and the same in the Raman spectrum at 1444, 1454, 1458 and 1471 cm−1.
The C=C stretching modes of aromatic compounds are usually observed in the frequency range of 1600-1450 cm−1. In the Raman spectrum, this vibrational mode is observed as a weak band at 1586 and 1592 cm−1, in contrast to the middle band in the FTIR spectrum, which is present at 1450 cm−1. Table II shows the assignments of the vibrational modes of 4-(benzenesulfonyl)-morpholine obtained from the PED calculated using the VEDA 4 program [21, 22], with contribution values greater than 10%. The aromatic nature of the compound can be demonstrated by the peaks located at 1471, 1458, 1454, 1444 cm−1 and at 1402, 1352 and 1335 cm−1, which are characteristic of C=C and C-C stretching, respectively [23]. Furthermore, the peaks located between 1300600 cm−1 are assigned to C-C stretching. On the other hand, the bands between 1400-1470 cm−1 are assigned to CH2 bending.
TABLE II Vibrational assignments of Raman and IR bands performed by PED calculations.
| Wavenumber (cm−1) | PED[%] | Wavenumber (cm−1) | PED[%] | ||||
| Calc. | IR | Raman | Calc. | IR | Raman | ||
| 3102 | 3084(vw) | 3085(s) | ν(CH)(2 17)[49] | 1000 | 1004(s) | τ(HCCC)(17 2 3 4)[21] | |
| 3060 | 3069(vw) | 3070(s) | ν(CH)(9 21)[95] | 991 | 1000(s) | δ(CCC)(4 3 2)[24] | |
| 3043 | 3056(vw) | ν(CH)(13 27)[68] | 935 | 943(s) | 948(vw) | τ(HCCC)(17 2 3 4)[28] | |
| 3030 | 3033(vw) | 3035(s) | ν(CH)(12 25)[70] | 853 | 852(w) | τ(HCCC)(16 1 6 5)[26] | |
| 1625 | 1592(s) | ν(CC)(4 3)[28] | 845 | 848(w) | ν(NC)(8 13)[16] | ||
| 1620 | 1586(w) | ν(CC)(5 6)[26] | 758 | 761(w) | 773(vw) | τ(HCCC)(18 3 4 5)[25] | |
| 1493 | 1480(vw) | δ(HCH)(22 9 21)[31] | 729 | 746(s) | 748(vw) | ν(SC)(7 5)[13] | |
| 1487 | 1471(vw) | δ(HCC)(16 1 6)[19] | 693 | 692(s) | 702(s) | δ(CCC)(3 2 1)[21] | |
| 1478 | 1466(vw) | δ(HCH)(28 13 27)[50] | 616 | 620(w) | δ(COC)(10 11 12)[16] | ||
| 1476 | 1458(vw) | δ(HCH)(24 10 23)[36] | 612 | 611(s) | 615(vw) | δ(CCC)(2 1 6)[38] | |
| 1467 | 1450(s) | 1444(vw) | δ(HCH)(22 9 21)[41] | 557 | 578(s) | 583(vw) | τout (ONOS)(15 8 14 7)[43] |
| 1398 | 1402(vw) | τ(HCOC)(24 10 11 12)[24] | 527 | 532(s) | 535(vw) | δ(COC)(10 11 12)[16] | |
| 1341 | 1348(s) | 1352(vw) | ν(SO)(7 14)[23] | 515 | 496(w) | δ(OCC)(11 12 13)[33] | |
| 1331 | 1334(vw) | ν(SO)(7 14)[19] | 477 | 486(vw) | τout (ONCS)(14 8 5 7)[39] | ||
| 1312 | 1328(s) | δ(HCC)(19 4 5)[17] | 446 | 460(w) | 465(vw) | δ(OSO)(15 7 14)[31] | |
| 1297 | 1297(w) | ν(CC)(5 6)[23] | 408 | 422(vw) | 427(vw) | τ(CCCC)(4 3 2 1)[34] | |
| 1281 | 1261(s) | δ(HCO)(25 12 11)[31] | 350 | 358(w) | δ(OSC)(14 7 5)[50] | ||
| 1208 | 1218(vw) | ν(NC)(8 9)[23] | 321 | 317(w) | τout (CSCN)(9 7 13 8)[20] | ||
| 1176 | 1188(vw) | ν(OC)(11 10)[33] | 304 | 291(w) | ν(SC)(7 5)[43] | ||
| 1170 | 1168(s) | 1173(s) | δ(HCC)(18 3 4)[21] | 265 | 267(vw) | ν(SN)(7 8)[13] | |
| 1143 | ν(SO)(7 14)[17] | 223 | 231(w) | δ(CNS)(13 8 7)[12] | |||
| 1129 | 1126(s) | ν(SO)(7 15)[10] | 200 | 193(s) | δ(SCC)(7 5 6)[33] | ||
| 1092 | 1108(s) | 1103(w) | δ(HCN)(27 13 8)[17] | 133 | 138(w) | τout(SCCC)(7 4 6 5)[15] | |
| 1080 | 1097(s) | ν(SO)(7 14)[15] | 76 | 74(vw) | τ(CNSC)(13 8 7 5)[24] | ||
| 1079 | 1068(s) | 1074(vw) | ν(CC)(1 6)[22] | 53 | 52(w) | τ(NSCC)(8 7 5 4)[47] | |
| 1041 | 1030(vw) | ν(CC)(12 13)[13] | 43 | 34(s) | τ(NSCC)(8 7 5 4)[36] | ||
| 1028 | 1023(w) | ν(CC)(3 2)[29] | 33 | 24(w) | τ(CCNS)(12 13 8 7)[52] | ||
The symmetric and asymmetric stretching modes of S=O are observed at 1348 and 1126 cm−1, respectively, as very intense bands in the FTIR spectrum corresponding to Raman bands at 1173 cm−1 and 702 cm−1. The out-plane motion of C-H mode is commonly expected in the spectral region 900-600 cm−1. Mixed modes of C-O and C-C are observed in the 1260-1000 cm-1 region. Stretching modes of C-N are observed at 1218 and 848 cm−1, and the C-S bond at 746 and 291 cm−1. The torsional modes are generally observed in the 400-250 cm−1 spectral region. The Raman lattice modes associated with the collective motion of the molecule within the unit cell are observed for the 4-(benzenesulfonyl)morpholine at 24, 34, 52, 74, 99, 138 and 193 cm−1.
4.2.1. Pressure effects
The Raman spectra obtained for different pressure values were deconvoluted into Lorentzian curves to obtain the intensity, width, and central parameters of each band in the spectral limits between 20 and 3145 cm−1. We divided the spectra into 4 ranges, and the variation of the wavenumber of each mode with pressure, ω(p), was evaluated. The centers of the bands mentioned here, when not referenced, are related to the ambient pressure.
In the range of 20-450 cm−1 (Fig. 6) it is possible to observe the discontinuity in dω/dp of the band at 52 cm−1 in the pressure range 0.5-1.2 GPa. It is worth mentioning the appearance of a new band around 115 cm−1 at 1.7 GPa, starting from 75 cm−1 at room pressure. As seen, this band is associated with the deformation of the N-S-C bond. In the 200-400 cm−1 range, the change in relative line intensity due to ordering with increasing pressure is also observed. The mode at 99 cm−1 at room pressure (not assigned in Table II) begins to merge into the band at 138 cm−1 for pressures above 2.5 GPa. The metal center (sulfur atom) in the 4(benzenesulfonyl)-morpholine molecule plays an important role in torsional vibrations (bands at 24 to 138 cm−1).
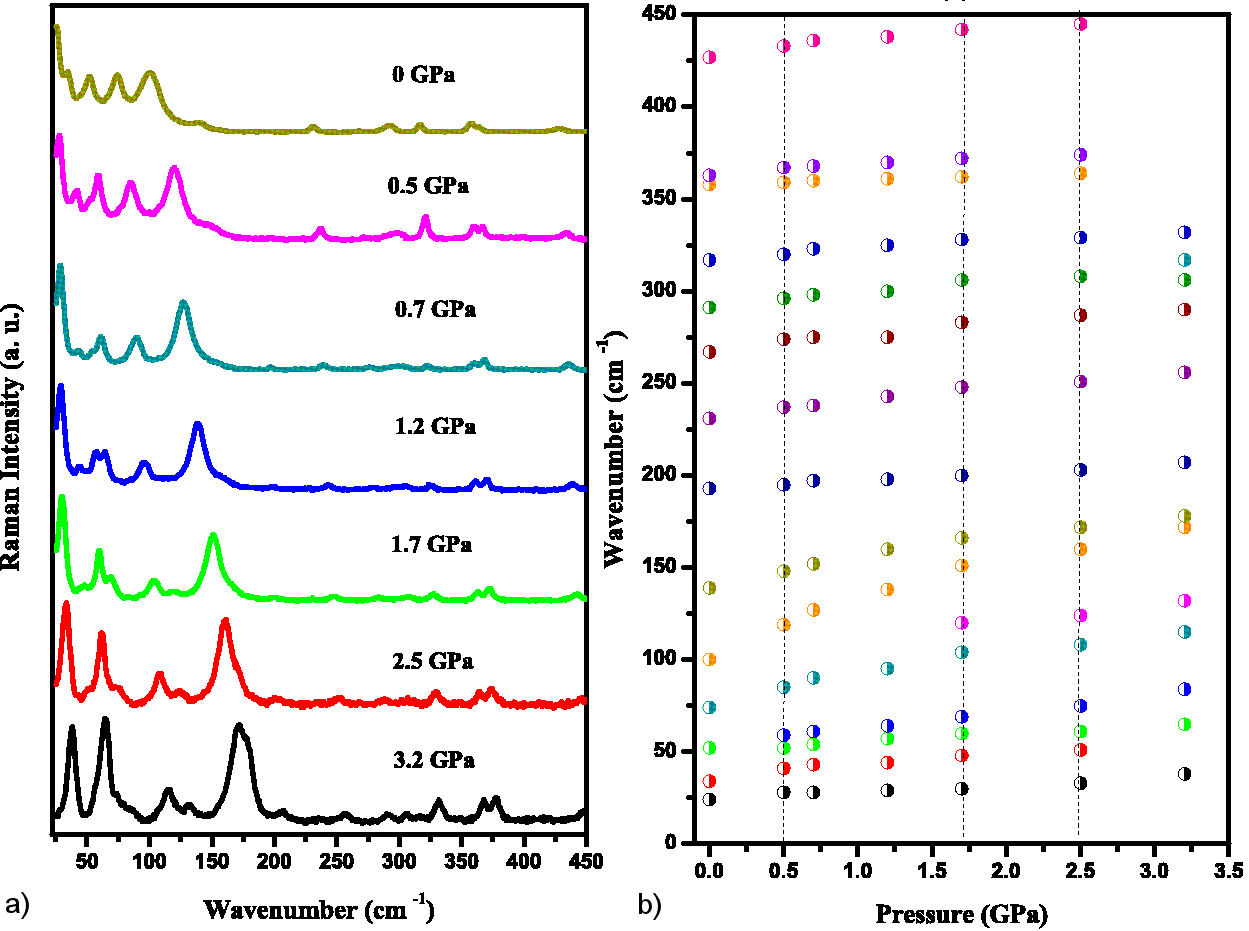
FIGURE 6 a) Raman spectra of the compound in the 20-450 cm−1 with pressure from ambient to 3.2 GPa. b) Raman spectra dependence with pressure.
Low frequency vibrational modes are associated with vibrations in the crystal lattice. Major changes in frequency, such as soft modes, may indicate a structural phase transition due to a variation in a lattice parameter [24]. Another indication of a structural phase transition is the coalescence or splitting of a mode with increasing pressure [25,26]. However, in this spectral range (0 ∼ 350 cm−1) it is not possible to detect a phase transition by our Raman scattering measurements, except for a single evidence of band splitting at 75 cm−1 at 1.7 GPa.
The same behavior is seen in the 450-900 cm−1 range (Fig. 7). The band at 468 cm−1 coalesces at 0.7 GPa. Here we see that the bands between 615 and 620 cm−1 start to split slightly with increasing pressure. The former is associated with SO2 bending, while the latter is associated with deformations in the aromatic ring and CO bonds. These modes and the peak at 583 cm−1 are very stable, varying by no more than 5 cm−1 over the pressure range from ∼ 0 to 3.5 GPa. Although there is new evidence for a change in the spectrum in the 480 cm−1 band, there are only two measurements here before its coalescence with increasing pressure. Furthermore, its vanishing occurs at 0.7 GPa. At this pressure value no change in the low energy vibrational modes was observed, only at 1.7 GPa for the 78 cm−1 mode.
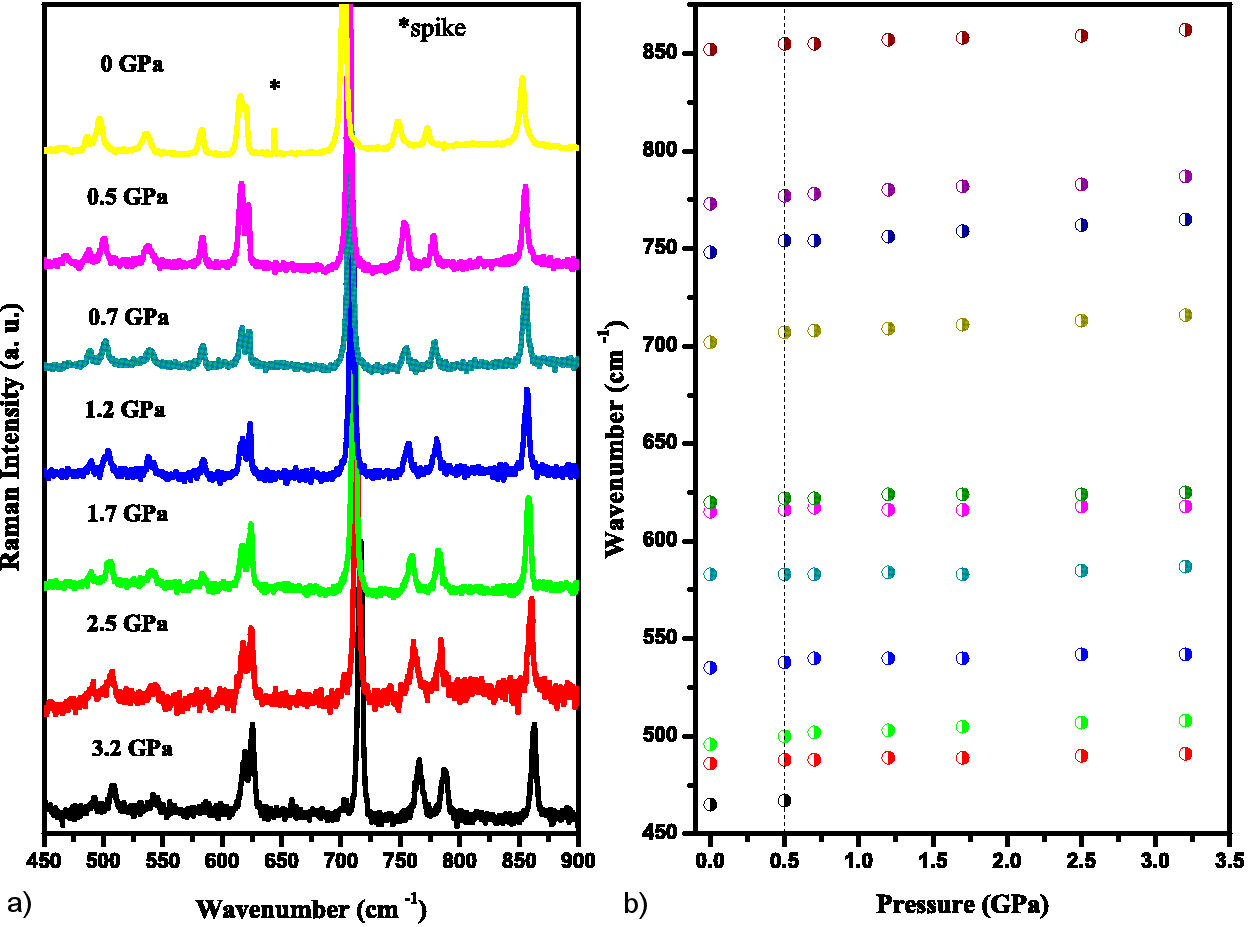
FIGURE 7 a) Raman spectra of the compound in the 450-900 cm−1 with pressure from ambient to 3.2 GPa. b) Raman spectra dependence with pressure.
Figure 8 shows the Raman spectra of the compound in the 900-1250 cm−1 range as a function of pressure variation from ambient to 3.2 GPa, and the pressure dependence of the Raman spectra. In this spectral region, the Raman spectra show the coalescence of four modes into two between 975 and 1050 cm−1 from 0.5 to 1.5 GPa. These bands are related to vibrational modes of benzene (1000, 1004 and 1023 cm−1) and morpholine rings (1028 cm−1). As the pressure rises, the hydrogen bonds associated with the internal modes shorten more rapidly due to their weak interaction, which explains the marked increase in wavenumber compared to the other Raman bands in the same spectral range [27-29]. The overlap of the 1000 and 1004 cm−1, 1028 and 1041 cm−1 bands occurs at 0.7 and 1.7 GPa, respectively, in agreement with the band splitting at 74 cm−1.
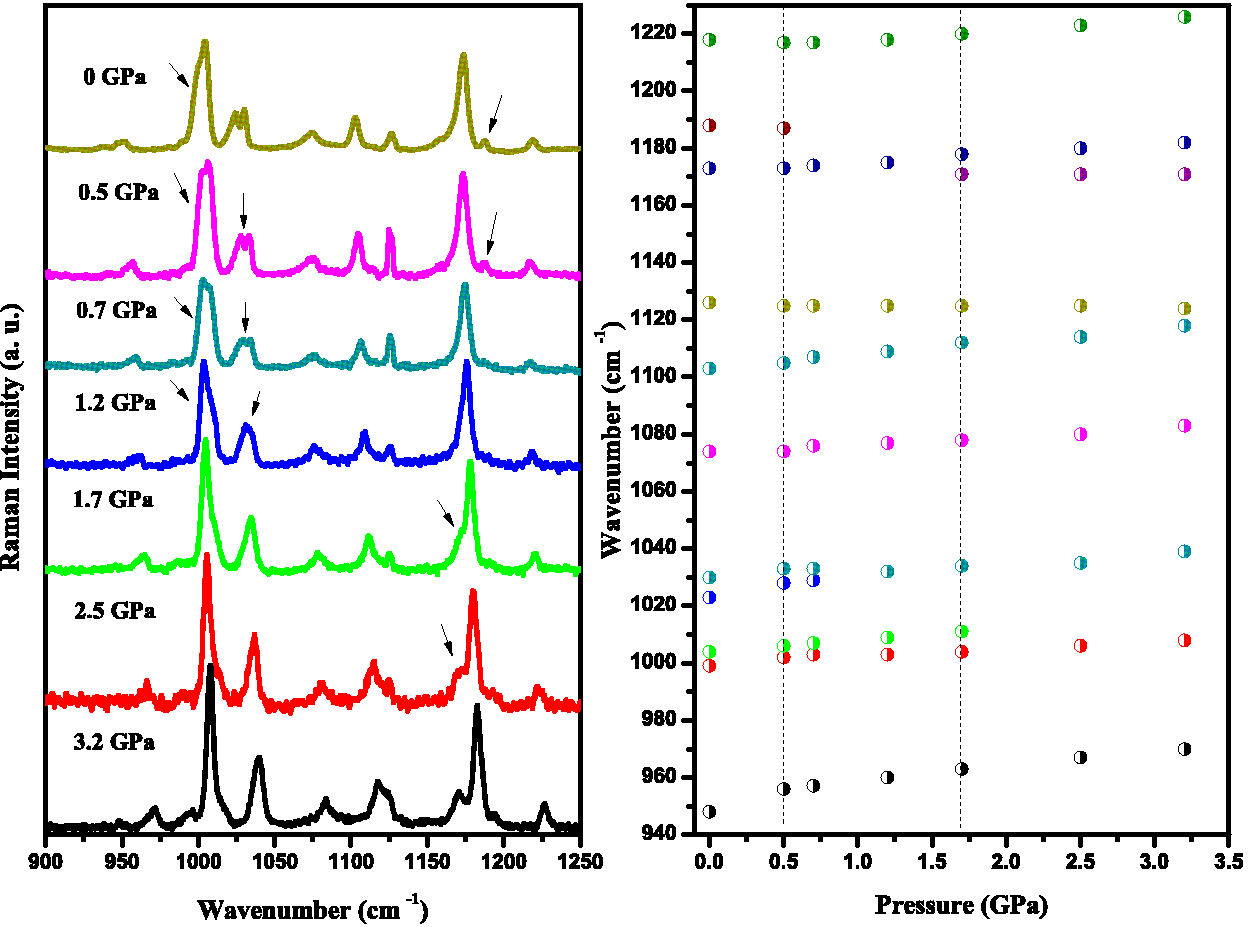
FIGURE 8 a) Raman spectra of the compound in the 900-1250 cm−1 with pressure from ambient to 3.2 GPa. b) Raman spectra dependence with pressure.
The coalescence of the mode at 1186 cm−1 can also be observed above 0.5 GPa. In addition, the splitting of the mode at 1175 cm−1 (into 1170 and 1177 cm−1) can be seen close to 1.7 GPa. Furthermore, the band at 1103 cm−1 moves faster than the peak at 1127 cm−1 (at ∼ 0 GPa), leading to an overlap of the second one with increasing pressure.
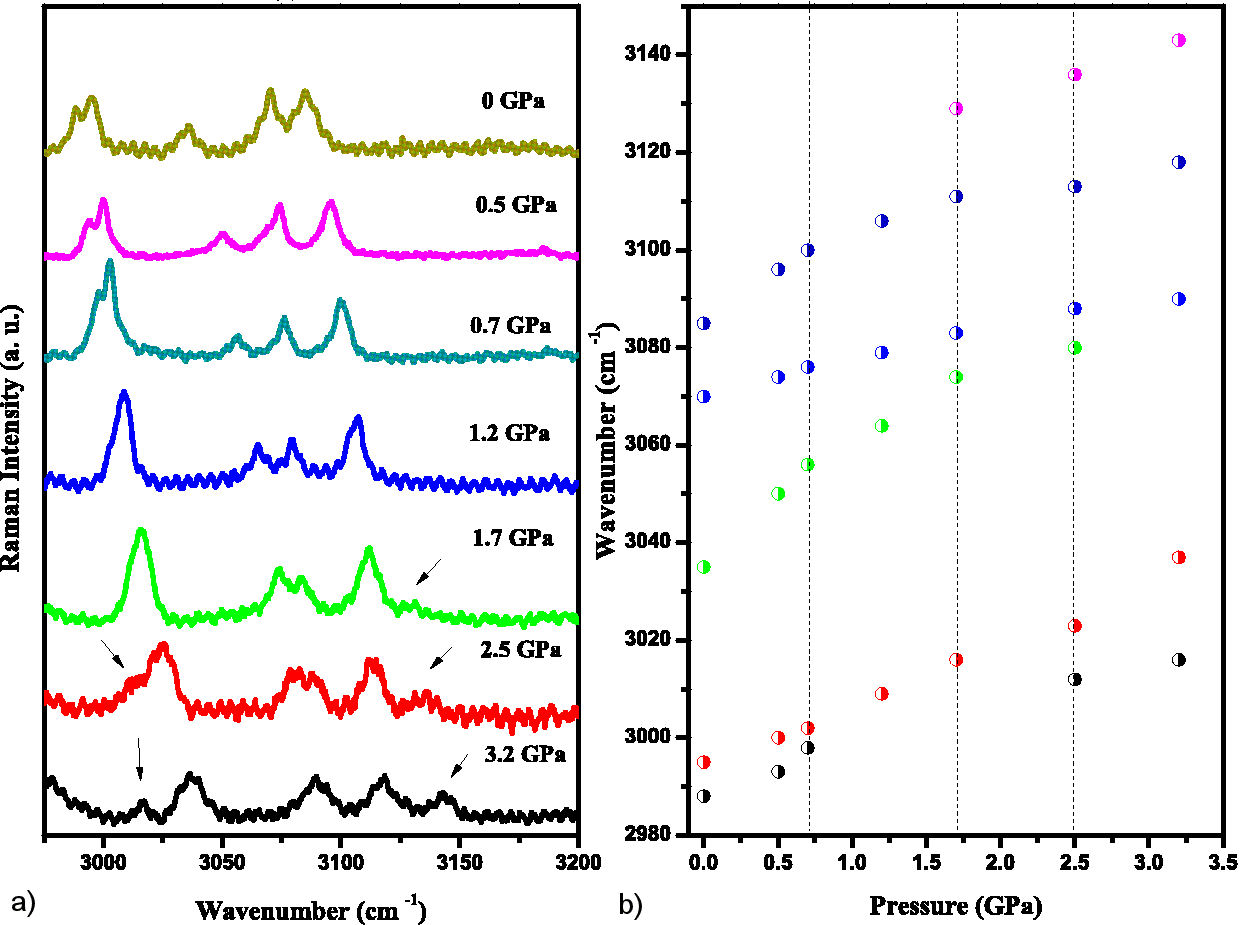
The last 5 modes in the range 2980 to 3145 cm−1 from ambient pressure are related to stretching of C-H bonds (Fig. 9). The 2988 and 2995 cm−1 modes (not assigned in the Table II) merge near 0.7 GPa, and the 3070 and 3085 cm−1 modes merge above 2.5 GPa. A new mode (3129 cm−1) appears at 1.7 GPa and a split is observed again near 2.5 GPa (modes 3012 and 3023 cm−1). All modes in this range correspond to CH stretching in the morpholine and benzene rings. Hydrogen bonds of type C−H···O between molecules in the unit cell may play a role [30]. A weak van der Waals interaction between the molecules is the primary cause of the large scale crystalline structure, while strong covalent bonding exists within the molecule itself [31]. This mechanism can explain the changes in the dω(p)/dp plot.
5. Conclusions
Here, the 4-(benzenesulfonyl)-morpholine molecule was characterized by NMR and its crystalline form was subjected to high pressure. Raman and IR spectroscopies were performed under room conditions and the vibrational modes were compared with the results of ab-initio calculations for band assignment. Raman spectra obtained for a pressure range of ∼0 to 3.5 GPa showed split/merge peaks and emergence/coalescence throughout the spectral range. Some discontinuities in the dω/dp plot occur near 0.7, 1.7, and 2.5 GPa. Although the values between pressure measurements are sparse, there are several indications of changes in vibrational modes associated with different phase transitions, possibly conformational. Future work using other techniques, such as dielectric spectroscopy and X-ray diffraction, should confirm our results and provide a characterization of the structural phases.

