


 nueva página del texto (beta)
 Inglés (pdf)
 Artículo en XML
 Referencias del artículo
 Enviar artículo por email
 Citado por SciELO
  Similares en
SciELO
Similares en
SciELO 
 Permalink
1. Introduction
Copper is employed in electrical wiring, electrical appliances, and heat exchangers. In marine applications, such as propellers and propeller shafts, aluminium bronze and high-strength brass are utilized [1]. For condensers in freshwater applications, brasses are generally occupied. Copper alloys are also utilized in numerous significant applications, for example, in water distribution systems, marine applications etc. [2, 3]. These alloys have very good resistance to corrosion, good strength, fatigue resistance and conductivity [4-7]. Corrosion is an important phenomenon to observe in metals, as it naturally degrades the metal surfaces exposed to environments containing oxygen. The process converts metals into a more stable form of oxides. As a result, not only the chemical but physical properties of an alloy are also affected by the corrosion process [8]. Although most of the structural alloys corrode by the moisture in the air, the process can be accelerated when exposed to certain other substances. Small amounts of alloying elements are frequently added to metals to upgrade their properties. A metal’s strength, hardness, electrical and thermal conductivity, corrosion resistance, and colour can be changed to meet demand through alloying. The improvement of one feature by the addition of a substance may have unanticipated impacts on other properties. The precipitates of intermetallics are allocated into the microstructure in response to heat treatment. The alloying elements in copper play a vital role in both the strengthening effect and other properties like corrosion [9]. The chloride environment has an adverse corrosive effect on the alloy surface as Cl- ions promote pitting corrosion [10]. Moreover, Cl- ions accelerate the rate of dissolution of protective oxide layers. According to the literature, chloride solution exhibits a much higher rate of redissolution of the protective Cu2O layer than chloride-free solution [2, 11]. Electrochemical impedance spectroscopy is a useful method of characterizing electrochemical corrosion properties, such as diffusion rates, reactions etc. Although this approach is susceptible to potential interpretation problems, modelling with optimally fitted circuits can improve the understanding of electrochemical corrosion [12]. Again, the technique of potentiodynamic polarization is a generally acknowledged method for identifying localized corrosion caused by pitting corrosion.
Various investigations on the effect of alloying elements on the corrosion behaviour of alloys under corrosive medium are going on [13]. But few works are there studying the role of alloying elements on the corrosion performance of copper alloy under sodium chloride solution. This article evaluates the effect of alloy composition on the electrochemical corrosion behaviour of Al and Zn added Cu alloys under 0.1 M NaCl solution. Ten weight percentages of each alloying element are considered to identify the individual severity of corrosion. For the investigation of the corrosion behaviour, electrochemical techniques such as potentiodynamic polarization and electrochemical impedance spectroscopy (EIS), surface characterization, including optical microscopy, scanning electron microscopy (SEM) and energy dispersive spectroscopy (EDS) have been performed.
2. Experimental
Commercially pure Cu, Cu-10Al as Al-bronze and Cu-10Zn alloy as α-brass were utilized in this investigation. Aluminium, zinc, and commercially pure copper were melted, which was executed in a crucible of clay graphite in a pit furnace which is natural gas fired. The chemical compositions of the samples were obtained by optical emission spectroscopy (OES) method which are shown in Table I. The cast alloys were machined into 15 × 20 × 150 mm3. Then the alloys were cold-rolled using a laboratory-scale rolling mill by 40% reduction. The samples acquired from the cold rolling were of 9 × 20 × 20 mm3 size and were aged at 200°C for 60 min for attaining peak hardness and stress relieving [14]. To measure the hardness of the aged samples, a Zwick Rockwell hardness tester with a 1/8-inch ball was used on the B scale. Density was considered from the elemental composition of the alloys. Tensile test was carried out at 10-3 s-1 strain rate using an Instron testing machine according to ASTM. The samples were machined to produce working electrodes of 4 × 5 × 35 mm3 size. 4 × 5 mm2 surfaces were exposed, while coating the remaining surface by PVC heat shrinkable tube. Afterwards, the exposed surfaces of the alloys were polished mechanically with emery papers of 320 to 2000 grits.
Table I Chemical composition of copper samples (wt.%).
| Alloy | Al | Zn | Pb | Sn | Fe | Ni | Si | Cu |
|---|---|---|---|---|---|---|---|---|
| Cu | 0.001 | 0.000 | 0.010 | 0.004 | 0.033 | 0.001 | 0.000 | Bal |
| Cu-10Al | 9.460 | 0.047 | 0.088 | 0.017 | 0.154 | 0.004 | 0.004 | Bal |
| Cu-10Zn | 0.013 | 10.300 | 0.012 | 0.007 | 0.057 | 0.005 | 0.004 | Bal |
A 100 mL three-electrode glass cell was utilized for the electrochemical study. 0.585 g of analytical reagent grade sodium chloride powder was dissolved into 100 mL of deionized water to prepare the 0.1 M sodium chloride solution. The rectangular coated experimental samples were used as the working electrodes, a platinum electrode was considered as the counter electrode and an Ag
2.1. Electrochemical impedance spectroscopy (EIS)
The electrodes were connected to the CH Instruments - Electrochemical Workstation by crocodile clips. The system was maintained for around 30 minutes to reach a steady state. To obtain the open circuit potential (OCP) values, the voltages between the working and reference electrodes were measured. 5 mV amplitude and 100 kHz to 0.2 Hz frequency range were set for the sinusoidal voltage. Then the impedances for this range of frequencies were measured by the potentiostat at the open circuit potential. The EIS data were obtained after 30 minutes of stabilization for each sample. These impedance data were fitted to the appropriate electrical circuit in the program EC-Lab-Analyst. The circuit used in this study is called the Randles circuit. By modelling with this circuit, the system characteristics like, R
p
=polarization resistance (Ω), R
S
= solution resistance (Ω), and
2.2. Potentiodynamic polarization technique
For potentiodynamic polarization analysis, the same experimental setup was used. The electrode potential was changed from - 1 to +1 V with a scan rate of 0.5 mVs-1, and the corresponding corrosion current was measured. The formula employed for finding out the corrosion rate is,
where,
The microstructural images of polished surfaces of the alloys prior to and after corrosion were captured by OPTIKA, a typical optical microscope. In the case of the conventional optical microstructure of the aged alloys, the surfaces were metallographically etched by a typically suggested copper etchant, one of ammonium hydroxide + hydrogen peroxide (3%) in a 1:1 ratio. The SEM and EDX investigations were carried out using a JEOL scanning electron microscope with an attached X-ray analyzer.
3. Results and discussion
3.1. Physical properties
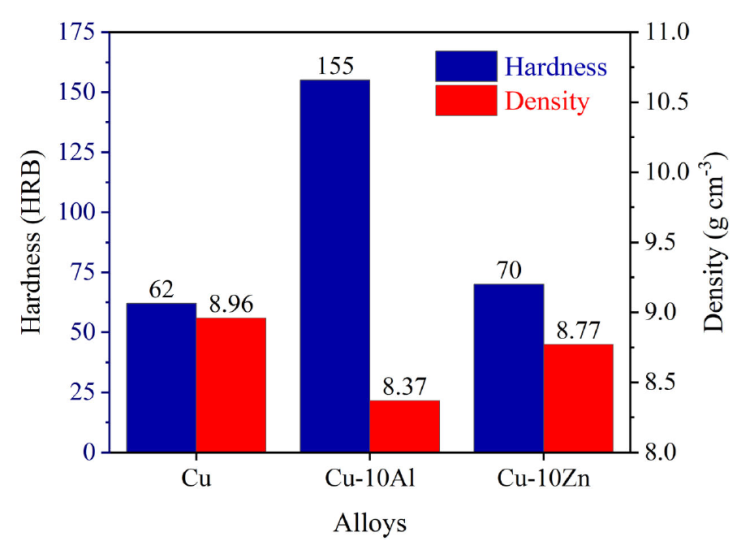
The effects of Al and Zn content by 10 wt% each on the physical and mechanical properties of Cu, alloy experimental results are exposed in the following two charts. Figure 1 shows the physical properties of the alloys related to hardness and density at peak aged conditions. It is observable from the figure that, at peak aged conditions, both Cu-10Al and Cu-10Zn have higher hardness values than pure Cu. As solution strengthening occurs through the dissolved Zn and Al atoms in the alloys. As a result, α-brass and Al-bronze have higher hardness compared to Cu [15,16]. Again, Al-bronze has superior hardness to Zn-bearing α-brass. During age hardening, five stable intermetallics of Al and Cu are formed: Cu9Al4, Cu3Al2, Cu4Al3, CuAl and CuAl2. Among them, two specials are Cu9Al4 and Cu3Al2, which cause higher hardness in the Cu-10Al alloy [17,18]. These stable intermetallic phases have been identified in Cu-Al alloys in several previous investigations [19-21]. When the concentration of Zn is below 35 wt.%, the phase of brass is α, which has a substitutional and disordered face-centred-cubic (fcc) structure. As aresult, Cu-10Zn shows a single fcc state of α-phase with no discernible age-hardening effects, which makes Cu-10Zn alloy softer than Cu-10Al [22, 23]. Additionally, in Fig. 1 depicts the variation of density among the experimental alloys. Pure copper has the highest density, whereas Al-bronze is the lightest, as the densities of Cu, Zn, and Al follow this sequence: Cu>Zn>Al. It can be seen from Table I. that Al and Zn are present in the alloys by 10 wt.%.
3.2. Mechanical properties
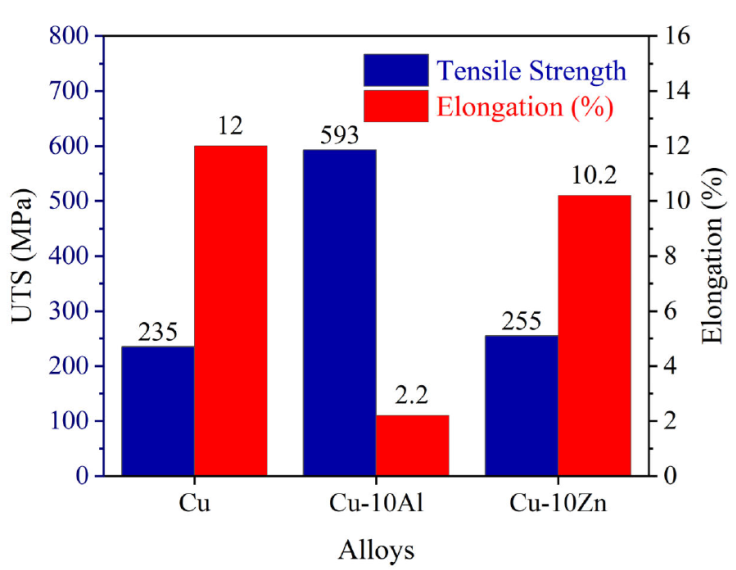
Figure 2 shows the mechanical properties of the pure copper, Al and Zn added Cu alloys in terms of tensile strength and % elongation. It is noted from the figure that both the Al-bronze (Cu-10Al) and the α-brass (Cu-10Zn) show better tensile strength but reduced ductility than Cu. Previous studies suggest that adding some alloying elements to copper improves tensile strength [24]. The results of the study support that zinc-added copper has more tensile strength and less % elongation than pure copper itself [25]. The higher content of zinc in Cu-10Zn increases brittleness [24]. The solid solution hardening of the
3.3. Impedance spectroscopy studies
The impedances were generated for variable frequencies between 100 kHz to 0.2 Hz by the potentiostat, CH Instruments - Electrochemical Workstation. The impedances were modeled with the electrical circuit in Fig. 3 to get the values of corresponding circuit components. The circuit components are solution resistance R
S
, polarization resistance R
p
, which is equivalent to charge transfer resistance
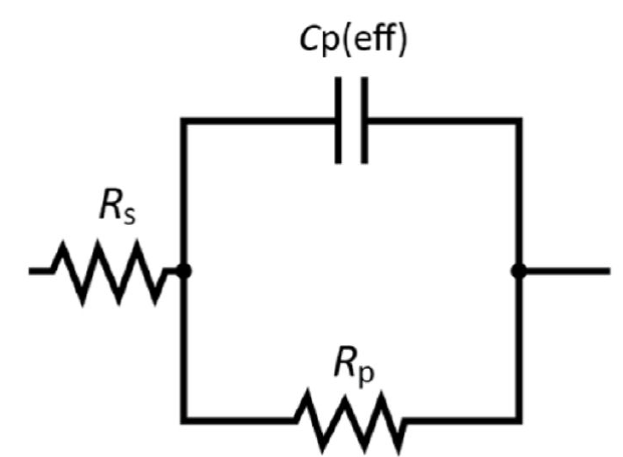
Table II Open circuit potential (OCP) values and electrochemical impedance spectroscopy (EIS) test results.
| Alloy | OCP, V vs. SCE | Rp/Ω | Rs/Ω | C p(eff) /μF | X2 |
|---|---|---|---|---|---|
| Cu | -0.12913 | 26633 | 53.84 | 40.56 | 0.07667 |
| Cu-10Al | -0.17519 | 18473 | 45.01 | 54.1 | 0.01711 |
| Cu-10Zn | -0.20251 | 16192 | 36.48 | 83.66 | 0.00179 |
From Table II, the observed phenomenon is that the OCP shifts towards a negative direction as alloying elements are added into the Cu, but the open circuit potential value of Zn added Cu alloy falls below Al added Cu alloy. The more positive open circuit potential expresses better corrosion resistance of metal [29]. Again, R p is higher for pure copper rather than Al and Zn added alloys, and α-brass has the lowest value of R p . This trend suggests that α-brass has the lowest corrosion resistance, while pure copper has the best corrosion protection among them. The addition of Al and Zn degrades the corrosion performance of Cu alloy as dealloying of Cu-Al and Cu-Zn occurs on the alloy surfaces due to the selective dissolution of Al and Zn. Moreover, the Cu-Zn solid solution is more prone to dealloying than Cu-Al solid solutions, which is why Zn-added α-brass shows the worst corrosion resistance [30]. Normally Al-bronze and α-brass are involved to produce a compact film composed of Al2O3 and ZnO along with Cu2O, where Al-related oxide is more stable than that of Zn [30,31]. Pure copper shows the best performance as Cu is susceptible to forming cuprous oxide (Cu2O) protective layer or to dope the film with the alloying elements’ ions such as iron, and each of the experimental alloys has a trace amount of iron in it [32-34]. Copper, when immersed in NaCl solution, forms Cu2O by this reaction [32,35]:
But, when Cu bonds with Al and Zn to produce solid solution strengthening and age hardening particles, they do not let Cu to easily form oxide. Zn forms a zinc hydroxy chloride (Zn5 (OH)8 Cl2) surface film by the following reaction [36]:
Again, Assaf, et al. [36], investigated that passive zinc oxide film is formed by the following reaction:
The aluminium oxide formation is shown in the equation below [37]:
However, the values of R
S
show a decreasing trend from Cu to Al and Zn added alloys in the table, and
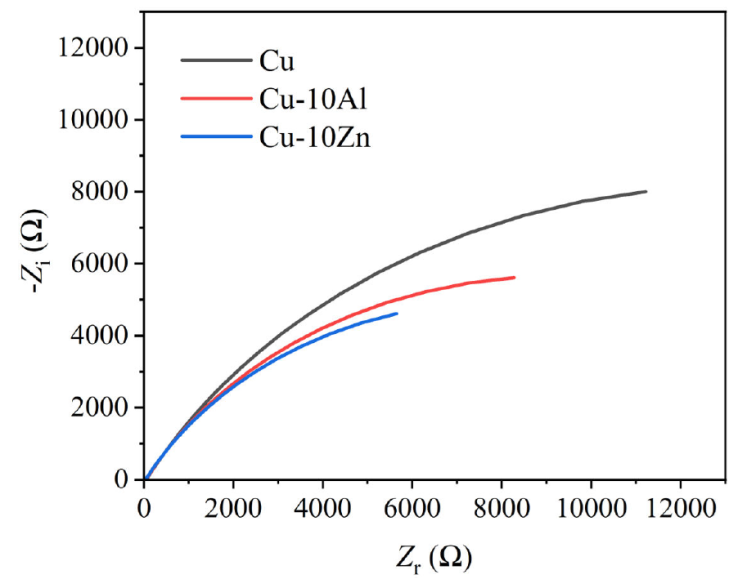
Figure 4 displays the Nyquist diagram for the copper alloys. This diagram follows the capacitive-resistive semicircle model, which provides the real (Zr) and imaginary (Zi) parts of the impedances, respectively. The charge transfer process regulates the electrochemical corrosion of pure copper and copper alloys, as indicated by a full semicircular shape on the Nyquist diagram [39].
The Bode magnitude and phase plots are shown in Figs. 5a) and
b), respectively. At the y-axis of the Bode
magnitude plot, the modulus of impedance
(
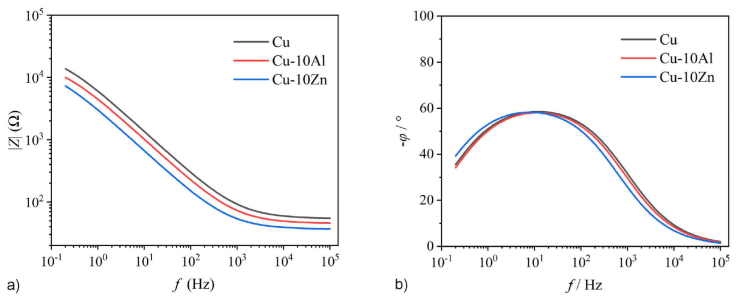
From the equation, it is known that at high frequency, the right term of the equation gets close to zero, and the impedance is close to the solution resistance. Figure 5a) shows a similar trend. The Bode magnitude plot for pure Cu is situated higher than Al-bronze, where the curve for α-brass lies lower than the alloy with a higher amount of Al, which can be explained by Eq. (6) and Table II. From the table, both R S and R p are higher in Al-bronze than α-brass, the pure Cu having the maximum value. For higher values of R S and R p , the impedance must be higher, according to Eq. (5). In Fig. 5b), no phase shift is there at lower and higher frequencies, indicating a resistive response. On the other hand, at mid-range frequencies, the phase shifts are closer to -90, which is a capacitive response.
3.4. Potentiodynamic polarization analysis
Figure 6 shows the potentiodynamic polarization curves obtained under scan rate of 0.5 mVs-1 applying electrode potentials from -1 V to +1 V, for the commercially pure Cu, Al added Cu alloy as Al-bronze, and Zn added Cu alloy as α-brass. The experimental results of the potentiodynamic polarization analyses obtained through Eq. (1) are furnished in Table III. The corrosion current is expressed by
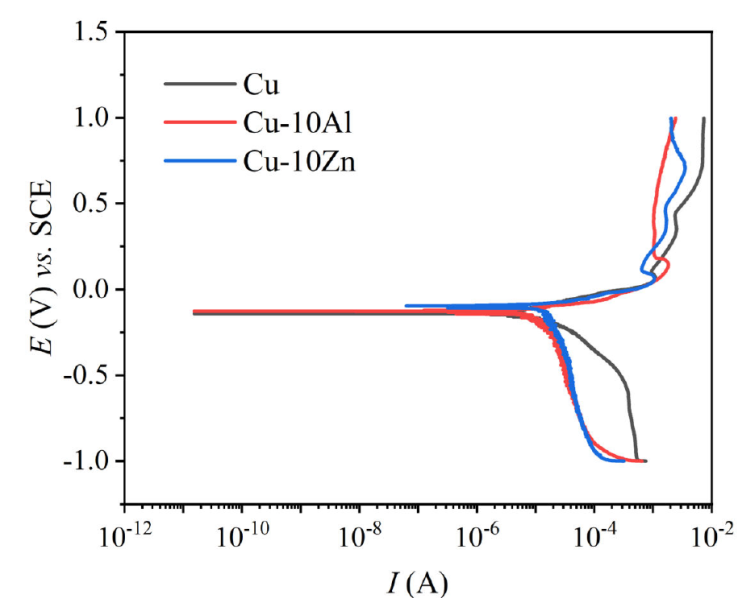
Table III Corrosion parameters obtained from potentiodynamic polarization analysis.
| Alloy | I corr /μA | E corr /mV | Corrosion rate, mm/year |
|---|---|---|---|
| Cu | 2.86 | -140.3 | 0.1659 |
| Cu-10Al | 7.99 | -126.98 | 0.4627 |
| Cu-10Zn | 11.31 | -95.28 | 0.6720 |
The experimental data suggest that the corrosion current and corrosion rate are higher in Al, and Zn added alloys, where Zn added alloy showing the maximum corrosion. This can be interpreted as the pure copper exhibits the best corrosion resistance, whereas the
3.5. Optical micrographic observation
Figure 7 presents the optical micrographs of Cu, Cu-10Al and Cu-10Zn alloys prior to and post corrosion process in 0.1 M NaCl solution. The surfaces of the alloys were highly polished with emery papers for getting smooth surfaces. There are slight scratches due to polishing. Although not very much difference can be observed from this type of unetched microstructures, but as there were different alloying elements present, a varied tone can be detected in the alloys. Pure copper shows orange-tinted red, Al-bronze exhibits dull gold tones, and
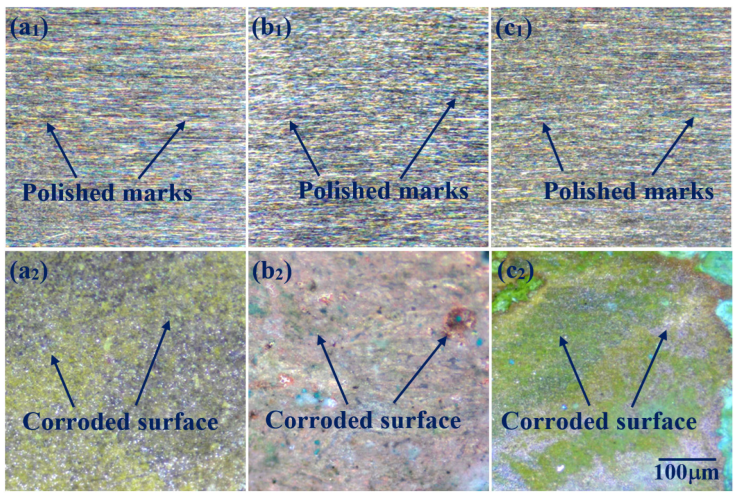
Figure 7 Optical micrographic images of the surfaces of pure Cu, Al and Zn added Cu alloys before and after corrosion in 0.1 M NaCl solution.
There is a film of Al2O3 on the surface of Cu-10Al in Fig. 7b2), which is white in general. The ZnO together with CuO shows the white and green tone on the surface of Cu-10Zn alloy in Fig. 7c2) [45]. The micrographs also display the highest damaged surface of the Zn added alloys and followed by Al-added alloys and then pure Cu. These results also comply with the experimental results of the corrosion rate of the experimental alloys.
The conventional optical microstructures of the etched pure Cu, Al and Zn added Cu alloys are shown in Fig. 8, after cold rolling and peak aged conditions. Due to rolling by 40% deformation, elongated and broken grains are formed in the direction of rolling. The grains become elongated in the direction of the applied stress, irreversibly changing the microstructure during cold working. The distribution of the size of the Cu grains is not uniform, and there are some smaller grains visible in the middle of the coarse grains, where several twins also exist within the grains [Fig.8a)] [46]. Different phases such as
3.6. SEM and EDX observation
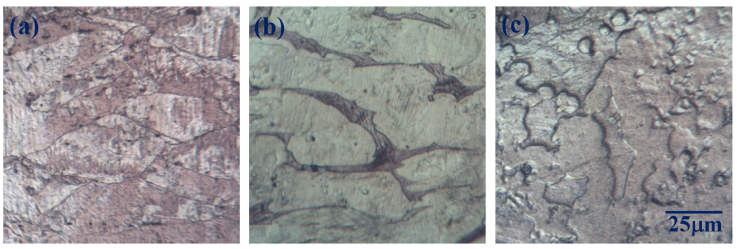
The surface micrographs of the corroded surfaces of the pure Cu, Al-bronze and α-brass using SEM are presented in Fig. 9.
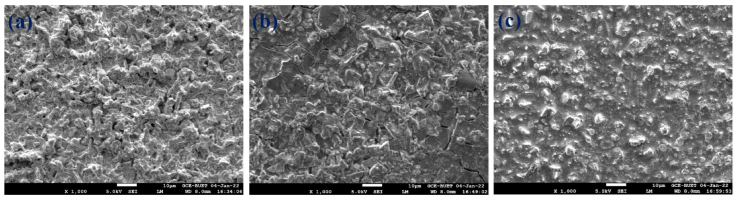
Figure 9 SEM images of a) pure Cu, b) Al added Cu, c) Zn added Cu alloys after corrosion in 0.1 M sodium chloride medium.
The uneven surface topography is visible due to the formation and demolishment of oxide layers for each sample. It is conspicuous that the dissolution of pure copper is homogeneous, which is depicted in Fig. 9a), whereas there is selective dissolution in the case of Al-added Cu and Zn-added Cu in Figs. 9b) and c). Furthermore, surface defects such as microcracks and pinholes are visible, which are, to a greater extent, on the surfaces of Al and Zn-added Cu alloys. The pinholes are the effects of pitting corrosion which seems excessively on the surface of Cu-10Zn alloy, caused by the Cu-Zn solid solution matrix and the preferential dissolution as discussed previously. One significant observation is that Zn bearing alloy surface shows thick oxide layers with internal massive damage. The pitting potentials in Cu-Al and Cu-Zn alloys are higher than in pure copper, which may be due to the presence of the mixed passive films Cu2O and Al2O3 in Cu-Al alloy and Cu2O and ZnO in Cu-Zn alloy [30, 31]. The dissolution rate of oxide film ZnO is higher and not too stable than that of Al2O3.
According to the quantitative EDX analysis as tabulated in Table IV, the alloys show following chemical compositions in wt.%:
The compositions can be interpreted as the wt.% of Al is reduced from 9.46% to 5.45% in Al-bronze after corrosion. On the other hand, the wt.% of Zn is reduced during corrosion from 10.3% to 1.61%, depicting that dissolution of Zn bearing particles in
4. Conclusions
Corrosion of copper along with Al and Zn added alloys in 0.1M NaCl solution has been successfully investigated. The main conclusions of the experimental results can be summarized as follows:
Among the three samples, pure copper has shown the highest corrosion resistance, whereas Zn added α-brass showing the lowest, followed by Al-bronze, by both EIS and Tafel analyses. This is because the Cu-Zn solid solution is more prone to dealloying than Cu-Al solid solutions, and pure Cu serves homogeneous corrosion protection by forming different oxide layers of copper.
As the surfaces deteriorate, the polished marks are removed, which can be observed in the optical microstructures. A variation in colour tones can also be observed in the different alloys, both before and after corrosion. More pinholes can be observed because of pitting corrosion and dealloying in the Zn alloyed sample than in the Al alloyed sample. Selective dissolution of Zn from the Cu-Zn alloy compared to Al from the Cu-Al alloy has occurred to a greater extent as Cu and Zn have a larger difference in equilibrium potential than Cu and Al. Micro cracks and pinholes are evidence of selective dissolution of alloy phases, which can be identified in the SEM images. The etched microstructures before corrosion exhibit different phases of α, β,
The EDX spectra prove the presence of oxide layers on the surfaces after corrosion, and the degree of dissolution of Zn and Al added particles is higher in

