


 nueva página del texto (beta)
 Inglés (pdf)
 Artículo en XML
 Referencias del artículo
 Enviar artículo por email
 Citado por SciELO
  Similares en
SciELO
Similares en
SciELO 
 Permalink
1. Introduction
Early studies about marijuana started at the beginning of the 19th century, which revealed for the first time the clinical effects of cannabinoids when treating diseases such as cholera and rheumatic diseases, among others [1,2]. From Thomas Wood’s pioneering work isolating cannabinol for the first time, through its first complete synthesis by Lord Alan Todd, we arrive at the modern discussion of its medical uses. In this discussion, we can take two main approaches, one trying to demonstrate that its inappropriate use may have significant repercussions in health and social environment, [3,4] and its counterpart, which studies the chemical components of marijuana in isolation to identify its beneficial properties in health care [5].
Marijuana has different chemical compounds, the dominant ones are Δ9-tetrahydrocannabinol (THC) and cannabidiol (CBD), but only THC is psychoactive [6]. Cannabis is known for its psychotropic effects but nevertheless, there are reports of benefits to people suffering from chronic nonmalignant neuropathic pain [7], cancer pain [5], autism [8], or Parkinson’s disease [9].
The therapeutic mechanism that result from marijuana components is still vaguely known; therefore, a series of systemic studies related to identifying potential targets, signaling pathways, and their association with diseases are of interest to researchers. In particular, there is a line of research focused on using molecular dynamics (MD) to identify molecular targets of the components of cannabis [10-12]; for example, Elmes (2014) [10] found by computational analysis that some Fatty acid-binding proteins in the human body bind to THC and CBD, demonstrating that THC and CBD inhibit cellular catabolism and metabolism of the endocannabinoid anandamide. Molecular dynamics simulations provide data that might be difficult to obtain from experiments, allowing the researchers to hypothesize or test models of the interaction between functional groups and membranes. For example, Kopec et al. [13] review the information from different sources in which the interaction of lipids with anesthetic, anti-inflammatory, and anti-viral, among other properties. In this review is presented an overview of the changes in physical properties of the analyzed lipid bilayers. Moreover, recent works reported that the action of anesthesia is related to proteins embedded in the cell membranes [14,15].
Hence, these reports indicate that the interplay between lipid membranes, and different molecules is mediated by complex interactions, and is far to achieve a simple description of it. Despite the recent experimental and computational studies about the properties of cannabis, how it affects lipid monolayers and bilayers has not been thoroughly studied.
Mammalian lung surfactants can be mimicked at a 4:1 ratio of PC and PG lipids [16-18], and considering that the pulmonary surfactant is the first defense barrier for our bodies against foreign agents through respiration, we studied four computational systems of a mixed lipid monolayer of dipalmitoylphosphatidylcholine (DPPC) and dipalmitoylphosphatidylglycerol (DPPG) with two molecules with anesthetic properties, local (lidocaine) and general (morphine), and the two most abundant compounds in cannabis, cannabidiol (CBD) and tetrahydrocannabinol (THC). The present work aims to study the physical, structural and energetic changes that the drug-lipid systems undergo through equilibrium molecular dynamics and the analysis of the potential of mean force. Finally, we hypothesize about how the anesthetic properties of cannabis that can be associated with its molecular characteristics when comparing the results obtained for lidocaine and morphine.
2. Simulation details
We performed molecular dynamics simulations to investigate the interaction between a mixed lipid monolayer and four different drugs. We employed a methodology from a work by Hu et al. [18] utilizing equilibrium MD simulations and um- brella sampling (US) to observe the interfacial behavior of the lipid monolayers and ketoprofen.
Each drug was studied individually with the same composition of lipids. Figure 1 shows the molecular structures of CBD, THC, morphine, lidocaine, DPPC and DPPG. To understand how the drug molecules interact with the monolayers, we simulated four systems at mean molecular areas in the coexistence plateau (constant surface pressure): 55, 62.3, 75, and 90 Å2/lipid molecule; each system consisted of 32 DPPC (Mw = 734) and 8 DPPG (Mw = 745) molecules (4:1, χ DPPC = 0.8). The properties obtained from pure lipid monolayers served as blank for the interaction with drugs.
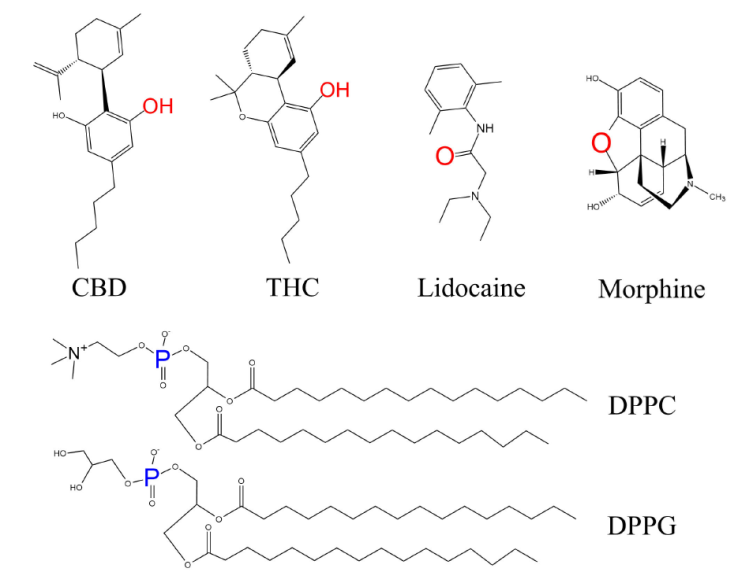
Figure 1 Molecular structure of molecules used in this work. To calculate the radial distribution function we used the red atoms for drugs and blue atoms for lipids.
To build the initial configuration, we placed the water molecules in the center of the simulation box, followed by two layers of vacuum. Then the two monolayers are placed at the interface. The number of water molecules in the simulation depends on the mean molecular area we fixed in the initial conditions: 3914 water molecules for 55 Å2/lipid molecule, 4453 molecules for 62.3 Å2/lipid molecule, 5404 molecules for 75Å2/lipid molecule, and 6547 molecules for 90Å2/lipid molecule.
We performed the simulations with GROMACS version 2020 [19,20], we used the CHARMM builder [21] to construct the drug-free membrane system using CHARMM36 as a force field [22]; likewise, we obtained the parameterization of the drug interactions with the membranes from the same builder and the TIP3P model was employed to simulate the water molecules. The form of the CHARMM potential energy function (V(r)) used to calculate the energy is:
where k b , k θ , k φ , k χ , k UB are the bond, valence angle, improper dihedral angle, dihedral angle, and Urey-Bradley force constants, respectively; b, θ, φ, χ, and S are the bond length, bond angle, improper dihedral angle, dihedral torsion angle, and Urey-Bradley 1-3 distance, respectively. The subscript zero represents the equilibrium values for the individual terms.
Each simulation consists of an energy minimization step, an equilibrating process at NVT for 20 ns, and an iteration in MD for 15 ns. The temperature was set at 298 K using the Nosé-Hoover [23,24] algorithm with the correlation time τ T = 0.01ps. As stated in these [18-20, 25-27], the time step size was 2 fs, the cutoff radius for short-range Van der Waals interactions, and the Coulomb potential was 1.2 nm and 1 nm, respectively. The calculation of long-range electrostatic interaction was performed by using the Particle Mesh Ewald (PME) method [28], and the LINCS algorithm [29] was used to constrain the covalent bonds linked to the hydrogen atoms.
Once the free-drug systems finished the MD equilibrium processes, we added eight molecules for every single drug simulation, CBD (Mw = 314.46), THC (Mw = 314.45), morphine (Mw = 285.33) or lidocaine (Mw = 234.33) [13,25], to the system and repeated the process: energy minimization step, 20 ns of NVT equilibrium, and 15 ns of MD.
Finally, we used the umbrella sampling method (US) to calculate the free energy in MD through the potential of mean force (PMF) [18,30-32]. The US method allow us to observe the changes in the PMF during the transport of one single drug molecule through the DPPC/DPPG monolayer [30]. First, one drug molecule is located in the vacuum slab, around 0.5 nm away from the lipid-vacuum interface, an external force pulls it through the membrane of mean molecular area of 55 Å2/lipid molecule. Then, we used a force from the derivative of the umbrella potential that pulls the drug particle to pierce the membrane with a rate of 10 nm/ns for 500 ps, using a force constant of 1000 kJ/mol
3. Results and discussion
From the MD simulations, we calculate the surface layer properties: surface tension, density profile, radial distribution function, and the order parameter of the systems; these properties are considering the statistical error from simulations and the time average of the last 5 ns of MD simulation.
3.1 Surface tension
The monolayer systems presented inhomogeneities in the z-direction due to the lack of molecule counterparts in the vacuum side of the simulation box; therefore, the pressure tensor is also inhomogeneous having the following form:
where V is the volume of the simulation box, and the sum is over all N molecules of the system. The first term in the sum is the kinetic component of the pressure and the second one is the virial component of the pressure with p i , r i , and f i the momentum, position, and force, respectively, relative to the i-th particle in the α-direction. Thus, the surface tension is obtained from the Kirkwood-Buff theory [35]:
where L z is the box length in z-direction and P ii denotes the main diagonal of the pressure tensor. The Fig. 2 shows the surface tension γ obtained from (3) as a function of the surface concentration Γ. Surface concentration calculation considers the mass load at the surface (i.e., the DPPC/DPPG monolayer system and the monolayer with four different drugs: Morphine, lidocaine, CBD, and THC) and the imposed area per molecule. In the simulations different values of the area per molecule were fixed, from 55 to 90 Å2/lipid molecule.
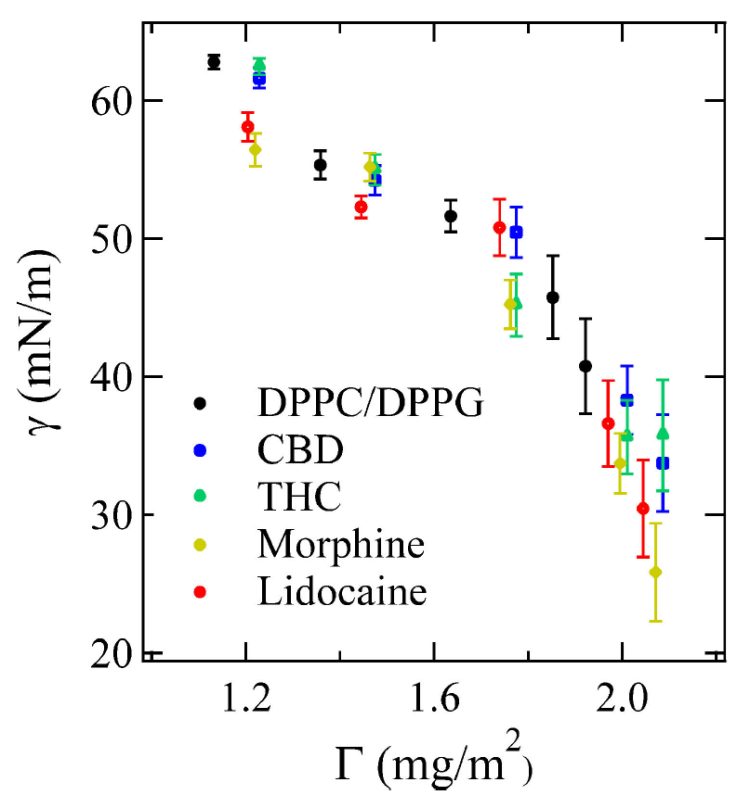
Figure 2 The surface tension of mixed DPPC/DPPG versus surface concentration in the absence of drug and with drugs, error bars correspond to one standard deviation. Surface tension slightly decreases when the drugs interact with the membrane, suggesting an increase of attraction between the surface molecules.
Surface tension of all systems decreases as Γ increases, an effect due to the amphiphile character of lipids when adsorbed at the water interface [27,32]. However, the difference of γ between a lipid monolayer with and without the presence of drugs, is due to the adsorption of the molecules in the lipid monolayer driven by the interaction between the choline in the head group of lipids, and the benzene of the drug molecules, which is mainly attributed to the cation-π interaction [36]. Since Γ of lipid and drug molecules increases, as a consequence
3.2. Density profile and radial distribution function
The density profile (gmx density), and the radial distribution function (gmx rdf) were obtained performing the MD simulations using GROMACS package [19,20]. Figure 3 shows the density profile for each drug along the z-axis. Each profile of the studied drugs are at mean molecular areas from 55 to 90 Å2/lipid molecule. We observed that the peak of the molecule density shifts towards the water-lipid interface as the mean molecular area increases. One observes at higher surface pressure that Morphine peak density position overlaps the water-lipid interface, and CBD with a broader distribution, this behavior is not observed for Lidocaine and THC (see Fig. 3). These results suggest that the interactions between Morphine (and CBD) molecules with the lipid head groups is increased when lipids are in a closed-packed phase. However, the density profiles of Lidocaine and THC shows a different behavior. At higher surface pressures the molecules approach to the polar heads of lipids, but they avoid the water-lipid interface, remaining within the lipid hydrocarbon tails. This behavior is probably due to the complex cation-π interaction which can be either attractive or repulsive [37].
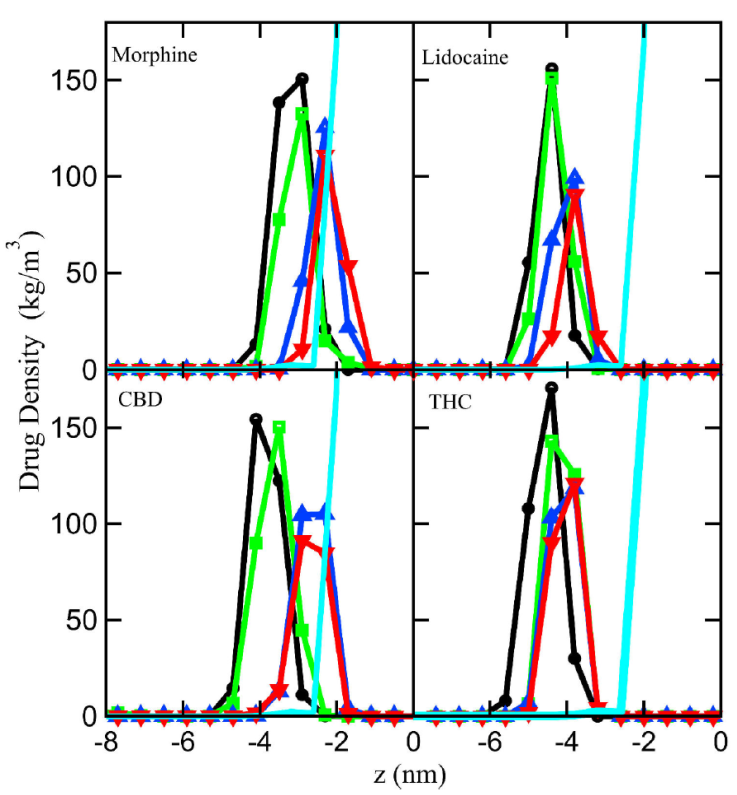
Figure 3 Density profile of morphine, lidocaine, CBD, and THC at different mean molecular area varying the mean molecular area: 55 (black circles), 62.3 (green squares), 75 (blue triangles) and 90 (red down-pointing triangles) Å2/lipid molecule, the cyan line without symbols represents the water averaged limit of the lipid-water interface.
The radial distribution functions (RDF) are calculated from the average positions of the specific atom groups, and is useful to investigate the variation of the relative positions of molecules in pairwise interaction [38]; the three-dimensional RDF, g(r), is defined by:
where ρ(r 1, r 2) is the density of a pair particles located at r 1 and r 2.
We computed the RDF for the oxygen atoms in a pairwise interaction with other oxygen of the same drug type, and the oxygen atoms of drugs with the phosphate atoms in lipids. However, as the molecules of morphine, CBD and THC have more than one oxygen atom in their molecular structure, to calculate the RDF we took account the positions for the highlighted atoms in Fig. 1 (red for oxygen and blue for phosphate).
Figure 4, shows the behavior of the RDF versus the rescaled distance between oxygen and phosphate groups. An increase of the RDF amplitude occurs at higher mean molecular areas for all the studied drugs. The increment in amplitude occurs in the average equilibrium distance between the oxygen atoms in the drug molecules relative to the phosphate groups in lipids; the RDF is sharply distributed for morphine at distances ≈ 2σ and lidocaine at distances ≈ 2.5σ. We observed a broader distribution of RDF for CBD and THC; however, the peak locates at ≈ 3.5σ for both drugs. The sharp RDF suggests that, at equilibrium, morphine prefers to be closer of the lipid polar heads, yet, as we observed in density profiles, these drugs lay within the lipid tails. However, for lidocaine, CBD, and THC, the broader distribution suggests that, in general, these drugs are farther from the polar heads and most likely in the hydrocarbon tails of lipids.
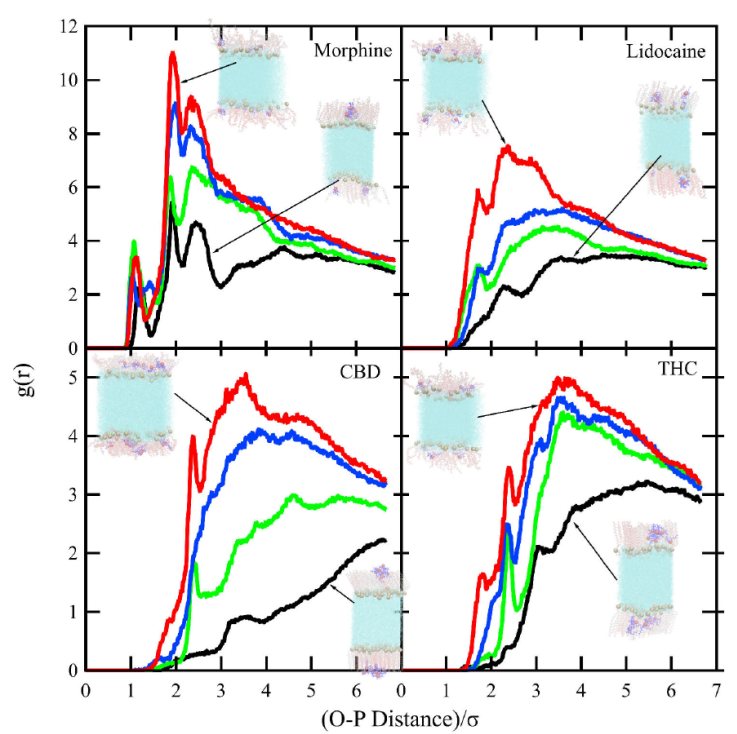
Figure 4 Radial distribution function of oxygen of morphine, lidocaine, CBD, and THC relative to the phosphate group of lipids at different mean molecular areas: 55 (black), 62.3 (green), 75 (blue) and 90 (red) Å2/lipid molecule. Inset: show a lateral cut of the final configuration of the systems, in which we observe the relationship between the O-P RDF and the positioning of the drugs relative to the lipid-water interface.
Figure 5 shows the RDF versus the rescaled distance of oxygen atoms of the same type of drugs. The amplitude of RDF increases as the mean molecular area decreases; the drugs tend to self-aggregate. We observed a sharp distribution for morphine (55 Å2/molec) and lidocaine (from 55 to 75 Å2/molec), suggesting that these drugs tend to close-pack at a lower mean molecular areas than CBD and THC.
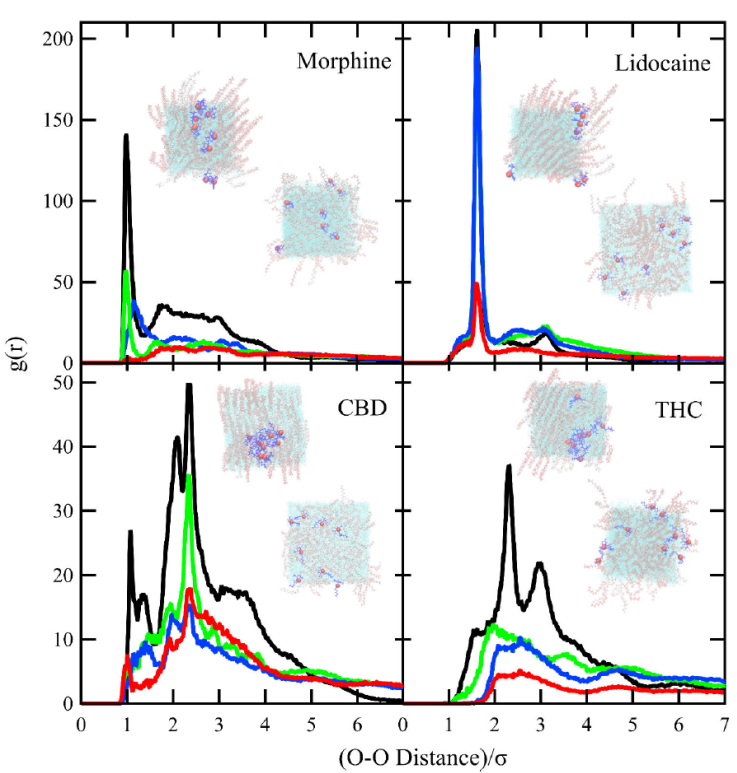
Figure 5 Radial distribution function of oxygen atoms of morphine, lidocaine, CBD and THC relative to drugs of the same type at different mean molecular areas: 55 (black), 62.3 (green), 75 (blue) and 90 (red) Å2/lipid molecule. Snapshots of the equilibrium configuration of the systems. Seen from the top of the simulation box, it shows how the drugs arrange themselves, the cluster-like structure of drugs corresponds to a close-packed lipid phase at smaller mean molecular areas.
Summarizing the information from O-P and O-O averaged equilibrium distances, the complete panorama suggests that at lower lipid surface concentrations, the drugs are evenly distributed, morphine and lidocaine approach the polar heads of lipids at average distances of ~ 2σ closer than CBD and THC that averages distances of ~ 3.5σ . When the lipid surface concentration increases, the four drugs tend to form clusters, and they are repelled from the polar heads, again, morphine and lidocaine are the drugs less repelled from the polar heads.
3.3. Order parameter
The lipid order parameter, also known as hydrocarbon chain order parameter, is one of the essential quantities that characterizes the state of any phase. The lipid order parameter is a measure of the orientational mobility of the carbons in a lipid chain and is defined as [39,40]:
where θ is the angle between the carbon and the normal to the surface of the monolayer. If SCD = 1, means that the lipid tails are perfectly perpendicular to the monolayer surface, SCD = -0.5 corresponds to an anti-alignment, and SCD = 0 means random orientation. Figure 6a) shows the results for DPPC and Fig. 6b) for DPPG, with and without drugs, at a mean molecular area of 55 and 90 Å2/lipid molecule. In these figures, the x-axis represents the number of carbon along the hydrocarbon tail of lipids.
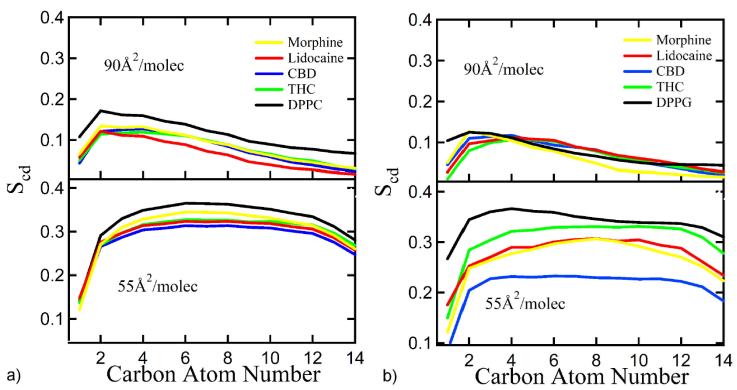
Figure 6 a) DPPC and b) DPPG sn1 order parameters with mean surface area at 90 Å2/lipid molecule. (top) and 55 Å2/lipid molecule. (bottom), with and without drugs.
The decrease in the order parameter arises when lipid membranes change from ordered to disordered liquid phases without considering the inclusion of drugs [18,32]. As expected, the order parameter decreases when drugs are in the system, since the order of the lipid hydrocarbon tails is disrupted by the different drug molecules interacting with them. However, the inclusion of drugs at the studied concentrations does not induce a phase transition of the lipid monolayers.
We chose the model lipid systems in the phase diagram at the liquid expanded (LE) and at the liquid condensed (LC) phases. In our simulations we did not achieved stable values of surface tension to study the monolayer LE+LC phase coexistence, probably due to instabilities caused by the size of the simulation box and the number of lipids. However, comparing previous numerical works [18,26,32] focusing on their results of lipid systems in a single phase, and without drugs, their values of surface tension are similar to our results; therefore, we used these results as benchmark to enhance our results from the lipid layers interacting with drugs.
3.4. Umbrella sampling
Figure 7 shows the values of PMF from the US method, these values are obtained for each drug molecule at different test positions across the DPPC/DPPG monolayer. For the surface lipid layer we fixed the area per molecule at 55 Å2/molec, which corresponds to the LC phase. The PMF results are self-consistent with the results of the previous sections; such is the case of RDF since we see that the drug molecules tend to lie inserted within the lipid tails, and the PMF shows that the region of the tails is energetically favorable for drugs since it presents a minimum of the potential.
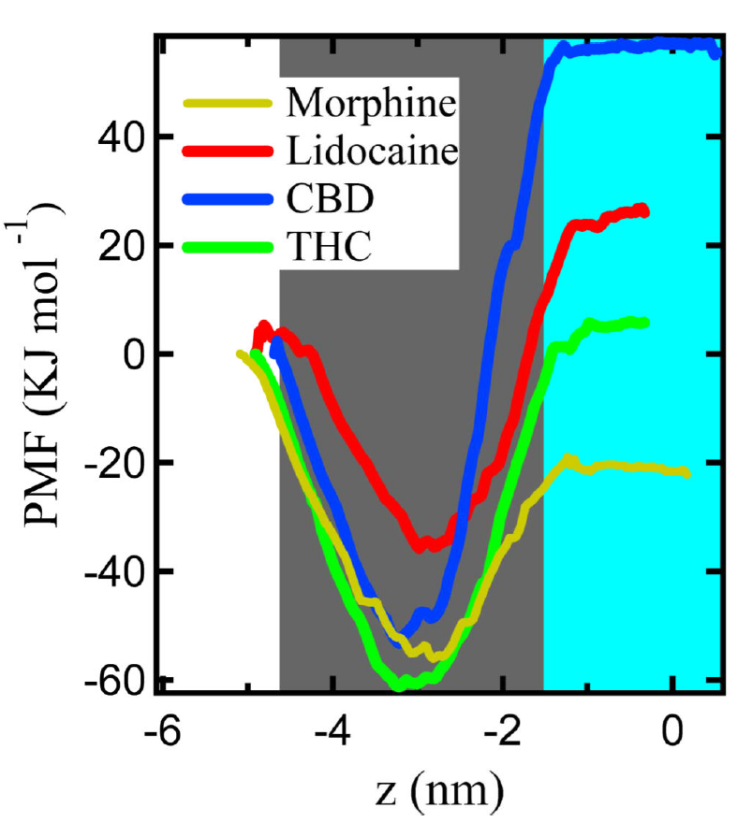
Figure 7 Potential of mean force of a single molecule of morphine, lidocaine, CBD, and THC through the DPPC/DPPG monolayer at a mean surface area of 55 Å2/lipid molecule. Vacuum is represented in the white area, in gray represents the region occupied by lipids with tail is pointing towards vacuum, and water is the area in blue.
Cation-π interactions and steric hindrance of lipid head groups oppose the molecules to cross the barrier [41]. The interactions at the onset of the trajectory of the drug molecule from vacuum through membrane make it possible for molecules to spontaneously insert into the membrane region within the tail group of the lipids. Hence, the PMF (in kJ
Once the drugs reach the aqueous phase, the drug is surrounded solely by water molecules, and the drug-lipids interactions diminish; therefore, the changes in PMF become imperceptible; in the aqueous phase, the PMF reach approximate values of 57 for CBD, 5 for THC, 25 for lidocaine, and -21 for morphine, in kJ·mol-1. Between the PMF minimum within the lipid tails and the value in the aqueous phase, the systems present an energy barrier that prevents drugs from crossing the lipid-water interface; the value of the barriers for each drug is 110 for CBD, 66.2 for THC, 60.7 for lidocaine, and 35 for morphine, in kJ
We calculated the free energy (ΔE) for a single drug from the difference between the PMF in vacuum (where its value is 0 kJ
Table I Values of ΔE for the drugs reported in the present work and from literature.
| Source | Drug | (ΔE k𝐽·mol -1 ) | Method |
|---|---|---|---|
| Reported here | Morphine | -21 | MD |
| Braun et al. [42] | Morphine | -32.9 | HSM, DSC and TGA |
| Paloncývá et al. [43] | Morphine | -39.3 | MD (COSMOtherm) |
| Reported here | Lidocaine | 25 | MD |
| Shehatta [44] | Lidocaine | 44.36 | Potentiometric Titration |
| Saeedi et al. [45] | Lidocaine | 9.1 | MD (GROMACS) |
| Reported here | CBD | 57 | MD |
| Reported here | THC | 5 | MD |
Despite the differences between the numerical values and the experimental results, the simulation gives us a good approximation of the behavior of the molecules interacting with lipid systems. The results of the US, together with the results in the previous subsections, show the persistence of drugs to lay in the region within the lipid tails; however, the ordered structure formed by the polar heads of the lipids makes it difficult for the drug molecules to pass through, in consequence, the value of PMF increases. Therefore, as we add more drug molecules to the system, they might be trapped within lipid tails, and it is possible to form aggregates due to other interactions (i.e., steric interactions from lipids). The results showed a tendency for the two main cannabis components to remain within the membrane. Therefore, we hypothesized that this behavior could be related to the anesthetic proprieties of CBD and THC by comparison of the behavior of lidocaine. However, more investigation is needed about the interactions of the CBD and THC with the membrane embedded proteins to complete this hypothesis.
4. Conclusions
In this work, we performed a series of different atomistic approaches of molecular dynamics simulations to study the interactions between a monolayer of DPPC/DPPG in the presence of the two most abundant components present in marijuana, THC, and CBD; and with two well-studied anesthetic drugs, morphine and lidocaine. Compared to drug-free lipid monolayers, the decrease of surface tension in systems with the presence of drugs leads to sites that present structural instabilities that cause membrane ruptures at less area per molecule; previous works reported this same behavior [18,31,43,46,47]. In addition, the density profile and the RDF give us information about the behavior of the drug molecules in the membrane, one of the main features is that the drugs remain in the lipid hydrocarbon tails region. Morphine showed little mobility at the lipid interface as the area per molecule decreases.
As far as we know, this is the first time reported free energy calculations for CBD and THC utilizing molecular dynamics methods. We obtained free molar energy values of 57 kJ

