


 nueva página del texto (beta)
 Inglés (pdf)
 Artículo en XML
 Referencias del artículo
 Enviar artículo por email
 Citado por SciELO
  Similares en
SciELO
Similares en
SciELO 
 Permalink
1. Introduction
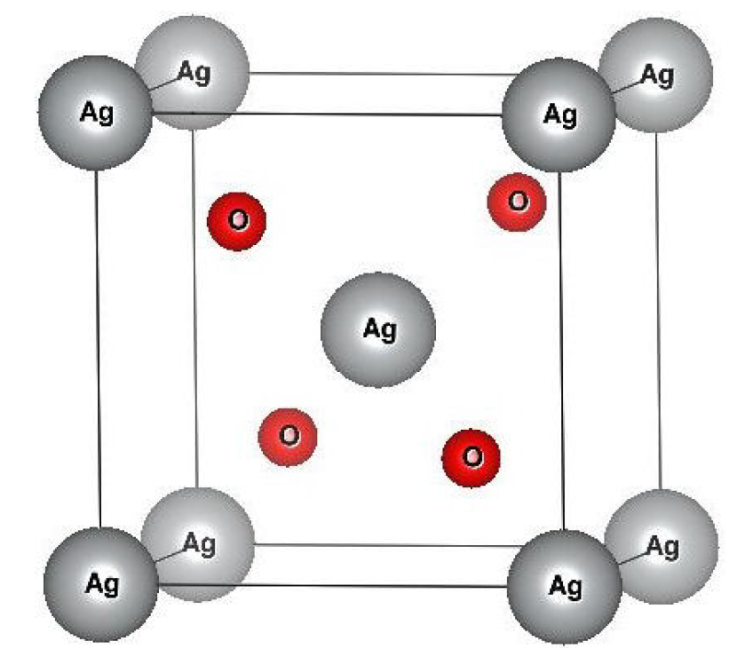
Binary silver oxide is an isostructural compound that crystallizes in the Cu2O cuprite structure within the
In the literature, many theoretical methods within different approximations have been employed to accurately describe the different properties of this material. F. Pei et al., [24], used the plane-wave-pseudopotential method as incorporated in the CASTEP code to study the structural, electronic, and optical properties of Ag2O with cubic cuprite structure. Jeremy P. Allen et al., [25], have described the electronic structure of Ag2O using various calculation methods. The structural, electronic, elastic, thermal, and optical properties of Ag2O were also investigated using the Wien2k code with different approximations (LDA, GGA, Engel-Vosko-GGA, and modified-Becke-Johnson-GGA) by Haleem Din and A. H. Reshak [26]. Using the projector-augmented-wave pseudopotentials as incorporated in the VASP code within LDA and LDA+U approximations, Naoto Umezawa et al. [27], have studied the electronic structures of Ag2O compound. As presented previously, numerous theoretical calculations of the electronic structures have been reported for this material but, none of them has exact bandgap energy compared to the experimental ones. To resolve this discrepancy, we used a new exchange-correlation functional for the mBJ potential coupled with Hubbard correction in the framework of the DFT-theory. The main objective of this study is to provide a better description of the electronic structure and optical spectra of the chalcogenide compound Ag2O.
2. Calculation method
In all our calculations, we used the FP-LAPW method [28,29], based upon the DFT-theory [30,31], and executed in the Wien2k code [32]. The muffin-tin sphere radii (R
MT
) for Ag and O are 1.96 and 1.69 (a.u), respectively. The input parameters such as R
MT
× K
max, G
max, and cut-off energy are respectively 7, 12
GGA-PBEsol-mBJ and GGA-PBEsol-mBJ+U were used to determine the optoelectronic properties. The U values were taken as
3. Results and discussion
3.1. Equilibrium ground-state and electronic structures
The equilibrium lattice constant a 0, bulk modulus B 0, and its pressure derivatives, were obtained by fitting the total energy as a function of the unit-cell volume using Murnaghan’s equation of state [36]. In this way, the volume optimization is carried out by minimization of the total energy versus volume. The obtained results of a 0(Å) and B 0(GPa) are given in Table I with some other available theoretical and experimental results for comparison. This table shows that the a 0 and B 0 for Ag2O are consistent with the available theoretical and experimental results.
To explore the electronic behavior of the studied compound, we calculated the density of state DOS and electronic band-structure BS along with the principal symmetry points in the BZ for the cuprite structure (X-R-M-Γ-R) using the GGA-PBEsol-mBJ and GGA-PBEsol-mBJ+U for the exchange-correlation functional (see Fig. 2). The result of BS reveals the semiconductor nature with a direct bandgap at the R-symmetry point. The distinct features noticed within GGA-PBEsol-mBJ compared to GGA-PBEsol-mBJ+U shifts the conduction band upward and increase the bandgap.
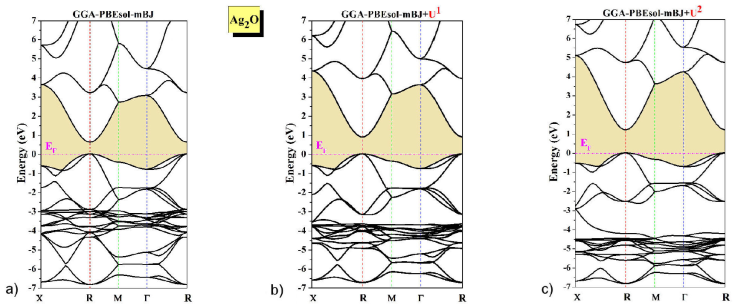
Figure 2 The calculated band structure of Ag2O compound using: a) mBJ-GGA-PBEsol, b) mBJ-GGA-PBEsol+U 1, and c) mBJ-GGA-PBEsol+U 2 approaches.
The overall bandgap result of GGA-PBEsol-mBJ is better than that of other theoretically calculated bandgaps (LDA, GGA, EV-GGA, and LDA+U) [26,27], but significantly underestimated the bandgap from the experimental values as shown in Table II. Whereas, to resolve this discrepancy of bandgap and provide a value almost comparable to the experimental data, we used the GGA-PBEsol-mBJ+U. It should be noted that the obtained value is consistent with the experimental values for the first time. Furthermore, the conduction-band-minimum CBM shifts towards higher energy compared to the GGA-PBEsol-mBJ position, but the position of the valence-band-maximum VBM remained fixed.
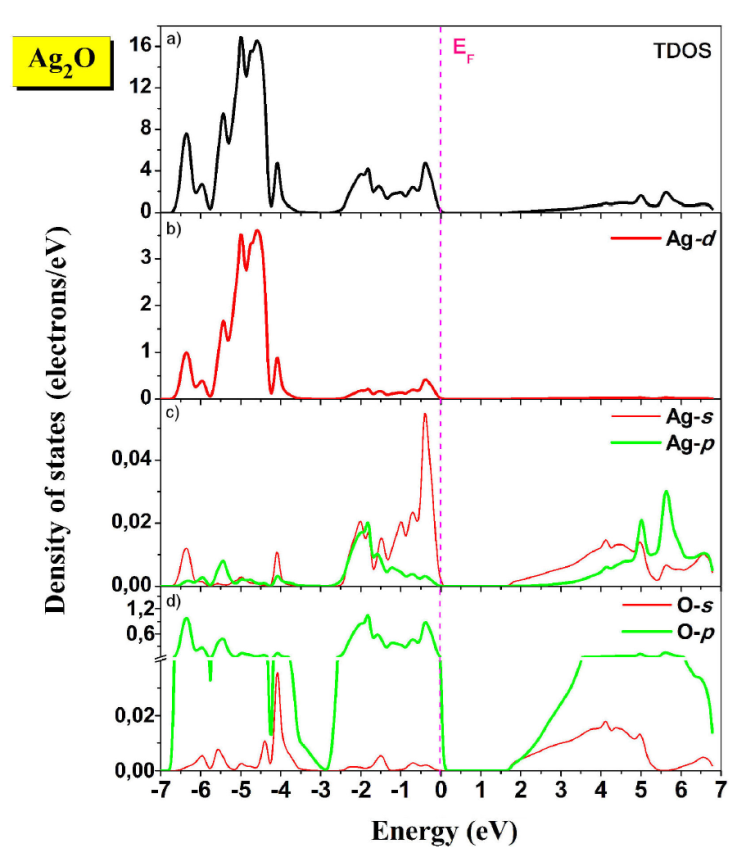
Total and partial DOS (TDOS and PDOS, respectively) calculated using GGA-PBEsol-mBJ+U 2 are shown in Fig. 3. The DOS spectra are divided into four regions. The First region, situated between (-6.7 and -5.8 eV) is a result of mixed Ag-4d and O-2p states. The lower limit of this region also includes a small amount of Ag-5s states. The second one located between (-5.8 eV and -2.7 eV) is dominated principally by Ag-4d states, with a minority of O-2p states. The third region below the Fermi level (E F ) consists of mixed Ag-4d and O-2p states, with a small contribution from Ag-5s. The bottom of the conduction band is mainly composed of Ag-(5s,5p) and O-(2s,2p) states.
3.2. Elastic properties
The calculation of elastic properties is important to obtain more information about the compound, such as mechanical stability, anisotropic binding character, bonding forces, and brittle or ductile nature. For cubic Ag2O, the number of elastic constants is reduced to only three independent elastic parameters: C 11, C 12, and C 44 (cubic crystals). The estimated values of these constants are useful for obtaining information about mechanical behavior. The calculated elastic constants are listed in Table III. We can see clearly that the obtained
Table III The Calculated elastic constants
| Compound | C 11 | C 12 | C 44 | B | G | E | B/G | A | v | |
|---|---|---|---|---|---|---|---|---|---|---|
| Ag2O | This work | 106.69 | 84.54 | 51.14 | 90.81 | 30.04 | 81.16 | 3.02 | 4.61 | 0.35 |
| Theor. [26] | 132.36 | 70.94 | 56.18 | 86.73 | 44.093 | 113.11 | 1.967 | 1.829 | 0.282 |
C ij satisfies the three well-known Born-Huang stability criteria for the cubic system [39], which means our material is mechanically stable. It is well-known that the anisotropy factor (A) is an important mechanical parameter for technological and engineering applications and for detecting micro-cracks in materials. If the anisotropy factor is equal to unity, the material is isotropic and for any value different from unity the material is anisotropic.
The anisotropy factor value is found to be 4.61 which indicates that the compound is an anisotropic material. For more information about the compound such as stiffness, type of bounds, hardness, and ductility (brittle), we have estimated the macroscopic mechanical moduli such as Young’s modulus (E), Shear modulus (G), Pugh’s ratio (B/G) and Poisson’s ratio (v). For that, we have applied the Voigt-Reuss-Hill approximation [40,41].
The calculated G v , G R , and G are 35.11, 24.98, and 30.04 GPa, respectively. Young’s modulus (E) provides information about the stiffness of materials. For the higher value of E = 81.16 GPa, the material shows high stiffness. In addition, Poisson’s ratio (v) provides information about the bonding forces [42]. The central forces in the solid are trapped between 0.25 and 0.5, for the studied compound, we found v = 0.35. Due to this value, we can state that this compound is characterized by a metallic bonding. The two traditional parameters, Pugh’s ratio of ductility and Poisson’s ratio [43,44], are responsible for the brittle or ductile of a material. The calculated B/G and v are 3.02 and 0.35, respectively. We can classify from these calculated values the investigated compound as ductile material. Table III displays our results of elastic constants and elastic moduli with other reported theoretical results. We can observe a significant deviation compared to our results, which is mainly due to the difference in the employed approximation.
3.3. Optical properties
To obtain more information about the electronic structure, we calculated the complex dielectric function 𝜖(ω). More descriptions of the optical calculation can be found in [45]. In this study, we computed the optical spectra of 𝜖(ω) with 50000 k-points in the IBZ. The variations in the real and imaginary parts (𝜖1(ω), 𝜖2(ω)) of the dielectric function in the energy range of 0-12 eV are plotted in Fig. 4a) and Fig. 4b) respectively. At zero frequency, the static dielectric constant 𝜖1(0) is 3.20. The real part of the 𝜖1(ω) spectrum grows with increasing energy until reaching a maximum value of 5.68 at 3.73 eV. After the peak, the 𝜖1(ω) decreases with an increase in energy, becomes negative at 5.97 eV, and then increases at higher energy. The negative values of the 𝜖1(ω) idealize the total reflection of the incident photons [46].
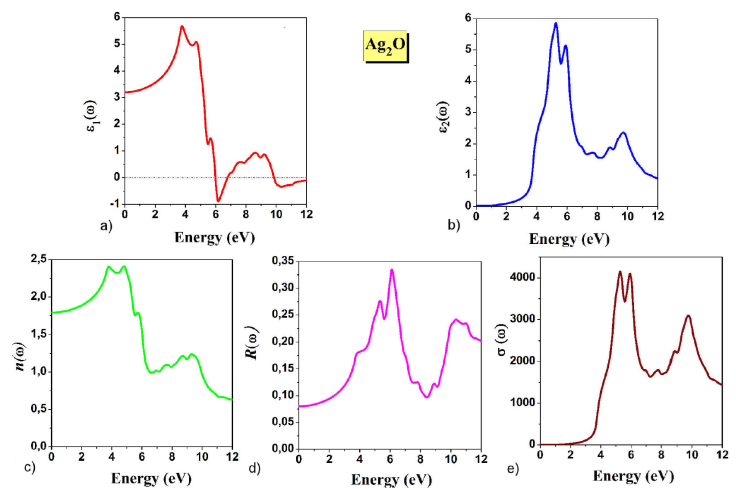
Figure 4 a) Real part of the dielectric function 𝜖1(ω). b) Imaginary part of the dielectric function 𝜖2(ω). c) The refractive index n(ω). d) The reflectivity R(ω). e) The optical conductivity σ(ω).
It can be seen in Fig. 4b) that the imaginary part has threshold energy at 1.22 eV, which represents the optical transition between VBM and CBM. We can also notice that the maximum absorption is located in the energy range from 4.19 to 6.47 eV, the highest peak intensity of 𝜖2(ω) is 5.86 at 5.26 eV. After this point, the 𝜖2(ω) spectrum increases.
The refractive index n(ω) of the Ag2O compound versus photon energy is shown in Fig. 4c), the static refractive index n(0) is 1.78, which satisfies the relation
The variation in the reflectivity R(ω) is shown in Fig. 4d), at zero frequency, the reflectivity R(0) is 8.10%, and it is obvious that R(ω) takes the maximum value (33.60%) at 6.12 eV.
As shown in Fig. 4e), we calculate the optical conductivity σ(ω). In the low-energy range, we can see a drastic decrease owing to the Drude interaction mechanism of light waves with conduction electrons. The maximum value of σ(ω) is 4165.58 Ω-1 cm-1 at 5.27 eV.
4. Conclusion
Herein, we have used the FP-LAPW method based on the DFT-theory to study the effect of different exchange-correlation functionals on the optoelectronic properties of the chalcogenide compound Ag2O. From the calculated electronic band structure, it was observed that the Ag2O compound exhibited a direct semiconductor nature with an energy bandgap of 1.22 eV, which agrees with the experimental values for the first time. The study of mechanical stability showed that the compound was stable against elastic deformation. From the obtained elastic moduli, we conclude that our compound is an anisotropic ductile material. The 𝜖1(ω) and 𝜖2(ω) parts of dielectric functions were estimated to identify optical transitions. n(ω), R(ω), and σ(ω) were also obtained and analyzed up to 12 eV. Finally, Ag2O was found to be useful for optoelectronic applications.

