Research Condensed Matter
The new P-chalcopyrite compound Cu 2 FeIn 2 Se 5 ; synthesis, thermal analysis, and crystal structure analysis by X-ray powder diffraction

-
Publication dates-
January 31, 2022
Jan-Feb , 2021
- Article in PDF
- Article in XML
- Automatic translation
- Send this article by e-mail
- Share this article +
Abstract
The Cu2FeIn2Se5alloy, belonging to the system
(CuInSe2)1-x (FeSe)x with x = 1/3, was
synthesized by the melt and annealing technique. The differential thermal
analysis (DTA) indicates that this compound melts at 1017 K. The crystal
structure of this new quaternary compound was established using powder X-ray
diffraction. Cation distribution analysis indicates that this material
crystallizes in a P-chalcopyrite structure, space group P
Keywords::
Crystal structure, X-ray powder diffraction, Rietveld refinement, P-chalcopyrite, chemical synthesis, differential thermal analysis, CuInSe2, semiconductor
PACS::
61.05.cp, 61.50.Nw, 61.66.Fn, 61.40.b
1.Introduction
The chalcopyrite family of compounds, with formula I-III-VI2 (I= Cu, Ag,
III= Al, Ga, In, VI= S, Se, Te) form an extensive group of semiconductor materials
with diverse optical and electrical properties 1-3. From the structural point of view, chalcopyrite
crystallizes with tetragonal symmetry in the space group
-
1Ternary Chalcopyrite Semiconductors: Growth Electronic Properties, and Applications, 1975
-
3Theory of the band-gap anomaly in AB 𝐶 2 chalcopyrite semiconductorsPhys. Rev. B, 1984
-
4The Crystal Structure of Chalcopyrite CuFeS2Z. Kristall, 1932
The addition of a II-VI binary compound (II= V, Mn, Fe, Co, Ni, Zn, Cd) to chalcopyrite produces alloys of composition (I-III-VI2)1-x (II-VI)x, and changing the composition variable x, it is possible to find the following compounds in this system: I2-II-III2-VI5 (x = 1/3), I-II-III-VI3 (x = 1/2), and I-II2-III-VI4 (x = 2/3), among others. These families of compounds fulfill the rules of formation of adamantane compounds and belong to the normal semiconductor compound families 5. According to these rules, the cation substitution is carried out in such a way that an average number of four valence electrons per atomic site is maintained and in turn value of eight for the ratio between valence electrons to anions. Adamantane compounds are binary, ternary, or quaternary normal tetrahedral structure compounds that are closely related to either cubic or hexagonal diamond 5. In our laboratories, we have been studying these type of alloys from its synthesis, thermal and magnetic properties as well as their crystal structures 6-13. Due to the great variety of possible compositions, these materials can be useful for applications such as tunable semiconductors 14, photovoltaics 15, non-linear optics 16, thermoelectrics 17, and particularly as spintronic device 18 due to the discovery of room-temperature ferromagnetism and super-paramagnetism in some of these materials 19.
-
5Wurzite and Sphalerite StructuresIntermetallic Compounds, 1995
-
5Wurzite and Sphalerite StructuresIntermetallic Compounds, 1995
-
6A comparative Study of (Cu-III-Se2)x -(FeSe)1-x Alloys (III: Al, Ga, In) (0 ≤ x ≤ 1) by X-Ray Diffraction, Differential Thermal Analysis and Scanning Electron MicroscopyPhys. Status Solidi A, 2001
-
13Synthesis and Crystal Structure of Three New Quaternary Compounds in the system Cu- Mn-III-Se3 (III = Al, Ga, In)Mater. Res, 2018
-
14Earth Abundant Element Cu2Zn(Sn1-xGex)S4 Nanocrystals for Tunable Band Gap Solar Cells: 6.8% Efficient Device FabricationChem. Mater, 2011
-
15Fabrication of 7.2% Efficient CZTSSe Solar Cells Using CZTS NanocrystalsJ. Am. Chem. Soc, 2010
-
16Electronic, optical and lattice dynamic properties of the novel diamond-like semiconductors Li2CdGeS4 and Li2CdSnS4J. Phys. Condens. Matter, 2011
-
17Thermoelectric transport properties of CuFeInTe3J. Alloys Compd, 2015
-
18New Materials for SpintronicsMRS Bull, 2003
-
19Superparamagnetism in CuFeInTe3 and CuFeGaTe3 alloysPhys. Status Solidi A, 2012
In particular, the ternary chalcopyrite semiconductor CuInSe2 is one of
the most studied materials due to its high optical absorption coefficient (
-
20Crystal data for CuInSe2J. Appl. Cryst, 1973
-
12Phase Diagram of (CuInSe2)1-x (FeSe)x alloysJ. Alloys Compd, 2015
Table I
Comparative table of crystallographic parameters for (CuInSe2) 1−x (FeSe) x alloys with x = 0, 1/3, 1/2, 2/3
Comparative table of crystallographic parameters for (CuInSe2) 1−x (FeSe) x alloys with x = 0, 1/3, 1/2, 2/3
| x | Alloy | SG | a (Å) | c (Å) | V Å3) | Cu-Se (Å) | Fe-Se (Å) | In-Se (Å) | Ref. |
| 0 | CuInSe2 | I |
5.781(1) | 11.642(3) | 389.1(2) | 2.432(1) | - | 2.591(1) | [21] |
| 1/3 | Cu2FeIn2Se5 | P |
5.7790(2) | 11.6093(5) | 387.71(3) | 2.431(5) | 2.458(5) | 2.630(5) | [*] |
| ½ | CuFeInSe3 | P |
5.7762(3) | 11.5982(7) | 386.97(3) | 2.423(8) | 2.464(8) | 2.602(8) | [10] |
| 2/3 | CuFe2InSe4 | I |
5.7694(3) | 11.495(1) | 382.62(4) | 2.432(5) | 2.488(5) | 2.576(5) | [11] |
For this reason, to derive a model that explains well all the X-ray diffraction peaks observed in the powder pattern of this compound, a detailed structural analysis of the Cu2FeIn2Se5alloy using powder X-ray diffraction was performed. The structure of the quaternary Cu2FeIn2Se5completes the phase transition produced in the (CuInSe2)1-x (FeSe)xsystem between the values x = 0 to x = 2/3.
2.Experimental
2.1.Synthesis
Starting materials (Cu, Al, Ta, and Se) with nominal purity of 99.99 wt. % in the stoichiometric ratio were mixed in an evacuated (10-4 Torr) and sealed quartz tube with the inner walls previously carbonized to prevent the chemical reaction of the elements with quartz Polycrystalline ingots of about 1 g were prepared by the melting and annealing technique. The quartz ampoule is heated until 493 K (melting point of Se), keeping this temperature for 48 h and shaking all the time using an electromechanical motor. This procedure guarantees the formation of binary species at low temperatures avoiding the existence of Se free gas at high temperature, which could produce explosions or Se deficiency in the ingot. Then the temperature was slowly increased until 1423 K, with the mechanical shaker always connected for better mixing of the components. After 24 h, the cooling cycle begins until the anneal temperature (800 K) with the mechanical shaker is disconnected. The ampoule is keeping at the annealing temperature for 1 month to assure the thermal equilibrium. Then the furnace is switching off. This preparation method has proven to give good results 6,12.
-
6A comparative Study of (Cu-III-Se2)x -(FeSe)1-x Alloys (III: Al, Ga, In) (0 ≤ x ≤ 1) by X-Ray Diffraction, Differential Thermal Analysis and Scanning Electron MicroscopyPhys. Status Solidi A, 2001
-
12Phase Diagram of (CuInSe2)1-x (FeSe)x alloysJ. Alloys Compd, 2015
2.2.Scanning Electron Microscopy (SEM)
Stoichiometric relations of the samples were investigated by scanning electron microscopy (SEM) technique, using a Hitachi S2500 equipment. The microchemical composition was found by an energy-dispersive X-ray spectrometer (EDS) coupled with a computer-based multichannel analyzer (MCA, Delta III analysis, and Quantex software, Kevex). For the EDS analysis, K α lines were used. The accelerating voltage was 15 kV. The samples were tilted 35 degrees. A standardless EDS analysis was made with a relative error of ±5-10% and detection limits of the order of 0.3 wt %, where the k-ratios are based on theoretical standards. Table IIshows the experimental stoichiometry of the sample Cu2FeIn2Se5.
Table II
SEM experimental results for the sample Cu2FeIn2Se5.
SEM experimental results for the sample Cu2FeIn2Se5.
| Composition | MW (g) | Nominal Stoichiometry (%) | Experimental Stoichiometry (%) |
| Cu2FeIn2Se5 | 807.38 | Cu = 20.0 | Cu = 20:4 ± 0:2 |
| Fe = 10.0 | Fe = 09:8 ± 0:2 | ||
| In = 20.0 | In = 19:9 ± 0:2 | ||
| Se = 50.0 | Se = 49:9 ± 0:5 |
2.3.Differential Thermal Analysis (DTA)
Differential Thermal Analysis (DTA) measurements were carried out in a fully
automatic Perkin-Elmer apparatus, which consists of a Khantal resistance furnace
(Tmax = 1650 K) equipped with Pt/Pt-Rh thermocouples and an
informatics system for the automatic acquisition data. The internal standard
used was a high purity (99.99 wt. %) piece of gold. The temperature runs have
been performed from ambient temperature to 1400-1500 K, which is the recommended
operative limit. The heating rate is controlled electronically to 20
Kh-1; the cooling rate was given by the natural cooling of the
furnace after switching off. From the thermogram, transition temperatures are
manually obtained from the
2.4.X-ray powder diffraction
The X-ray powder diffraction data were collected at room temperature, in a θ/ θ
reflection mode using a Siemens D5005 diffractometer equipped with an X-ray tube
(CuK
3. Results and discussion
3.1.Differential thermal analysis
In Fig. 1, the thermogram for sample Cu2FeIn2Se5is displayed.
Thumbnail
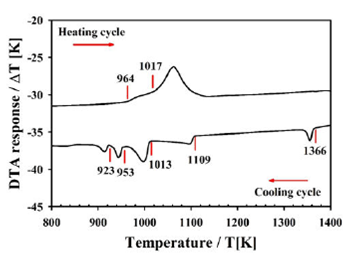
Figure 1
DTA response of sample Cu2FeIn2Se5.
DTA response of sample Cu2FeIn2Se5.
In the heating cycle, it can be observed two thermal transitions at 1017 and 964
K. The shape of the peak is typical of an incongruent melting point where the
solid phase transits to a solid + liquid region at 964 K and then to a liquid
phase (melting) at 1017 K. However, in the cooling cycle, up to five thermal
transitions are observed. The fact that only two thermal transitions are
observed in the heating cycle and five in the cooling is probably due to the
difference between the heating and cooling rates in competition with the
velocity of the thermal transitions. The heating rate is electronically fixed at
10 K/min, whereas the cooling rate is variable, given by the natural cooling of
the furnace after switching off. Transitions solid-to-liquid (and viceversa) are
faster than solid-to-solid and involve higher energies (variation in the
enthalpy,
The high-temperature transition at 1366 K in the cooling, coincides with the
melting point of FeSe reported as 1348 K 22 suggesting that, at this temperature, the liquid
phase undergoes to a liquid + FeSe region. The liquid + FeSe region is wide,
from 1366 K to 1109 K (257 degrees). At 1109 K, the liquid phase solidifies,
possibly in the disordered sphalerite β- phase accompanied by FeSe-phase. At
1013 K, the semi-ordered
-
22The fese (ironselenium) systemJ. Ph. Equilibria, 1991
Thumbnail
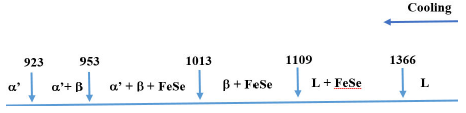
Figure 2
Schematic illustration of thermal transitions for the sample Cu2FeIn2Se5 in the cooling cycle.
Schematic illustration of thermal transitions for the sample Cu2FeIn2Se5 in the cooling cycle.
3.2.X-ray powder diffraction analysis
Figure 3 shows the resulting X-ray powder
pattern for the Cu2FeIn2Se5’ compound. When the
2θ positions of the 20 first peaks in the diffraction pattern are introduced
into the auto-indexing program Dicvol04 23, a tetragonal cell of dimensions a = 5.780(1) Å, c
= 11.610(2) Å is obtained. These parameters are similar in magnitude to the
parent’s chalcopyrite structure CuInSe221 and P-chalcopyrite structure
CuFeInSe310.
The systematic absence condition in the general reflections of the type hkl
indicating a P-type cell, and the hhl:l = 2n and 00l:l = 2n conditions suggests
the extension symbol
-
23Powder patter indexing with the dichotomy methodJ. Appl. Cryst, 2004
-
21The crystal structures of CuInSe2 and CuInTe2Mater. Res. Bull, 1992
-
10Crystal structure of CuFeInSe3 from X-ray powder diffraction dataPhys. Status Solidi A, 2007
-
10Crystal structure of CuFeInSe3 from X-ray powder diffraction dataPhys. Status Solidi A, 2007
-
24Crystal structures of two quenched Cu-In-Se phasesCryst. Res. Technol, 1988
Table IIIshows the 6 better models used in the cation distribution analysis on the available Wyckoff positions. In this Table the Rietveld refinement 25 results are shown. Many other tests were performed where the Cu+ cations were moved from the origin (2e), and Wyckoff positions (2a) and (2c) were used for the cations distribution, but only with poor results. The final model was confirmed by checking the chemical sense of the structure in terms of its distances and bond angles.
-
25A profile refinement method for nuclear and magnetic structuresJ. Appl. Cryst, 1969
Table III
Cation distribution models in the Rietveld refinement of the quaternary alloy Cu2FeIn2Se5.
Cation distribution models in the Rietveld refinement of the quaternary alloy Cu2FeIn2Se5.
| Model |
(2e) 0,0,0 |
(2a) 0,0,1/4 |
(2b) 1/2,0,1/4 |
(2c) 1/2,1/2,1/4 |
(2d) 0,1/2,1/4 |
(2f ) 1/2,1/2,0 |
(8n) x, y, z |
Rp | Rwp | S |
| 1 | Cu1 | - | Fe1 | - | In1 | M | Se | 11.0 | 16.3 | 2.6 |
| 2 | Cu1 | - | Fe1 | - | M | In1 | Se | 11.2 | 15.9 | 2.6 |
| 3 | Cu1 | - | In1 | - | Fe1 | M | Se | 7.8 | 8.8 | 1.4 |
| 4 | Cu1 | - | In1 | - | M | Fe1 | Se | 11.4 | 17.1 | 2.8 |
| 5 | Cu1 | - | M | - | Fe1 | In1 | Se | 30.6 | 41.2 | 6.6 |
| 6 | Cu1 | - | M | - | In1 | Fe1 | Se | 29.4 | 40.1 | 6.5 |
The program Fullprof 26 was employed for the Rietveld refinement analyzes. In each case, the angular dependence was described by the usual constrain imposed by the Cagliotti’s formula 27, and the peak shapes were described by the Thompson-Cox-Hastings pseudo-Voigt profile function 28. The background was described by the automatic interpolation of 67 points throughout the whole pattern. One overall isotropic temperature factor was refined to describe the thermal motion of the atoms. Model 3 showed the best fit and the Rietveld refinement results are shown in Table IV. Figure 3 shows the Rietveld refinement plot for the quaternary compound Cu2FeIn2Se5. Table V shows the atomic coordinates, isotropic temperature factor, bond distances, and angles for the new compound.
-
26Fullprof ver. 7.3, Laboratoire Léon Brillouin, 2020
-
27Choice of collimators for a crystal spectrometer for neutron diffractionNucl. Instrum, 1958
-
28Rietveld refinement of Debye-Scherrer synchrotron X-ray data from Al2O3J. Appl. Cryst, 1987
Table IV
Rietveld refinement results for Cu2FeIn2Se5.
Rietveld refinement results for Cu2FeIn2Se5.
| Molecular formula | Cu2FeIn2Se5 | wavelength (CuKα) | 1.54056 Å |
| Molecular weight (g/mol) | 807.38 | data range 2θ (◦) | 10-100 |
| a (Å) | 5.7790(2) | step size 2θ(◦) | 0.02 |
| c (Å) | 11.6093(8) | counting time (s) | 40 |
| c/a | 2.00 | step intensities | 4501 |
| V (Å3) | 387.71(3) | independent reflections | 152 |
| Z | 1.6 (8/5) | Rp (%) | 7.8 |
| Crystal system | tetragonal | Rwp (%) | 8.8 |
| Space group | P |
Rexp (%) | 6.2 |
| dcalc (g/cm−3) | 5.55 | RB (%) | 7.0 |
| Temperature (K) | 298(1) | S | 1.4 |
Thumbnail
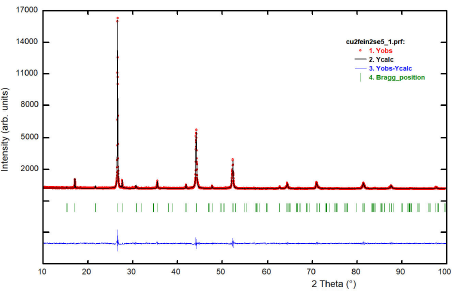
Figure 3
A plot illustrating the final Rietveld refinement of Cu2FeIn2Se5. The bars in the graphic symbolize the Bragg peak positions. The lower trace is the difference curve between observed and calculated patterns.
A plot illustrating the final Rietveld refinement of Cu2FeIn2Se5. The bars in the graphic symbolize the Bragg peak positions. The lower trace is the difference curve between observed and calculated patterns.
Table V
Atomic coordinates, occupancy factors, isotropic temperature factors, bond, and angle distances for Cu2FeIn2Se5, derived from the Rietveld refinement.
Atomic coordinates, occupancy factors, isotropic temperature factors, bond, and angle distances for Cu2FeIn2Se5, derived from the Rietveld refinement.
| Atom | Ox. | Wyck. | x | y | z | foc | B (Å2) |
| Cu1 | +1 | 2e | 0 | 0 | 0 | 1 | 0.51(5) |
| Fe | +2 | 2d | 0 | 1/2 | 1/4 | 0.8 | 0.51(5) |
| Cu2 | +1 | 2d | 0 | 1/2 | 1/4 | 0.1 | 0.51(5) |
| In2 | +3 | 2d | 0 | 1/2 | 1/4 | 0.1 | 0.51(5) |
| In1 | +3 | 2b | 1/2 | 0 | 1/4 | 1 | 0.51(5) |
| Cu3 | +1 | 2f | 1/2 | 1/2 | 0 | 0.5 | 0.51(5) |
| In3 | +3 | 2f | 1/2 | 1/2 | 0 | 0.5 | 0.51(5) |
| Te | -2 | 8n | 0.2306(7) | 0.2568(7) | 0.1197(5) | 1 | 0.51(5) |
| Cu1-Se | 2.431(5) | Fe1-Se | 2.458(5) | In1-Sei | 2.630(5) | ||
| Seii-Cu1-Se | 109.1(2) x 4 | Seii-Cu1-Seiii | 110.3(1) x 2 | Se-Fe-Seiv | 114.3(2) x 4 | ||
| Sevi-In1-Sei | 111.3(1) x 2 | Sevi-In1-Sevii | 109.8(1) x 2 | Se-Fe-Sev | 104.0(1) x 2 | ||
| Sevi-In1-Se | 107.4(1) x 2 | Seviii-M-Se | 107.8(2) x 4 | Seviii-M-Seix | 113.0(1) x 2 |
Cu2FeIn2Se5is a normal adamantane structure
compound 5, and consists of a
three-dimensional arrangement of distorted CuSe4, FeSe4
and InSe4 tetrahedral connected by common faces (Fig. 4b). In this compound, as in the related
CuFeInSe3, occurs a degradation of symmetry from the chalcopyrite
structure
-
5Wurzite and Sphalerite StructuresIntermetallic Compounds, 1995
-
10Crystal structure of CuFeInSe3 from X-ray powder diffraction dataPhys. Status Solidi A, 2007
Thumbnail
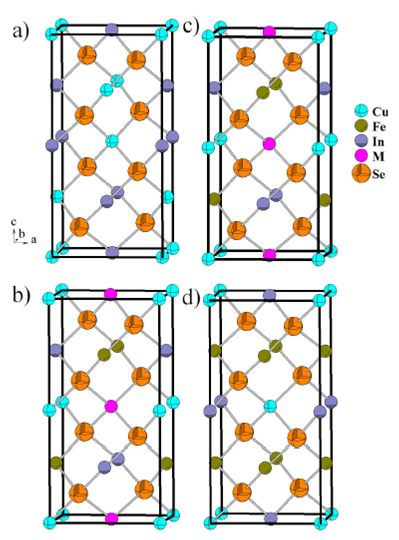
Figure 4
a) CuInSe2 (I 4 2d), b) Cu2FeIn2Se5 (P 4 2c) c) CuFeInSe3 (P¹42c) d) CuFe2InSe4 (I 4 2m) Unit cell diagram, in the ca plane, for the chalcopyrite a) CuInSe2 (I 4 2d) (x = 0), compared with the P-chalcopyrite structures (P 4 2c) b) Cu2FeIn2Se5 (x = 1=3) and c) CuFeInSe3 (x = 1=2), and the stannite structure d) CuFe2InSe4 (I 4 2m)) (x = 2=3).
a) CuInSe2 (I 4 2d), b) Cu2FeIn2Se5 (P 4 2c) c) CuFeInSe3 (P¹42c) d) CuFe2InSe4 (I 4 2m) Unit cell diagram, in the ca plane, for the chalcopyrite a) CuInSe2 (I 4 2d) (x = 0), compared with the P-chalcopyrite structures (P 4 2c) b) Cu2FeIn2Se5 (x = 1=3) and c) CuFeInSe3 (x = 1=2), and the stannite structure d) CuFe2InSe4 (I 4 2m)) (x = 2=3).
The tetrahedra containing the Cu1 atoms [mean Se...Se distance 3.970(6) Å] are lightly smaller than those containing the M (Cu2 or In2) [means Se...Se distance 4.108(6) Å], Fe atoms [mean Se...Se distance 4.012(6) Å], and In1 atoms [mean Se...Se distance 4.294(6) Å] respectively.
The interatomic distances are shorter than the sum of the respective ionic radii for structures tetrahedrally bonded 29. The Cu-Se [2.431(5) Å], Fe-Se [2.458(5) Å] and In-Se [2.630(5) Å], bond distances compare well to those observed in some other adamantane structure compounds such as CuInSe2 (2.432-2.591Å) 21, Cu2SnSe3 (2.415 Å) 30, CuFeInSe3 (2.421-2.520 Å) (10), CuFe2InSe4 (2.417-2.50 Å) 11, CuMn2InSe4 (2.447-2.594 Å) 31, CuMnInSe3 (2.428 -2.614 Å) 13, CuVInSe3 (2.518−2.530 Å) 32 and Cu3In7Se12 (2.419−2.523 Å) 33.
-
29Revised effective ionic radii and systematic studies of interatomic distances in halides and chalcogenidesActa Cryst. A, 1976
-
21The crystal structures of CuInSe2 and CuInTe2Mater. Res. Bull, 1992
-
30Crystal structure refinement of the semiconducting compound Cu2SnSe3 from X-ray powder diffraction dataMater. Res. Bull, 2003
-
11Crystal structure of CuFe2InSe4 from X-ray powder diffractionJ. Alloys Compd, 2008
-
31Crystal structure of the new diamond-like semiconductor CuMn2InSe4Bull. Mater. Sci., 2016
-
13Synthesis and Crystal Structure of Three New Quaternary Compounds in the system Cu- Mn-III-Se3 (III = Al, Ga, In)Mater. Res, 2018
-
32Preparation, differential thermal analysis and crystal structure of the new quaternary compound CuVInSe3Rev. Mex. Fis, 2018
-
33Crystal structure of the ternary semiconductor Cu2In14/4*4/3 Se8 determined by X-ray powder diffraction dataPowder Diffr., 2018
The chemical structural model was checked by the analysis of the interatomic
distances using the BVS formula based on the bond-strength examination 34,35. The atomic valence of an
atom is assumed to be distributed between the bonds that it forms. BVS of atom
𝑖, denoted 𝑉 𝑖 , is then
-
34Bond-valence parameters obtained from a systematic analysis of the Inorganic Crystal Structure DatabaseActa Cryst. B, 1985
-
35Bond-valence parameters for solidsActa Cryst. B, 1991
-
34Bond-valence parameters obtained from a systematic analysis of the Inorganic Crystal Structure DatabaseActa Cryst. B, 1985
-
35Bond-valence parameters for solidsActa Cryst. B, 1991
Table VI
Bond Valence Sum (BVS) calculations for Cu2FeIn2Se5.
Bond Valence Sum (BVS) calculations for Cu2FeIn2Se5.
| Cu | Fe | In | M | Se | |
| V i | 1.4 | 2.3 | 3.1 | 1.9 | 2.2 |
| formal | |||||
| oxidation state | 1 | 2 | 3 | 2 | 2 |
Figure 4 shows the crystal structure
evolution of (CuInSe2)1-x (FeSe)xalloys, which
confirms the phase diagram proposed for this system 12. Starting from the chalcopyrite structure
(Fig. 4a) CuInSe2 with space
group
-
12Phase Diagram of (CuInSe2)1-x (FeSe)x alloysJ. Alloys Compd, 2015
From the magnetic point of view, these materials -due to their cationic ordering- are diamagnetic, ferromagnetic, and ferromagnetic, respectively 6,12.
-
6A comparative Study of (Cu-III-Se2)x -(FeSe)1-x Alloys (III: Al, Ga, In) (0 ≤ x ≤ 1) by X-Ray Diffraction, Differential Thermal Analysis and Scanning Electron MicroscopyPhys. Status Solidi A, 2001
-
12Phase Diagram of (CuInSe2)1-x (FeSe)x alloysJ. Alloys Compd, 2015
4.Conclusions
A new quaternary chalcogenide, belonging to the system
(CuInSe2)1-x (FeSe)xwith x = 1/3, has been
synthesized and structurally characterized. The DTA indicates that this compound
melts at 1017 K. The crystal structure solution of the semiconductor alloy
Cu2FeIn2Se5was resolved in the space group
Acknowledgments
This work was partially done into G.E. Delgado visit at the Universidad de Antofagasta, supported by MINEDUC-UA project, code ANT 1856.
References
-
1J. L. Shay and J. H. Wernick, Ternary Chalcopyrite Semiconductors: Growth Electronic Properties, and Applications (Pergamon Press, Oxford, 1975), https://doi.org/10.1016/C2013-0-02602-3. Links
-
2B. R. Pamplin, T. Kiyosawa, and K. Masumoto, Ternary chalcopyrite compounds, Prog. Cryst. Growth Charact. 1 (1979) 331, https://doi.org/10.1016/0146-3535(79)90002-9. Links
-
3J. E. Jaffe and A. Zunger, Theory of the band-gap anomaly in AB 𝐶 2 chalcopyrite semiconductors, Phys. Rev. B 29 (1984) 1882, https://doi.org/10.1103/PhysRevB.29.1882. Links
-
4L. Pauling and L. O. Brockway, The Crystal Structure of Chalcopyrite CuFeS2, Z. Kristall. 82 (1932) 188, https://doi.org/10.1524/zkri.1932.82.1.188. Links
-
5E. Parthé, Wurzite and Sphalerite Structures, in Intermetallic Compounds, edited by J. H. Westbrook and R. L. Fleischer, Vol. 1 (Wiley, Chichester, 1995). Links
-
6P. Grima-Gallardo et al., A comparative Study of (Cu-III-Se2)x -(FeSe)1-x Alloys (III: Al, Ga, In) (0 ≤ x ≤ 1) by X-Ray Diffraction, Differential Thermal Analysis and Scanning Electron Microscopy, Phys. Status Solidi A 187 (2001) 395, https://doi.org/10.1002/1521-396X(200110)187:2<395::AID-PSSA395>3.0.CO;2-2. Links
-
7P. Grima-Gallardo et al., X-Ray Diffraction (XRD), Differential Thermal Analysis (DTA), and Scanning Electron Microscopy (SEM) of (CuInSe2)1-x (Vse)x Alloys (0 ≤ x ≤ 0.5), Phys. Status Solidi A 193 (2002) 217, https://doi.org/10.1002/1521-396X(200209)193:2<217::AID-PSSA217>3.0.CO;2-O. Links
-
8P. Grima-Gallardo et al., The (CuGaSe2)1-x (MgSe)x alloy system (0 ≤ x ≤ 0.5): X-ray diffraction, energy dispersive spectrometry and differential thermal analysis, Phys. Status Solidi B 241 (2004) 1789, https://doi.org/10.1002/pssb.200302010. Links
-
9P. Grima-Gallardo et al., Preparation and investigation (Cu-III-Se2)1-x (NbSe)x alloys (III: Ga, In) with x = 1/2, Phys. Status Solidi A 204 (2007) 1093, https://doi.org/10.1002/pssa.200622568. Links
-
10A. J. Mora, G. E. Delgado, and P. Grima-Gallardo, Crystal structure of CuFeInSe3 from X-ray powder diffraction data, Phys. Status Solidi A 204 (2007) 547, https://doi.org/10.1002/pssa.200622395. Links
-
11G. E. Delgado, A. J. Mora, P. Grima-Gallardo, and M. Quintero, Crystal structure of CuFe2InSe4 from X-ray powder diffraction, J. Alloys Compd. 454 (2008) 306, https://doi.org/10.1016/j.jallcom.2006.12.057. Links
-
12P. Grima-Gallardo et al., Phase Diagram of (CuInSe2)1-x (FeSe)x alloys, J. Alloys Compd. 630 (2015) 146, https://doi.org/10.1016/j.jallcom.2015.01.015. Links
-
13G. E. Delgrado, J. A. Flores-Cruz, P. Grima-Gallardo, M. Quintero, and A. Moreno, Synthesis and Crystal Structure of Three New Quaternary Compounds in the system Cu- Mn-III-Se3 (III = Al, Ga, In), Mater. Res. 21 (2018) e20160748, https://doi.org/10.1590/1980-5373-mr-2016-0748. Links
-
14G. M. Ford, Q. Guo, R. Agrawal, and H. W. Hillhouse, Earth Abundant Element Cu2Zn(Sn1-xGex)S4 Nanocrystals for Tunable Band Gap Solar Cells: 6.8% Efficient Device Fabrication, Chem. Mater. 23 (2011) 2626, https://doi.org/10.1021/cm2002836. Links
-
15Q. Guo et al., Fabrication of 7.2% Efficient CZTSSe Solar Cells Using CZTS Nanocrystals, J. Am. Chem. Soc. 132 (2010) 17384, https://doi.org/10.1021/ja108427b. Links
-
16Y. Li et al., Electronic, optical and lattice dynamic properties of the novel diamond-like semiconductors Li2CdGeS4 and Li2CdSnS4, J. Phys. Condens. Matter 23 (2011) 225401, https://doi.org/10.1088/0953-8984/23/22/225401. Links
-
17H. Cabrera et al., Thermoelectric transport properties of CuFeInTe3, J. Alloys Compd. 651 (2015) 490, https://doi.org/10.1016/j.jallcom.2015.08.128. Links
-
18S. A. Chambers and Y. K. Yoo, New Materials for Spintronics, MRS Bull. 28 (2003) 706, https://doi.org/10.1557/mrs2003.210. Links
-
19P. Grima-Gallardo et al., Superparamagnetism in CuFeInTe3 and CuFeGaTe3 alloys, Phys. Status Solidi A 209 (2012) 1141, https://doi.org/10.1002/pssa.201127663. Links
-
20J. Parkes, R. D. Tomlinson, and M. J. Hampshire, Crystal data for CuInSe2, J. Appl. Cryst. 6 (1973) 414, https://doi.org/10.1107/S0021889873009027. Links
-
21K. S. Knight, The crystal structures of CuInSe2 and CuInTe2, Mater. Res. Bull. 27 (1992) 161, https://doi.org/10.1016/0025-5408(92)90209-I. Links
-
22H. Okamoto, The fese (ironselenium) system, J. Ph. Equilibria 12 (1991) 383, https://doi.org/10.1007/BF02649932. Links
-
23A. Boultif and D. Louër, Powder patter indexing with the dichotomy method, J. Appl. Cryst. 37 (2004) 724, https://doi.org/10.1107/S0021889804014876. Links
-
24W. Hönle, F. Kühn, and U.-C. Boehnke, Crystal structures of two quenched Cu-In-Se phases, Cryst. Res. Technol. 23 (1988) 1347, https://doi.org/10.1002/crat.2170231027. Links
-
25H. M. Rietveld, A profile refinement method for nuclear and magnetic structures, J. Appl. Cryst. 2 (1969) 65, https://doi.org/10.1107/S0021889869006558. Links
-
26J. Rodríguez-Carvajal, Fullprof ver. 7.3, Laboratoire Léon Brillouin (CEA-CNRS), France(2020). Links
-
27G. Caglioti, A. Paoletti, and F. P. Ricci, Choice of collimators for a crystal spectrometer for neutron diffraction, Nucl. Instrum. 3 (1958) 223, https://doi.org/10.1016/0369- 643X(58)90029-X. Links
-
28P. Thompson, D. E. Cox, and J. B. Hastings, Rietveld refinement of Debye-Scherrer synchrotron X-ray data from Al2O3, J. Appl. Cryst. 20 (1987) 79, https://doi.org/10.1107/S0021889887087090. Links
-
29R. D. Shannon, Revised effective ionic radii and systematic studies of interatomic distances in halides and chalcogenides, Acta Cryst. A 32 (1976) 751, https://doi.org/10.1107/S0567739476001551. Links
-
30G. E. Delgado, A. J. Mora, G. Marcano, and C. Rincón, Crystal structure refinement of the semiconducting compound Cu2SnSe3 from X-ray powder diffraction data, Mater. Res. Bull. 38 (2003) 1949, https://doi.org/10.1016/j.materresbull.2003.09.017. Links
-
31G. E. Delgado and V. Sagredo, Crystal structure of the new diamond-like semiconductor CuMn2InSe4, Bull. Mater. Sci. 39 (2016) 1631, https://doi.org/10.1007/s12034-016-1323-7. Links
-
32G. Marroquín, G. E. Delgado, P. Grima-Gallardo, and M. Quintero, Preparation, differential thermal analysis and crystal structure of the new quaternary compound CuVInSe3, Rev. Mex. Fis. 64 (2018) 548, https://doi.org/10.31349/RevMexFis.64.548. Links
-
33G. E. Delgado, L. Manfredy, and S. A. López-Rivera, Crystal structure of the ternary semiconductor Cu2In14/4*4/3 Se8 determined by X-ray powder diffraction data, Powder Diffr. 33 (2018) 237, https://doi.org/10.1017/S0885715618000519. Links
-
34I. D. Brown and D. Altermatt, Bond-valence parameters obtained from a systematic analysis of the Inorganic Crystal Structure Database, Acta Cryst. B 41 (1985) 244, https://doi.org/10.1107/S0108768185002063. Links
-
35N. E. Brese and M. O.’Keeffe, Bond-valence parameters for solids, Acta Cryst. B 47 (1991) 192, https://doi.org/10.1107/S0108768190011041. Links