


 nueva página del texto (beta)
 Inglés (pdf)
 Artículo en XML
 Referencias del artículo
 Enviar artículo por email
 Citado por SciELO
  Similares en
SciELO
Similares en
SciELO 
 Permalink
1. Introduction
Construction of the magnificent archaeological site of Monte Albán, overlooking the Valley Oaxaca, began in 500 BC. It became the center of economic, political, and religious power of the Zapotec civilization that flourished until 700 AD when its slow decline began. At its peak it had a population of about 30,000. Monte Albán was the first urban complex in Meso America. Several causes of decline and dispersion of the population have been suggested: environmental factors, conflict with neighboring Mixtec civilization, fire, and social turmoil. It was not until 19-th century that local and European explorers began reporting of its existence. First detailed exploration of Monte Albán was carried by Leopoldo Batres (1902) during the presidency of Porfirio Díaz. Between 1930 and 1957 an extensive archaeological exploration was carried out under the leadership of Alfonso Caso. In 1987 Monte Albán was designated a UNESCO World Heritage Site. Archaeological and preservation work at Monte Albán still continues. The majestic site is an important tourist attraction.
As large subduction thrust earthquakes along the Pacific coast and intraslab events in the subducted Coos plate below the State of Oaxaca are relatively frequent, the archeological site must have been subjected to severe ground motion many times. Thus, it was not a surprise that the normal-faulting, intraslab earthquake of 8 September, 2017 (Mw 8.2) caused significant damage to the archaeological site of Monte Albán (Figure 1). Collapse of walls, and fractures and fissures in walls and structural elements were reported. Eleven monuments at the Monte Albán archaeological site suffered damage. The damage was partly attributed to previous poor interventions and lack of adequate attention and absence of maintenance over many years. An excellent and extensive report on earthquake recovery, stabilization, and conservation at Monte Albán and the neighboring monumental zone of Atzompa is given in Robles García et al. (2022). Previously, Monte Albán had suffered damage during the 30 September, 1999 (Mw7.5) earthquake (Robles García et al., 2009) which was also an intraslab event (Figure 1).
To understand the seismic hazard faced by the archaeological site and to adequately strengthen it against damage during future events, it is desirable to know the ground motions at Monte Albán during previous large earthquakes, especially those of 2017 and 1999, and exceedance rate of such motions. Unfortunately, there is no on-site recording of these earthquakes. No accelerograph was installed at Monte Albán in 1999. Although an accelerographic network was put in place in 2004, it was not in operation during 2011 - 2019.
There are, however, several accelerographs in and near the city of Oaxaca. One station, OXLC, located on hard Cantera rock, is 7 km from Monte Albán (Figure 1). Beginning June 1999, most of the significant earthquakes are well recorded at OXLC. The recordings at this nearby station provide first, but quite likely, lower estimate of ground motion at Monte Albán. A lower estimate is likely due to expected amplification of seismic waves caused by the location of Monte Albán on a hill, about 400 m above the floor of the central Valley of Oaxaca where OXLC is located (Figure 1).
If, however, we know the transfer function (i.e., spectral ratio) of ground motion at a site at Monte Albán with respect to OXLC, then the recordings at OXLC can be used to estimate the ground motion at this site of Monte Albán through the application of random vibration theory. We follow this methodology. OXLC is only 7 km from Monte Albán and mean H/V curve computed from 344 recordings at OXLC, reveals no significant site effect. Hence, it is an ideal reference station.
2. Recordings of Significant Recent Earthquakes at Las Canteras (OXLC)
The first recording at OXLC is from the 15/06/1999 (Mw6.9) Tehuacán earthquake. Table 1a lists the six earthquakes which produced the largest ground motion at OXLC (and, hence, we expect, also at Monte Albán) in the period 1999 – 2024. Four of the six events are normal-faulting intraslab and two are subduction, interface, thrust earthquakes. Figure 2 illustrates the accelerogram, velocity and displacement traces, as well as the Fourier acceleration spectra (FAS) of each of the six earthquakes. Peak ground acceleration (PGA), velocity (PGV), and displacement (PGD) values are compiled in Table 1b. As seen from Figure 2 and Table 1b, the PGA values during 30/09/1999, 08/09/2017, and 2020 earthquakes are very similar; PGV values are similar during 30/09/1999, 2012, 08/09/2017, and 2020; PGD is highest during 08/09/2017 while the values are similar during 2012 and 2020 earthquakes.
Correlation of damage (intensity) with PGA, PGV or PGD is not straightforward (e.g., Wald et al., 1999; Wu et al., 2003; Sokolov and Furumura, 2008). Let us assume that the ground motions parameters at MAPN are proportional to those at OXLC. (We come back to this issue in a later section). If PGA is mainly responsible for damage at Monte Albán, then the earthquakes of 30/09/1999, 08/09/2017, and 2020 should have been equally damaging. This was not the case: the damage was more severe in 08/09/2017 than in 1999. Just what happened in 2020 is not clear from the report of Robles García et al. (2022). If damage is related to PGV, then equal damage would have occurred in 2012, 08/09/2017, and 2020. Again, similar to 2020, there is no reports of damage in 2012. If PGD is the critical factor then the highest damage would have been expected in 2017 followed by 2012 and 2020 events.
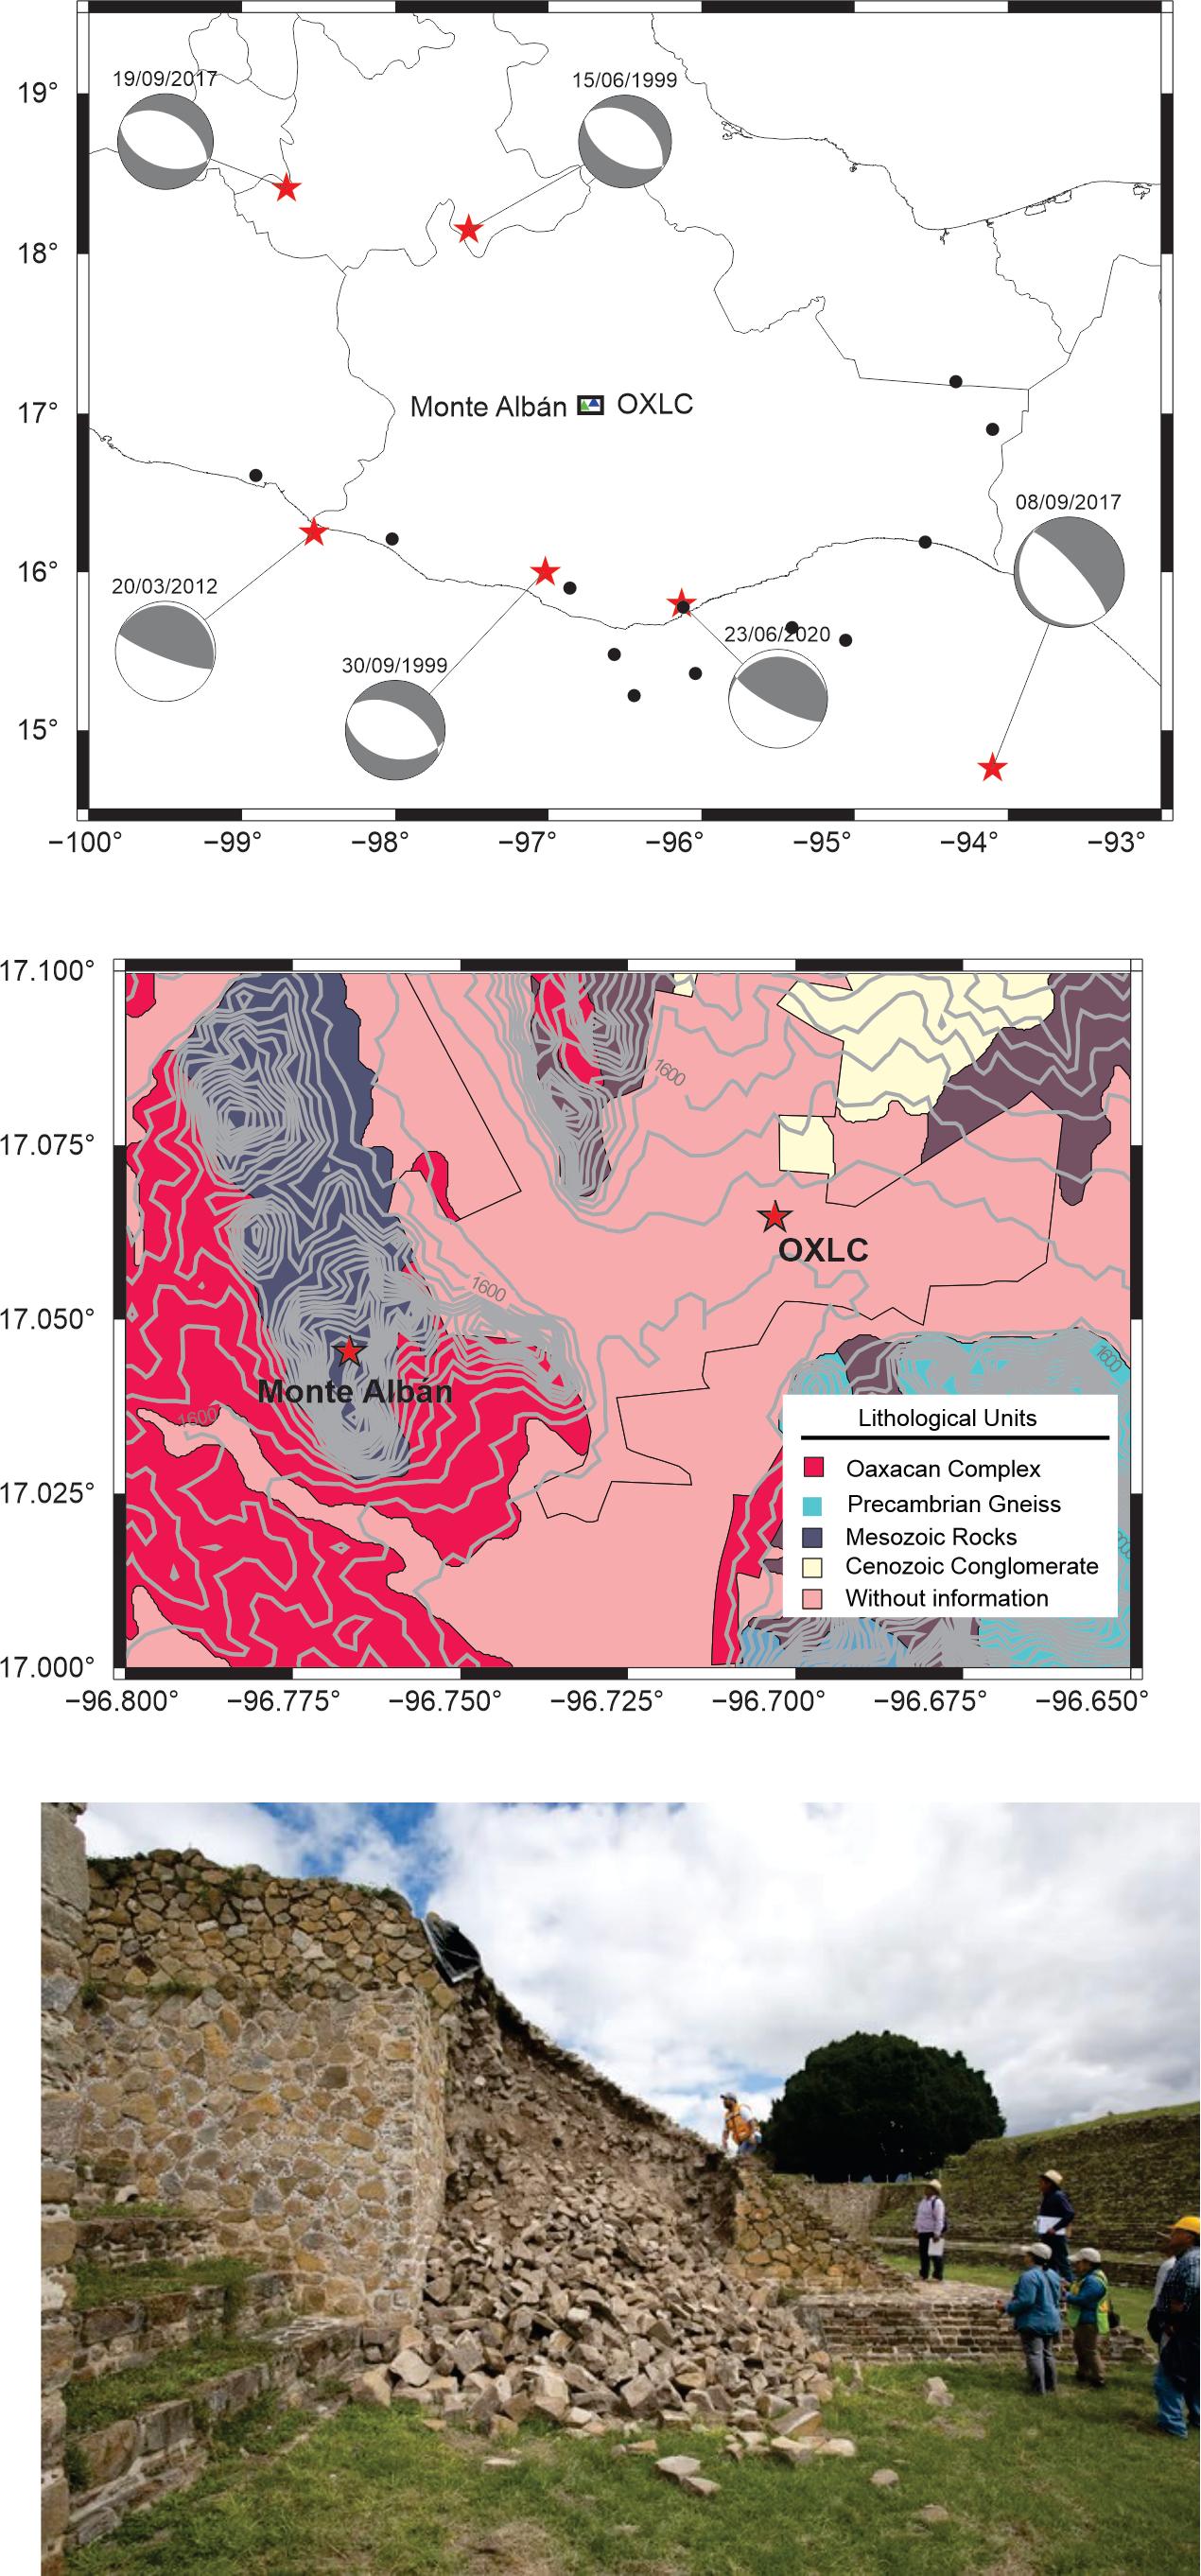
Figure 1 (Top) Map of south-central Mexico. Red star: location and focal mechanism of six, large earthquakes (four: normal faults; two: subduction thrust) (Table 1) whose recordings at OXLC are used to estimate ground motion at Monte Albán archaeological site. Earthquakes of 30/09/1999 and 08/09/2017 caused significant damage at Monte Albán. Black dots: events recorded both at OXLC and Monte Albán (Table 3) used to compute spectral ratios. (Middle) Lithological map of Monte Albán with superimposed elevation contours (m) (INEGI, 2014). Altitude of the base of Monte Albán is 378 m higher than OXLC. (Bottom) Collapsed walls of ball game court at Monte Albán during the 08/09/2017 (Mw8.2) earthquake (photo by Fidel Ugarte, reproduced from the report by Robles García et al., 2022).
Table 1a Six large earthquakes whose recordings at OXLC are used to estimate ground motions at North Platform, Monte Albán (MAPN) via spectral ratio and random vibration theory. Note that the earthquake of 23/06/2020 was also recorded at mid-height of MAPN.
| Event | Date | Lat (°N) | Long (°W) | H, km | Mw | Focal Mechanism | R to OXLC km | A to OXLC km | ||
|---|---|---|---|---|---|---|---|---|---|---|
| Φo | δo | λo | ||||||||
| 1 | 15/06/1999 | 18.15 | 97.52 | 60 | 6.9 | 309 | 40 | -82 | 159 | 147 |
| 2 | 30/09/1999 | 16.00 | 97.02 | 54 | 7.5 | 300 | 49 | -78 | 130 | 118 |
| 3 | 20/03/2012 | 16.25 | 98.53 | 20 | 7.5 | 296 | 10 | 95 | 216 | 215 |
| 4 | 08/09/2017 | 14.76 | 94.10 | 46 | 8.2 | 318 | 78 | -93 | 383 | 380 |
| 5 | 19/09/2017 | 18.41 | 98.71 | 57 | 7.1 | 300 | 44 | -83 | 263 | 257 |
| 6 | 23/06/2020 | 15.80 | 96.13 | 17 | 7.4 | 268 | 16 | 61 | 154 | 153 |
Table 1b PGA, PGV, and PGD at OXLC during the six large earthquakes.
| Event | Date | PGA at OXLC, cm/s² | PGV at OXLC, cm/s | PGD at OXLC, cm | ||||||
|---|---|---|---|---|---|---|---|---|---|---|
| NS | EW | Z | NS | EW | Z | NS | EW | Z | ||
| 1 | 15/06/1999 | 23.5 | 18.3 | 13.0 | 1.90 | 1.72 | 1.00 | 0.32 | 0.58 | 0.25 |
| 2 | 30/09/1999 | 70.1 | 74.7 | 48.3 | 5.02 | 4.90 | 4.04 | 2.64 | 2.09 | 2.26 |
| 3 | 20/03/2012 | 37.2 | 27.7 | 32.9 | 6.57 | 4.66 | 5.16 | 4.33 | 3.61 | 5.14 |
| 4 | 08/09/2017 | 58.6 | 102.3 | 67.5 | 7.64 | 9.06 | 6.20 | 14.1 | 9.34 | 7.26 |
| 5 | 19/09/2017 | 22.5 | 21.8 | 12.1 | 1.38 | 2.02 | 1.28 | 0.37 | 0.59 | 0.25 |
| 6 | 23/06/2020 | 72.5 | 82.9 | 30.4 | 8.54 | 10.0 | 6.10 | 3.47 | 4.61 | 4.34 |
Since all peak values at OXLC are high during 08/09/2017, greater damage during this event at MAPN is to be expected, followed by the 2020 event. PGA during 1999 is about twice the value during 2012, while PGV and PGD are greater during the latter event. Greater damage in 1999 than in 2012 would suggest that the intensity is better correlated with PGA than PGV and PGD. The high peak values during 2020 point to an event with greater damage potential than other events except for the earthquake of 2017. Lesser damage during 2020 event as compared to 1999, if true, may have been a consequence of the recovery and conservation efforts following the earthquakes of 30/09/1999 and 08/09/2017 which had adequately strengthened the vulnerable structures.
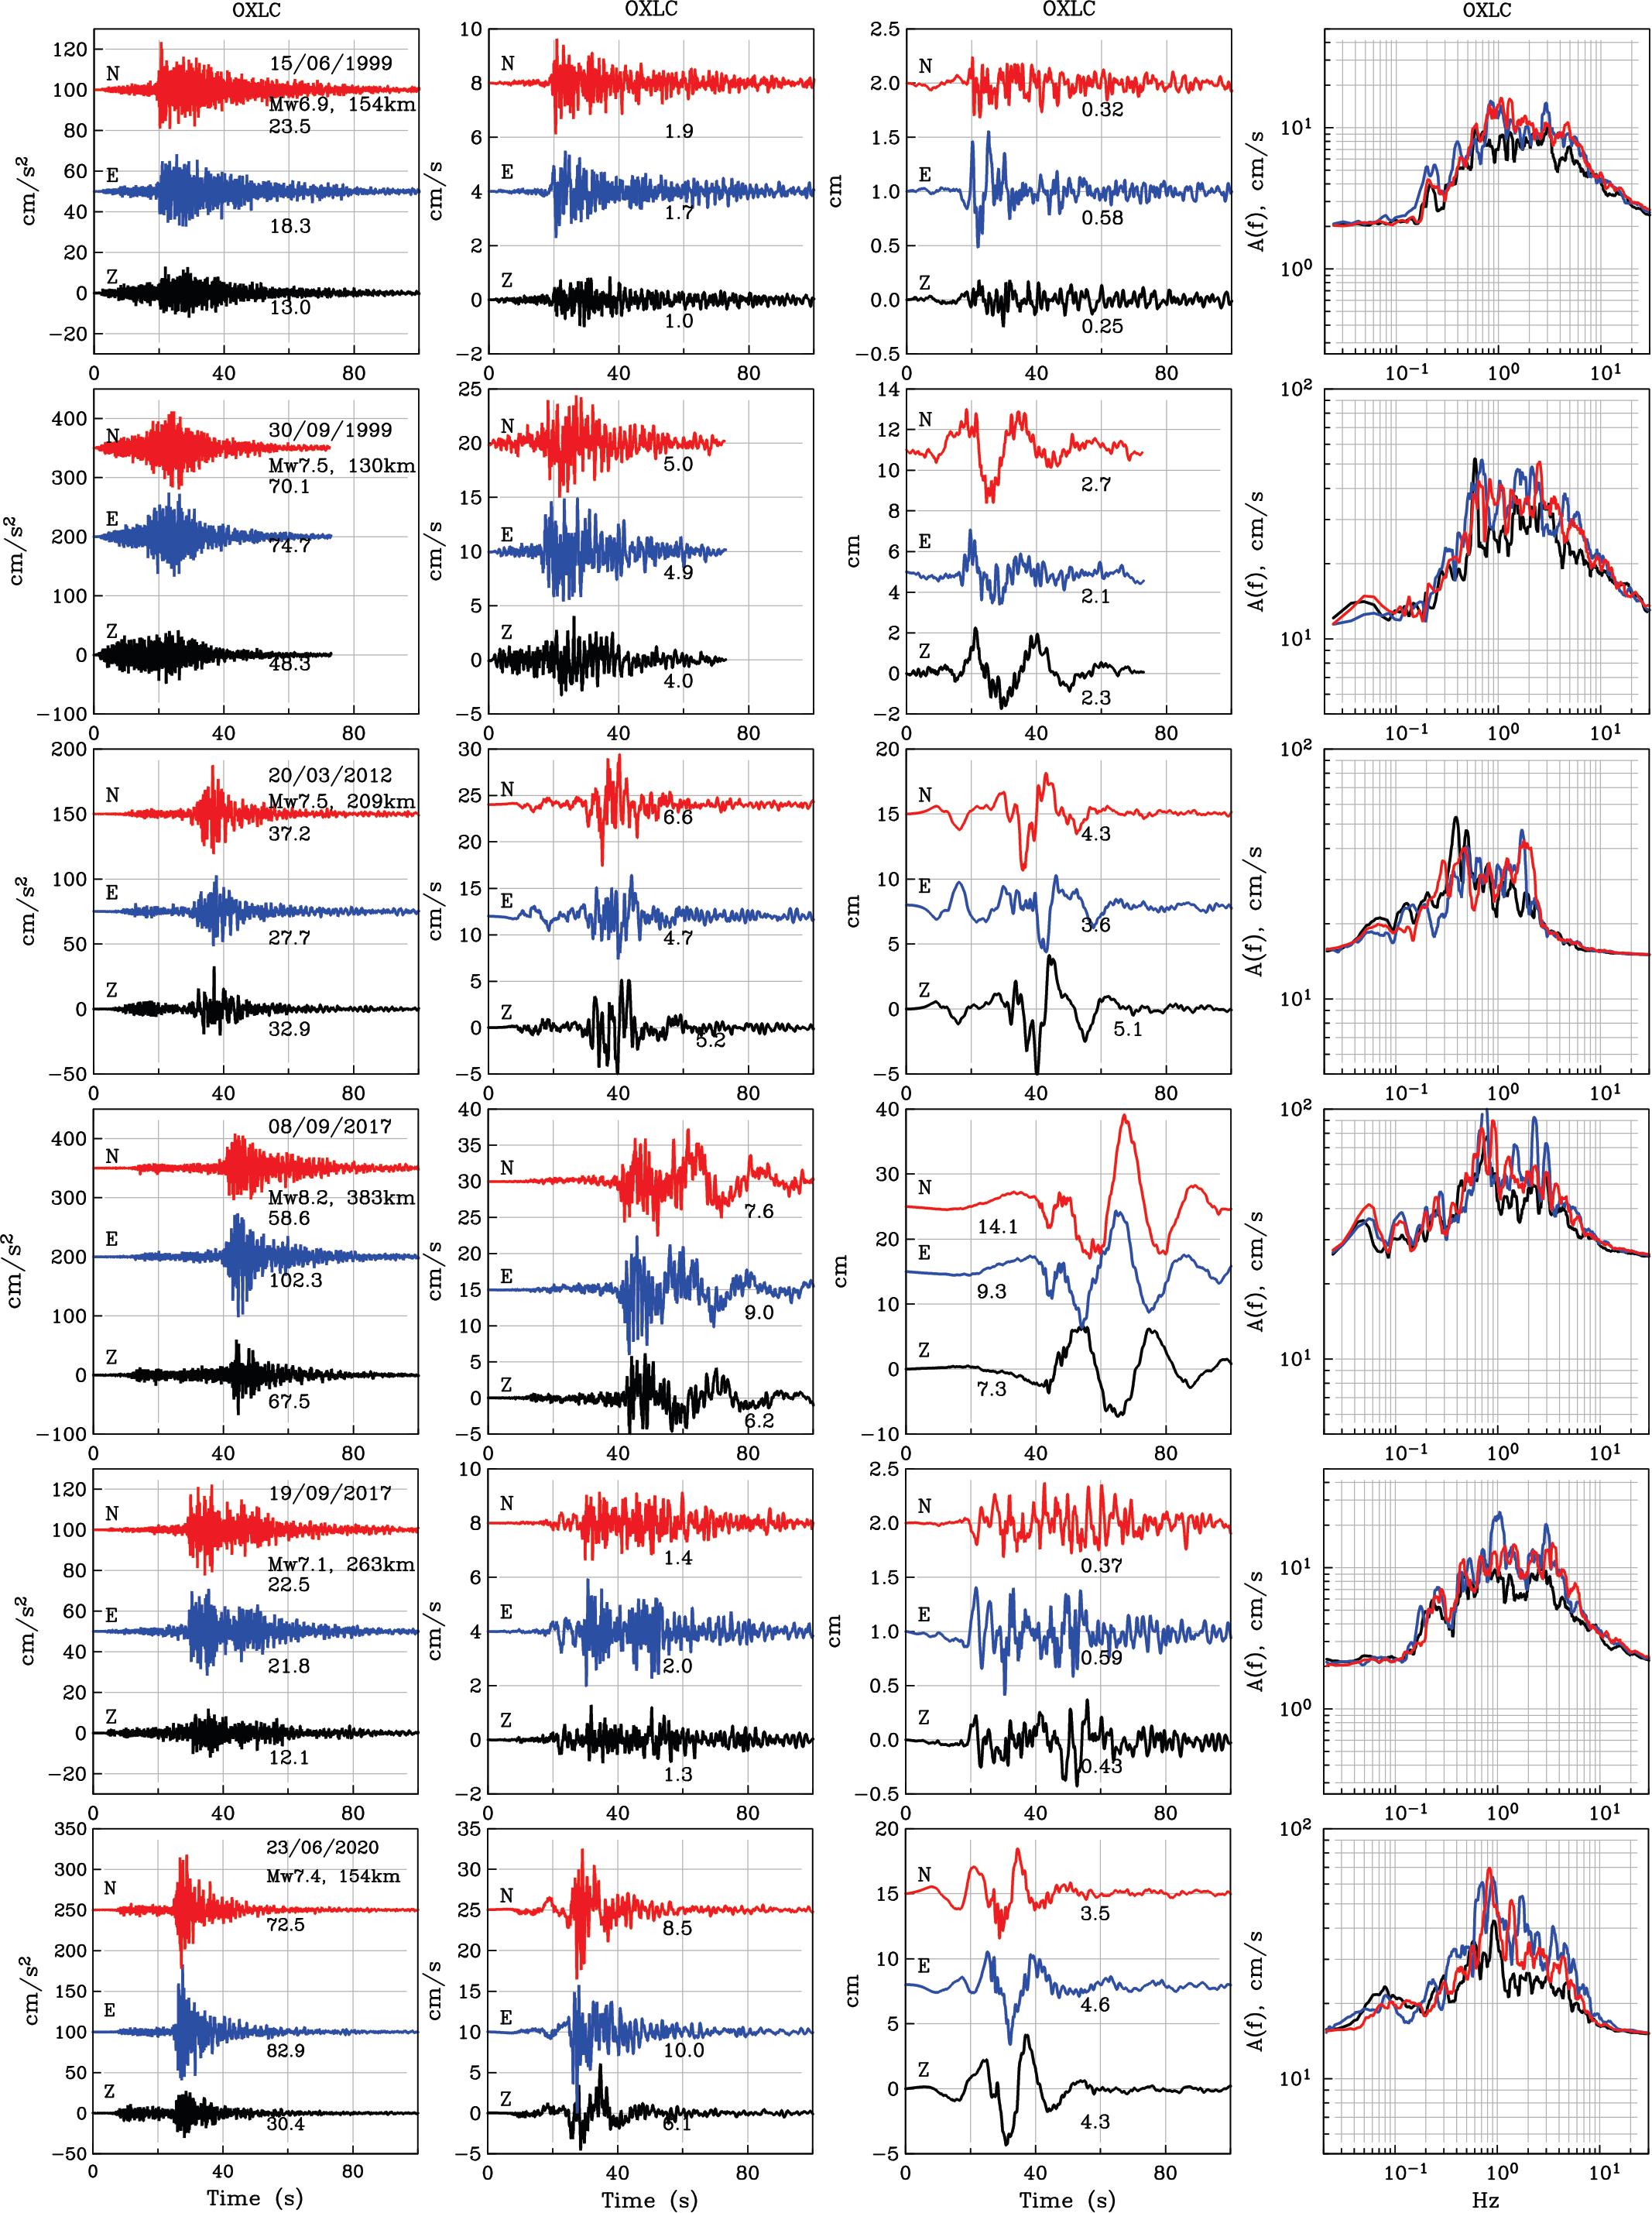
Figure 2 Ground motion at OXLC during six large earthquakes between 1999 and 2024. Acceleration, velocity, displacement, and Fourier acceleration spectrum of each event are plotted. Velocity and displacement were obtained by integration of the acceleration. Events of 08/09/2017 and 30/09/1999 stand out. Note large PGD during the 08/09/2017 earthquake. These two events caused significant damage to Monte Albán.
3. Accelerographic Network of Monte Albán
Damage during the 30/09/1999 earthquake led to the installation of a 12-channel accelerographic network on the North Platform of the Monte Albán (MAPN). It consisted of three external and one internal triaxial sensor (Table 2). The recordings were made at 100 samples/s. The sensors were installed at the base and the top of the structure. At mid-height both internal and external triaxial sensors were deployed (Figure 3). First available recording by the network dates back to 13/03/2004. The network stopped working in August 2011 due to maintenance problem. The instrumentation was rehabilitated in June 2019 but only with the triaxial internal sensor located at mid-height. This accelerograph recorded earthquakes until May 2023 after which it ceased to work. The instruments were withdrawn in August 2024. Presently, there is no seismic sensor in operation at the archaeological site.
Table 2 Location of strong-motion sensors deployed at North Platform, Monte Albán (MAPN). All sensors were in operation during 2004-2011. Only a triaxial sensor at mid-height was working during 2019-2023.
| Site | Lat °N | Lat°W | Height, m above MSL |
|---|---|---|---|
| Base | 17.04564 | 96.76665 | 1917 |
| Mid-height | 17.04560 | 96.76723 | 1926 |
| Mid-height, NE corner* | 17.04576 | 96.76734 | 1931 |
| Top | 17.04544 | 96.76741 | 1942 |
4. Estimation of Ground Motion at Monte Albán during Recent Large Earthquakes
Ground motions at Monte Albán may differ from those at OXLC because of topographic and local site effects (altitude above MSL: OXLC 1542 m, Monte Albán 1942 m; Figure 1, Table 2). Since ground motions at OXLC are known, we estimate the motions at Monte Albán using transfer functions between OXLC and Monte Albán and applying random vibration theory (see, Boore, 2003, for details). This methodology has been successfully used in Mexico (see, e.g., Ordaz et al., 2017) and elsewhere (Boore, 2003).
We estimate spectral ratios (also denoted here as transfer functions) between Monte Albán and OXLC using accelerograms of events recorded simultaneously at both sites.
4.1 Spectral Ratios between Monte Albán and OXLC
The ratios were computed for shallow (H ≤ 35 km) and deep (H > 35km) earthquakes separately. We selected 7 shallow and 5 deep events with good signal to noise ratio for the analysis (Table 3). Fourier spectrum of each component of each event was computed at OXLC and the stations of the MAPN (base, mid-height, and top). The time window chosen for spectral analysis bracketed 95% of the energy in the accelerograms beginning with the arrival of S-wave. A 5% cosine taper was applied before computing the spectrum which was then smoothed by a 1/6 octave filter. The horizontal components were grouped together. The horizontal and vertical ratios along with geometric mean and + one standard deviation curves for shallow and deep sources are plotted in Figures 4a and 4b, respectively. We note that: (1) The ratios for shallow and deep events are similar. (2) Horizontal components at the Monte Albán sites are amplified with respect to OXLC in the frequency range 1.5 Hz – 20 Hz; the peak amplification at the base and mid-height is ~ 3 and at the top ~ 10. The peaks occur at f ~ 6 Hz. (3) The amplifications of the vertical components are less than that of the corresponding horizontal components. (4) The ratios show a de-amplification between 0.2 and 1.5 Hz.
Theoretical calculations show that topographic high (ridge) causes amplification of seismic waves while depression (canyon) produces de-amplification (e.g., Bouchon, 1973; Boore, 1973). The amplification is high at a wavelength comparable to the ridge dimension. Assuming a shear-wave velocity of 3 km/s, the wave length corresponding to 6 Hz is 500 m, which is close to the difference in the height of Monte Albán and OXLC. De-amplification caused by depression occurs at lower frequencies which is the case at Monte Albán. However, topographic map does not show any depression between OXLC and Monte Albán (Figure 1).
Table 3 Earthquakes recorded both at OXLC and Monte Albán which were used in computing transfer functions (spectral ratios)
| Date | Lat (°N) | Long (°W) | H, km | M |
|---|---|---|---|---|
| 06/07/2007 | 16.90 | 94.10 | 100 | 6.2 |
| 12/02/2008 | 16.19 | 94.54 | 90 | 6.6 |
| 09/02/2010 | 15.90 | 96.86 | 37 | 5.8 |
| 25/06/2010 | 15.22 | 96.44 | 12 | 5.1 |
| 07/04/2011 | 17.2 | 94.34 | 167 | 6.7 |
| 05/05/2011 | 16.61 | 98.91 | 11 | 5.5 |
| 02/10/2019 | 15.57 | 95.06 | 12 | 5.3 |
| 23/06/2020 | 15.78 | 96.12 | 22 | 7.4 |
| 24/06/2020 | 15.48 | 96.57 | 8 | 5.5 |
| 02/07/2020 | 16.21 | 98.02 | 19 | 5.2 |
| 24/07/2020 | 15.36 | 96.04 | 15 | 5.7 |
| 08/12/2020 | 15.65 | 95.41 | 53 | 5.5 |
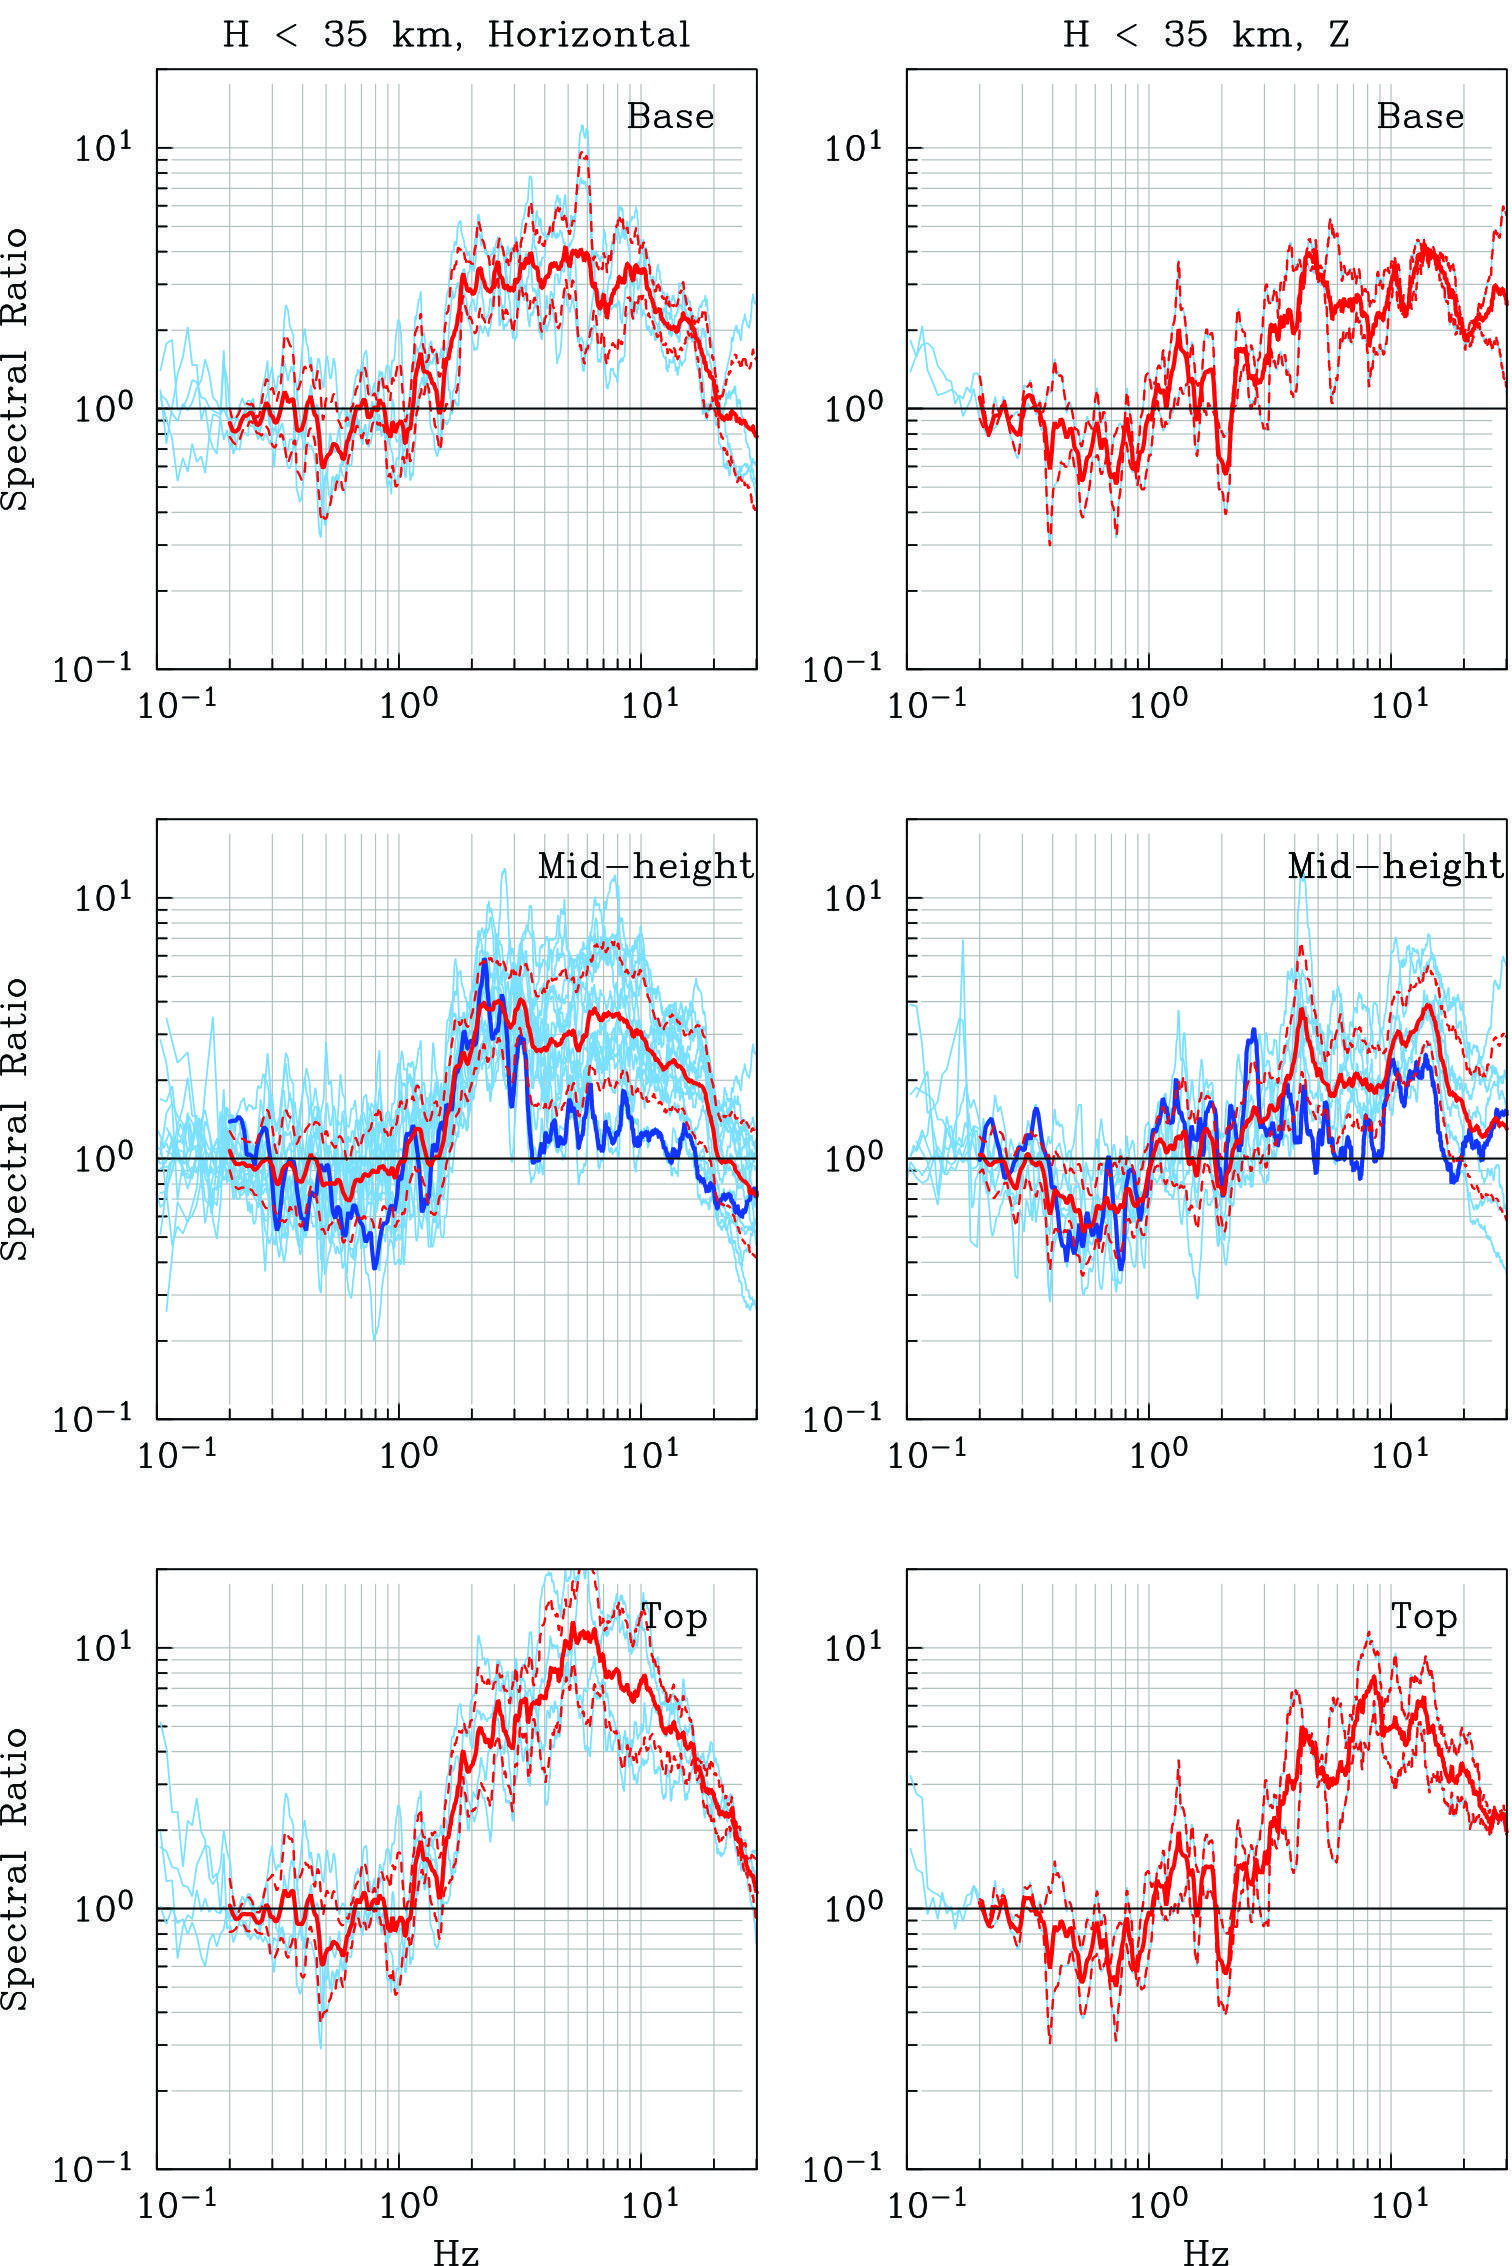
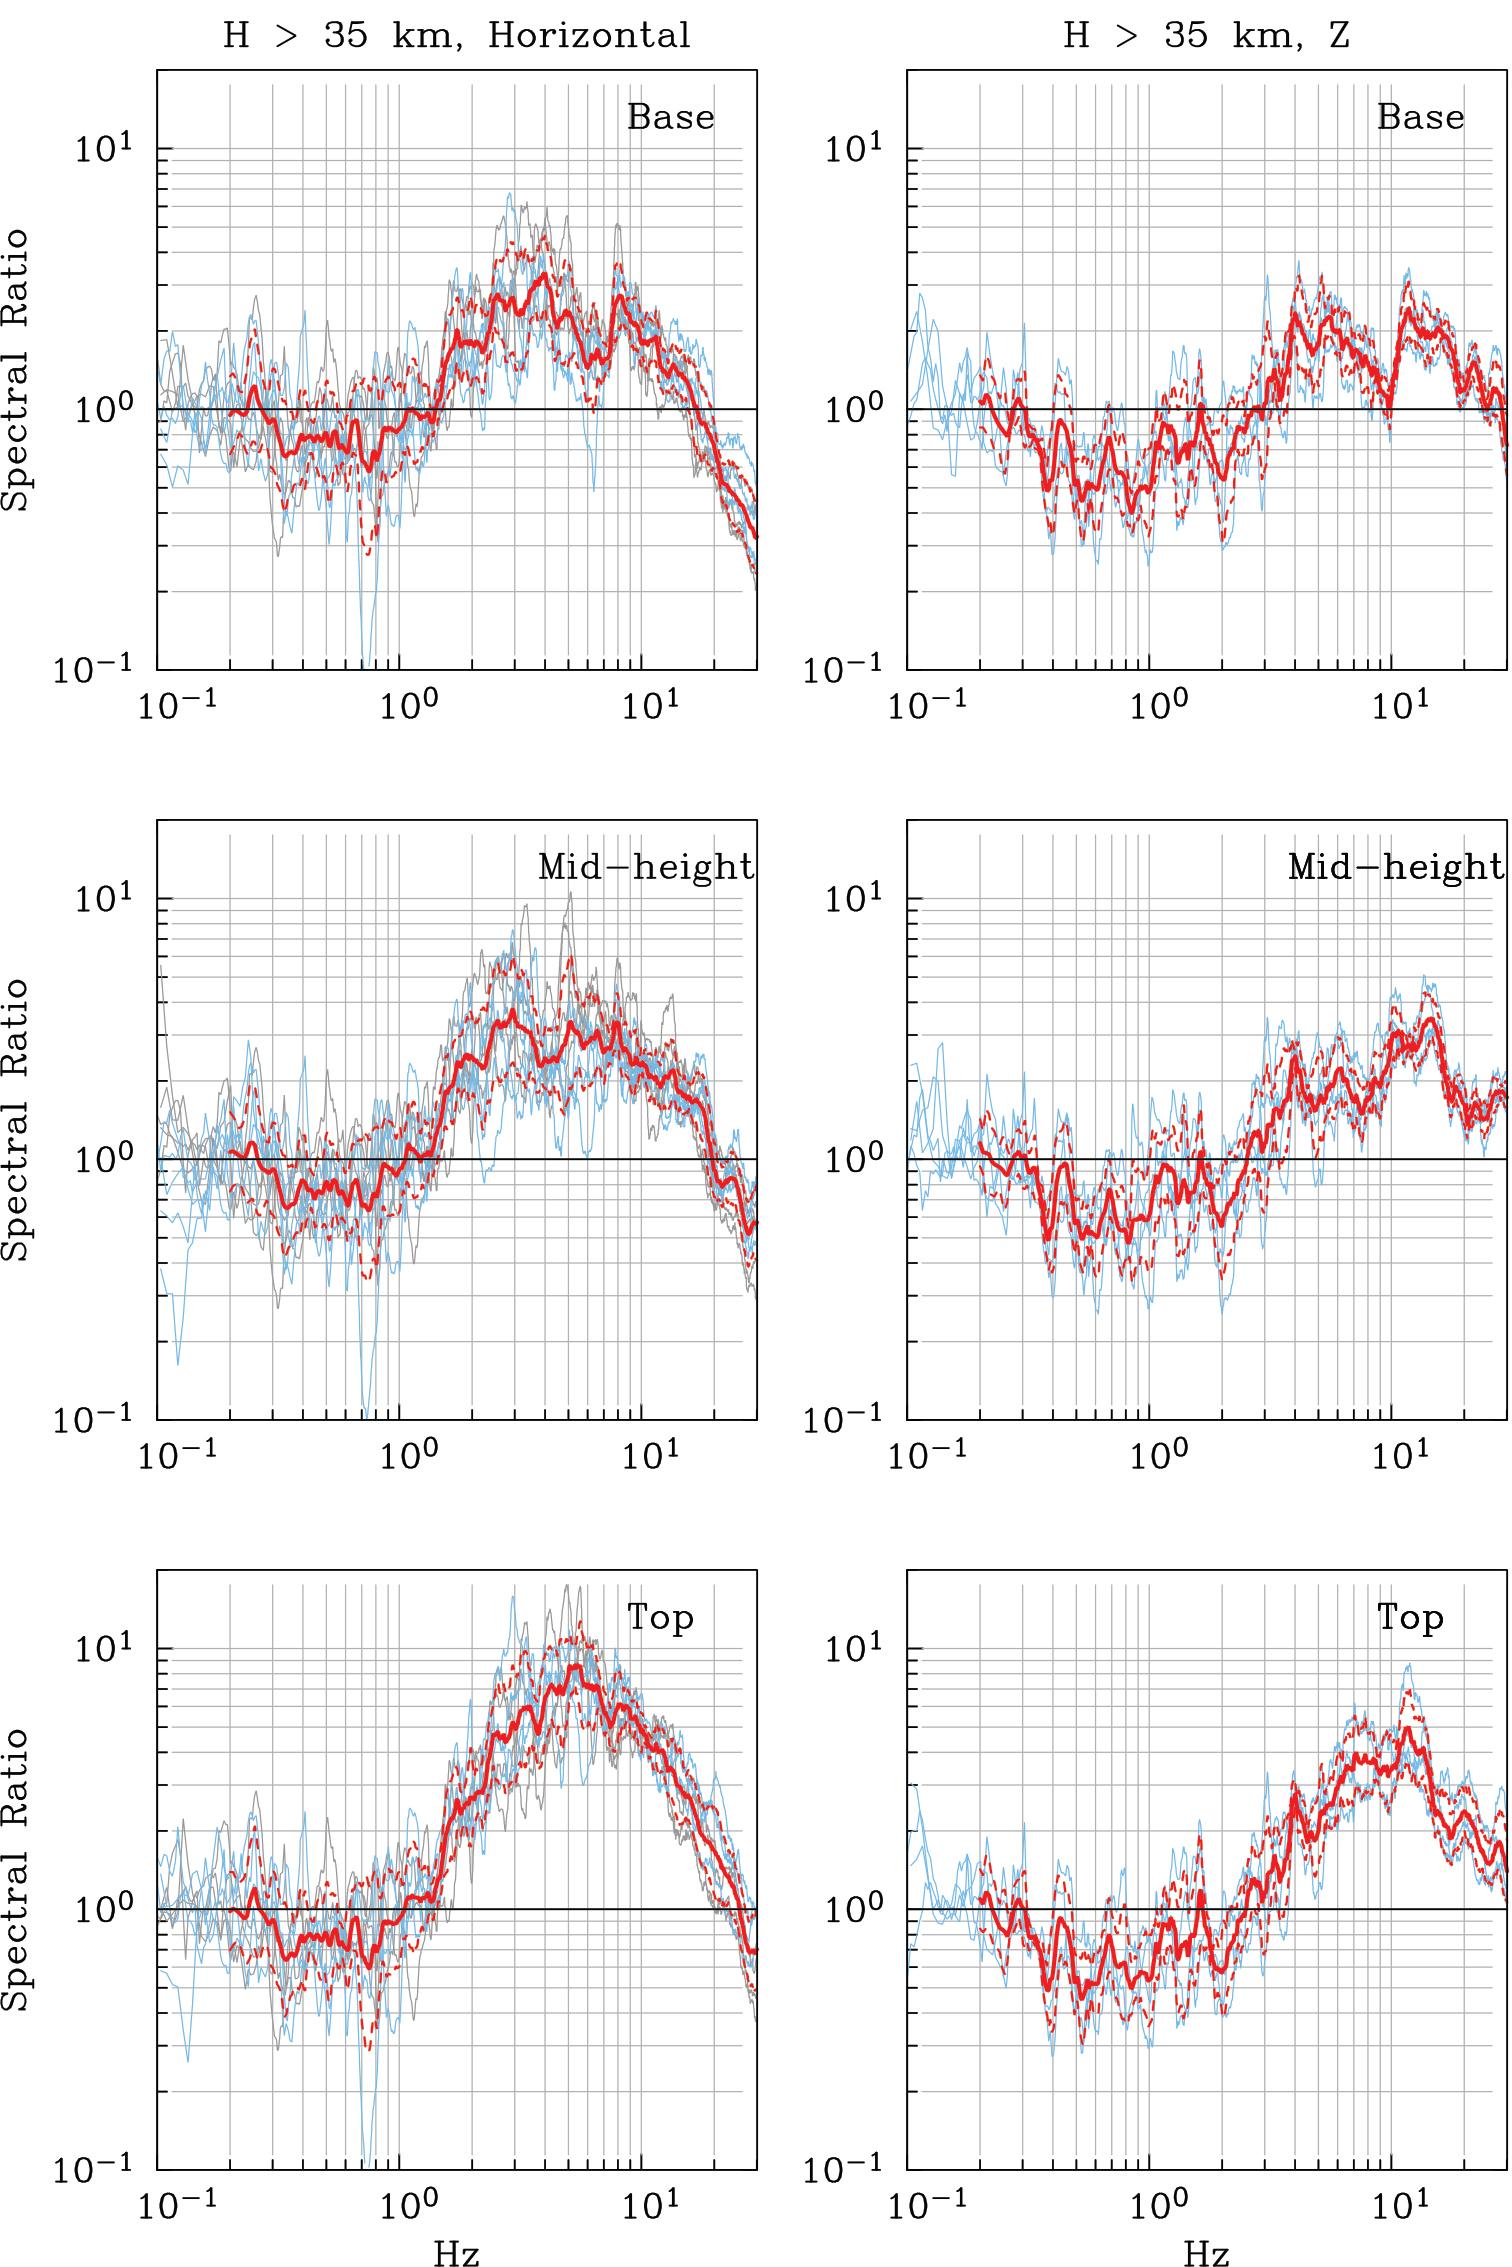
Figure 4 Spectral ratios at three sites of MAPN with respect to OXLC. Cyan curves exhibit ratios of individual events. Median and ± one standard deviation curves are shown in red. (a) From events with depth H ≤ 35 km. Thick blue curve is the observed spectral ratio between mid-height, MAPN and OXLC during the 2020 Huatulco earthquake; at f > 3 Hz observed ratio is lower than the estimated ratio likely due to nonlinear behavior of the structure. (b) From events with depth H > 35 km.
4.2 Some Tests
Huatulco earthquake of 23/06/2020 (Mw7.4) (Figure 1) was recorded both at OXLC and the triaxial sensor located at mid-height of MAPN. These recordings permit us: (1) to examine whether spectral ratio at MAPN with respect to OXLC computed for the 2020 earthquake differs from that obtained using moderate events (a test of possible nonlinearity), (2) to observe similarity and difference in the recorded ground motions at the two sites, and (3) to check the validity of the random vibration technique by comparing the observed and estimated ground motions.
Figures 5a and 5b illustrate these motions. We note that velocity and displacement traces at the two sites are very similar in waveform and amplitude; the acceleration at the mid-height of MAPN, however, is amplified, an expected result from Figure 4. In other words, at longer periods the motions are the same so that the velocity and displacement traces at OXLC may be used for MAPN.
For comparison of observed and estimated motion at mid-height during 2020, we select pseudoacceleration response spectrum, Sa, 5% damping. Sa at mid-height was estimated with median spectral ratio for shallower (H ≤ 35 km) events (the depth of the earthquake was 17 km). Effective duration, Te, a parameter needed in the calculations, was taken as the duration of the time window that brackets 95% of the energy in the accelerogram at OXLC. For the 2020 event, Te of NS, EW, and Z components are 16.6, 18.5, and 34.7 s, respectively; the corresponding values at mid-height of MAPN are 15.1, 16.7, and 27.9 s (Table 4). Thus, the effective duration of a given component at OXLC is about the same as at mid-height, MAPN. In the calculations we assume the same Te at both sites. The results are shown in Figure 5c.
Estimated and observed Sa for the two horizontal components are very similar at period T > 0.5 s but differ by as much as a factor of 2 at some shorter periods. Sa for the vertical component follows a similar trend. The main cause of the discrepancy is an unexpectedly large difference between the median spectral amplification and the observed spectral amplification during the 2020 earthquake alone (Figure 4a, middle frames). This difference points to a possible nonlinear behavior at MAPN mid-height site. Horizontal Sa recomputed using the observed spectral amplification (blue curve in Figure 5c) is much closer to the observed Sa (blue dashed curve); however, the difference is somewhat greater for the vertical Sa. The test suggests that sites on the MAPN are likely to suffer nonlinear behavior under intense ground motion. The results obtained here using median spectral amplification provides needed input ground motion to compute nonlinear response.
Table 4 Effective duration, Te, of accelerograms at OXLC.
| Date | Te at OXLC, s | ||
|---|---|---|---|
| NS | EW | Z | |
| 15/06/1999 | 43.2 | 46.8 | 53.0 |
| 30/09/1999 | 30.5 | 25.9 | 32.8 |
| 20/03/2012 | 23.2 | 38.0 | 42.9 |
| 08/09/2017 | 30.7 | 26.2 | 45.1 |
| 19/09/2017 | 39.0 | 35.7 | 55.9 |
| 23/06/2020 | 16.6 | 18.5 | 34.7 |
| 15.1* | 16.7* | 27.9* | |
*Te at mid-height site during the 23/06/2020 earthquake.
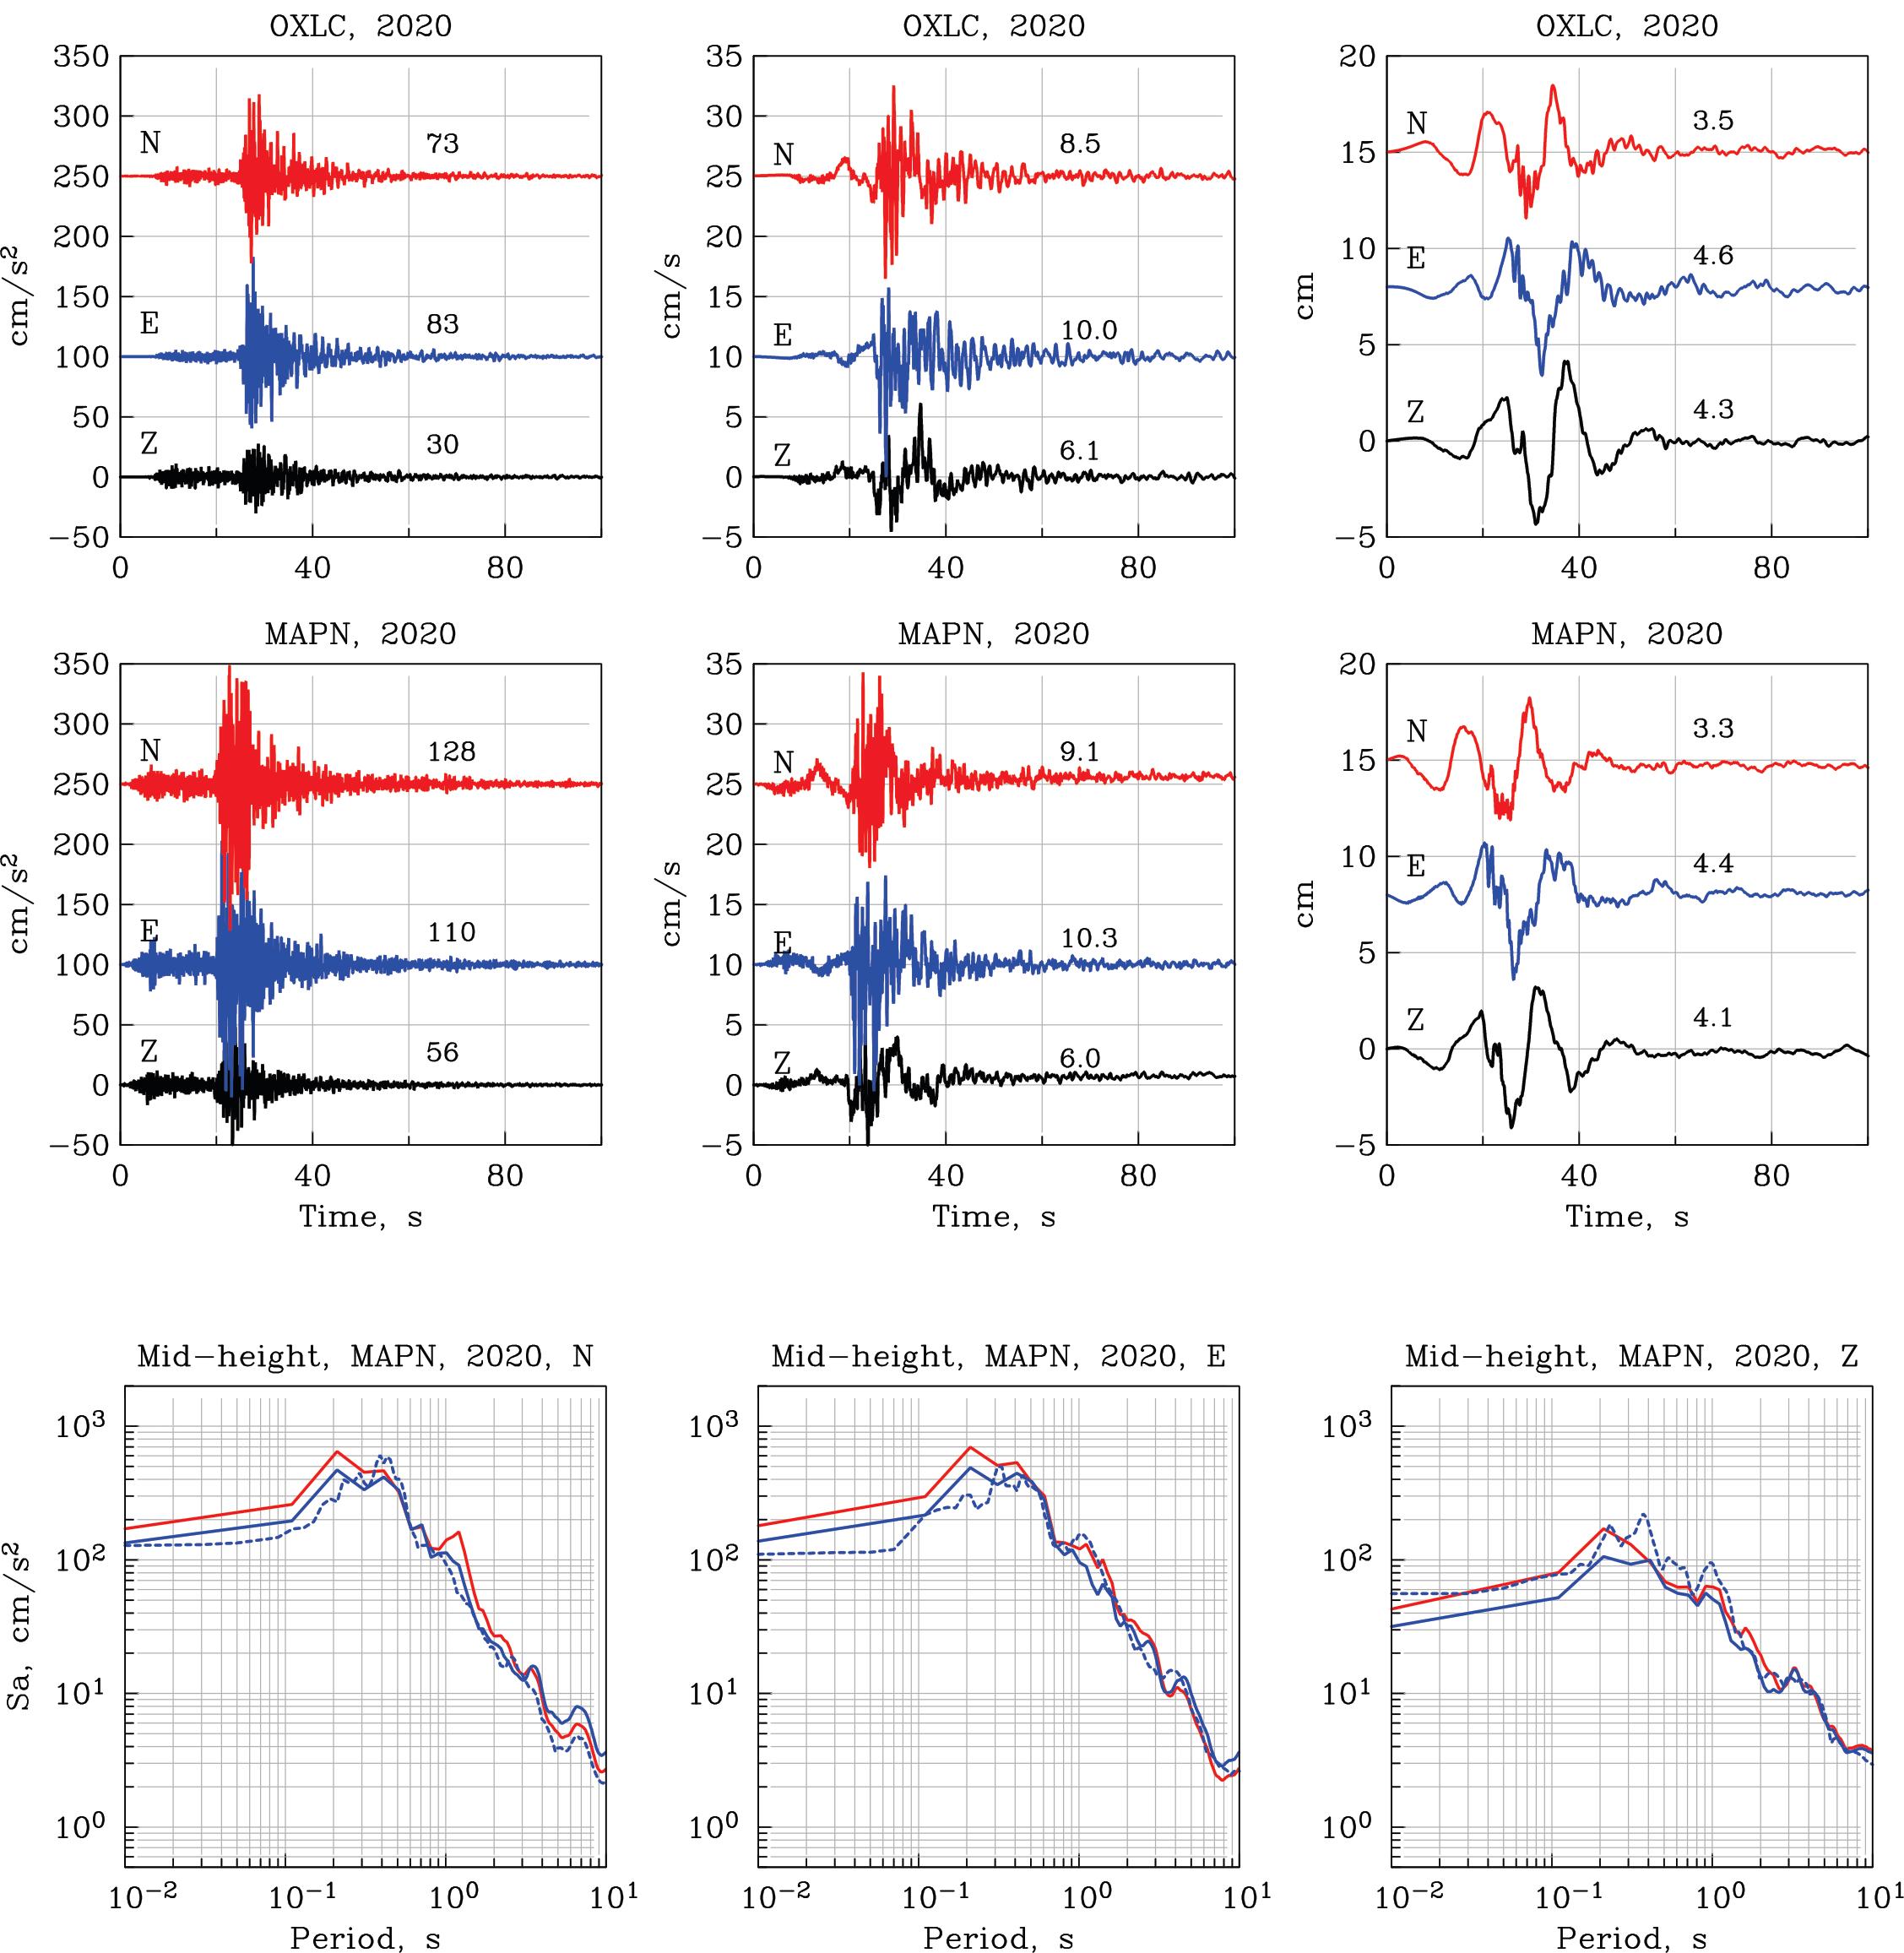
Figure 5 Acceleration, velocity, and displacement recorded during 23/06/2020 Huatulco earthquake at (a) OXLC and (b) mid-height of MAPN. Numbers above the traces in (a) and (b) are peak values. Note that velocity and displacement at both sites are nearly the same but acceleration at MAPN is amplified. (c) Comparison of observed Sa during 23/06/2020 at the mid-height sensor located at MAPN (blue dash) with estimated Sa using OXLC recording and observed spectral ratio between mid-height, MAPN and OXLC (blue). Red curve shows estimated Sa when the median spectral amplification for shallow events is used in the calculation. At longer period (T > 0.5 s) the curves overlap each other but at shorter periods the red curves are generally higher which is consistent with possible nonlinear behavior during the 2020 event.
4.3 Estimated Ground Motions at Monte Albán during Recent Large Earthquakes
In estimating Sa at MAPN sites from the recordings at OXLC, we assume that Te at the three MAPN sites is the same as at OXLC. This is justified from the effective duration observed during the 2020 earthquake. Te values at OXLC are compiled in Table 4.
Figure 6 shows the observed Sa at OXLC and the estimated Sa at the base, mid-height and top of MAPN for all six events (Table 1). Sa for the vertical component at different sites on the platform is nearly the same as at OXLC with few exceptions. This is also true for Sa of the horizontal component at periods T≥ 1 s, i.e., at long periods Sa is not affected by the location of Monte Albán on a hill. At short periods, T < 1 s, Sa at sites on the Platform differs from that at OXLC so that: (Sa)Top > (Sa)Mid-height > (Sa)Base > (Sa)OXLC.
At very small T, Sa equals PGA which is compiled in Table 5. Figure 7 gives ratio of PGA at sites on the MANP with respect to its corresponding value at OXLC; we denote this ratio the PGA amplification. We note that there is little or no PGA amplification for Z component. In fact, a de-amplification occurs during some events. PGA of the horizontal components at sites at the platform are amplified which increases with the height of the sensor location.
Table 5 PGA at Monte Albán estimated from OXLC Recordings.
| Date | PGA at OXLC, cm/s² | Estimated PGA at Monte Albán, cm/s² | ||||||||||
|---|---|---|---|---|---|---|---|---|---|---|---|---|
| NS | EW | Z | Base | Mid-height | Top | |||||||
| NS | EW | Z | NS | EW | Z | NS | EW | Z | ||||
| 15/06/1999 | 23.5 | 18.3 | 13.0 | 35.0 | 33.6 | 12.8 | 46.7 | 45.1 | 12.4 | 78.2 | 74.5 | 12.8 |
| 30/09/1999 | 70.1 | 74.7 | 48.3 | 132.2 | 142.2 | 50.8 | 175.4 | 188.8 | 53.5 | 293.1 | 315.9 | 55.1 |
| 20/03/2012 | 37.2 | 27.7 | 32.9 | 66.9 | 40.4 | 20.2 | 69.2 | 42.9 | 17.1 | 92.4 | 56.7 | 19.9 |
| 08/09/2017 | 58.6 | 102.3 | 67.5 | 109.6 | 145.5 | 37.8 | 145.2 | 194.3 | 40.1 | 231.7 | 298.4 | 41.0 |
| 19/09/2017 | 22.5 | 21.8 | 12.1 | 35.2 | 38.4 | 9.5 | 47.0 | 51.2 | 10.1 | 77.6 | 80.4 | 10.4 |
| 23/06/2020 | 72.5 | 82.9 | 30.4 | 149.7 | 152.5 | 37.9 | 169.7 | 173.0 | 31.4 | 244.3 | 248.7 | 38.3 |
| 133.7+ | 138.0+ | 31.6+ | ||||||||||
| 128.1* | 113.0* | 56.0* | ||||||||||
+Computed with observed spectral amplification between mid-height, MAPN and OXLC during the 23/06/2020 earthquake
*Observed PGA at mid-height site during the 2020 earthquake
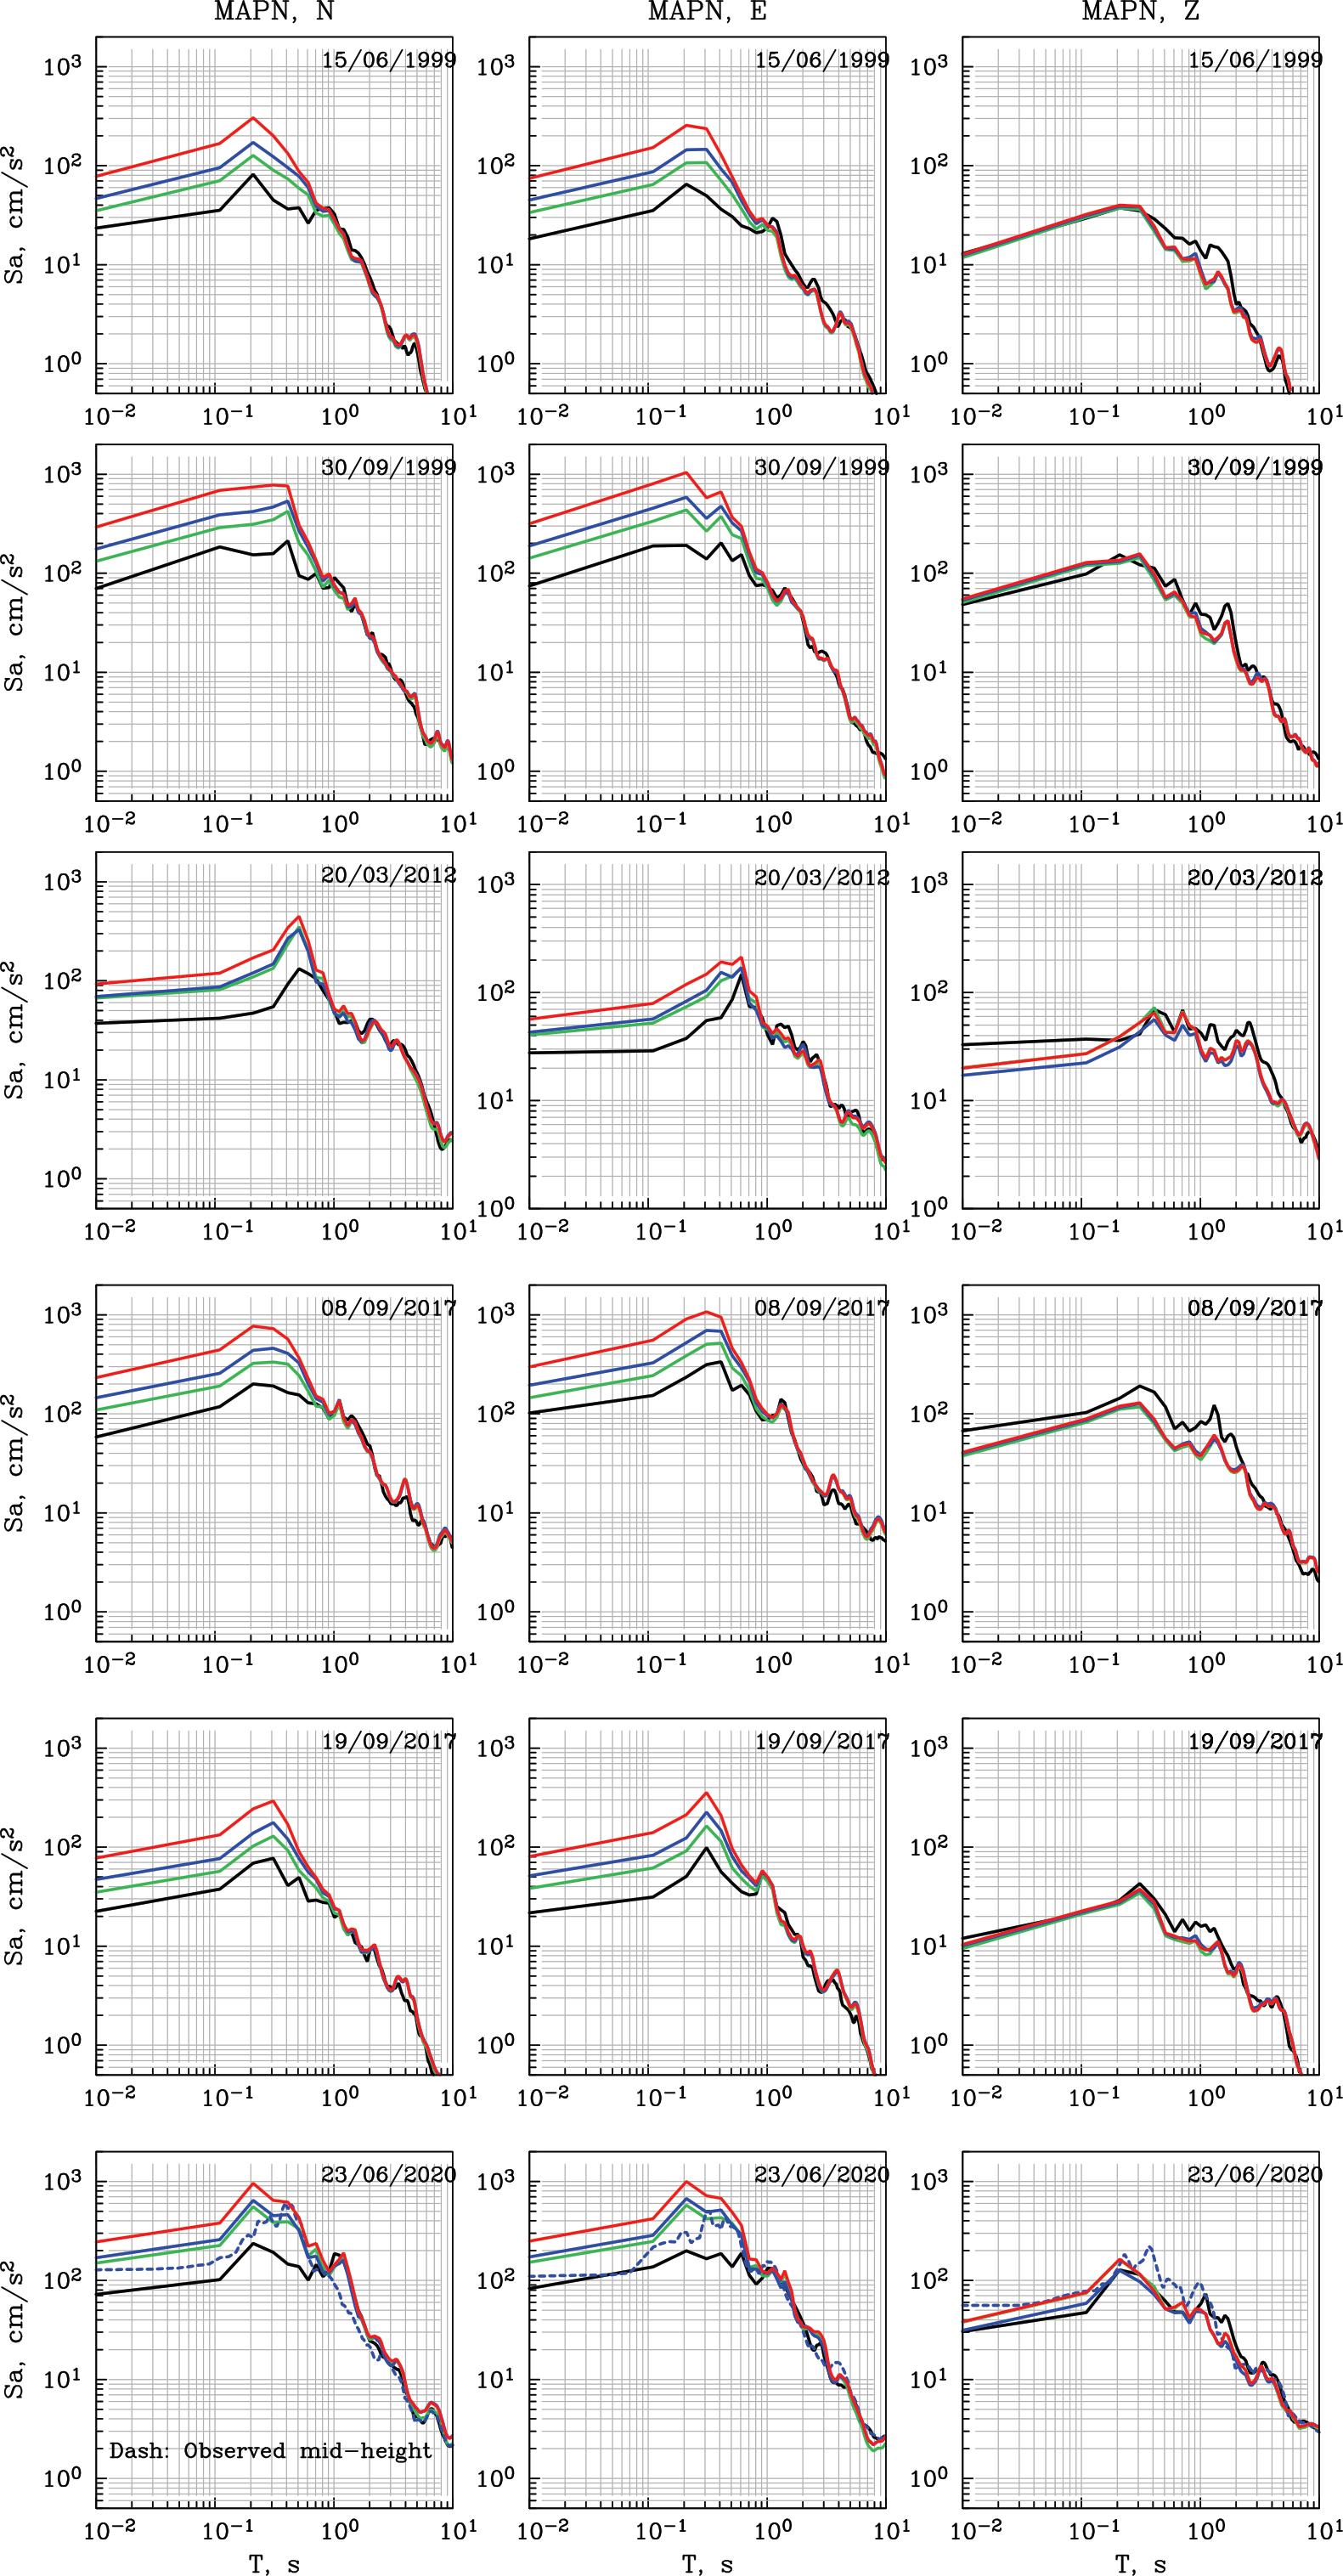
Figure 6 Observed Sa at OXLC (black) and the estimated Sa at the base (green), mid-height (blue) and top of the MAPN (red) for all six events (Table 1). Sa of vertical component is approximately the same at the three locations of the MAPN. Sa of NS and EW components differ at the three sites at T < 1 s but are roughly the same at T ≥ 1 s.
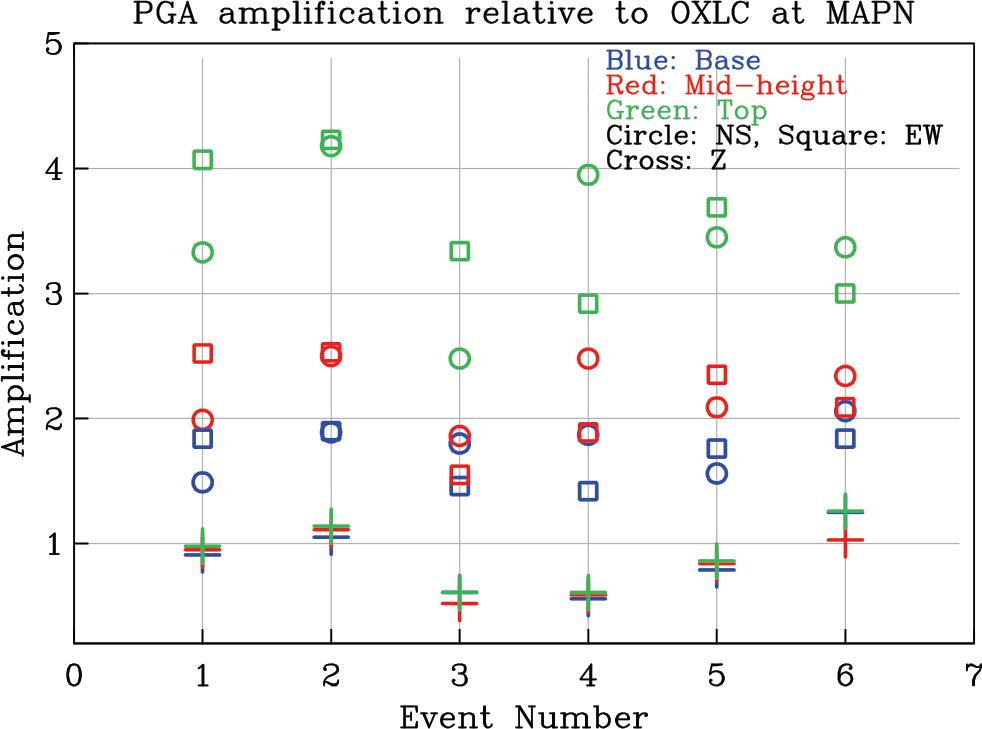
Figure 7 Amplification of PGA at the three sites of the MAPN with respect to OXLC. Note that the horizontal components at the base, mid-height, and top of MAPN are amplified with respect to OXLC. No such amplification occurs on the Z component; in fact, significant de-amplification is seen for events 3 and 4.
Average amplification of PGA at MAPN with respect to OXLC may be summarized as follows (Table 6). For Intraslab events the PGA at the base, mid-height, and top are amplified by a factor of 1.72, 2.29, and 3.73 on the horizontal components, and 0.83, 0.87, and 0.90, respectively on the Z component. For the subduction thrust events the amplification of the horizontal components at the base, mid-height, and top, are 1.79, 1.96, and 3.05; the corresponding values on the Z component are 0.93, 0.78, and 0.94.
The estimated (PGA)H at the base of MANP during the earthquakes of 30/09/1999, 08/09/2017, and 23/06/2020 are 137, 129, and 151 cm/s²; the corresponding observed values at OXLC are 72, 83, and 78 cm/s², respectively. Here (PGA)H = [{(PGA)NS² + (PGA)EW2}/2]1/2. There are two problems with the estimated values. (1) The observed (PGA)H at mid-height during 2020 was 121 cm/s² (Table 5). We expect a smaller (PGA)H than this at the base of MAPN. The estimated value, 151 cm/s², is higher, no doubt, because median spectral amplification differs greatly from the measured amplification for this event. Henceforth, we will assume that (PGA)H at the base of MAPN was ~ 115 cm/s², slightly less than the observed value at mid-height. (2) The damage was greater in 2017 than in 1999 and 2020. Yet the (PGA)H was highest during 1999. As mentioned earlier, it is possible that PGV and PGD played an important role in the damage; these values, especially PGD, were much higher during the great 2017 Chiapas (Mw8.2) earthquake (Figure 2, Table 1b).
If significant damage at Monte Albán occurred only during the earthquakes of 30/09/1999 and 08/09/2017, and, perhaps, also during the 2020 earthquake, then it is reasonable to state that the (PGA)H should exceed ~ 120 cm/s² at the base of the North Platform for this to happen in the future. The exceedance rate of such (and higher) level of ground motion is a critical issue which is addressed next.
5. Exceedance Rate of Damaging Earthquakes
From the recordings at OXLC during the period 1999-2024, we computed the empirical exceedance rate curve of (PGA)H shown in Figure 8 by counting the number of times that a given value of PGA was exceeded in the recordings and normalizing by the period of observation. As the data is for only 25 years, the empirical curve is likely to misrepresent the long-term exceedance rate. To partially remedy this shortcoming, we prepared a catalog of earthquakes for the period 1900 – 2024 (Table 7) which may have produced (PGA)H > 15 cm/s² at OXLC. (PGA)H of earthquakes in the period 1999-2024 are, of course, the recorded values at OXLC, except for the 2018 event. For this event and all others that occurred before 1999, (PGA)H were computed from GMPE derived by García et al. (2005) for intraslab events and Arroyo et al. (2010) for interface events (Table 7). Note that the highest estimated (PGA)H at OXLC (hence, most likely, also, at Monte Albán) in the last 124 years occurred during the normal-faulting, intraslab earthquake of 15 January 1931 (Mw 7.8), an event that was greatly destructive to the city of Oaxaca (Singh et al., 1985).
Exceedance curve from standard probabilistic seismic hazard analysis (PSHA) at a site such as OXLC is also shown in Figure 8. The tectonic setting and seismicity data for the PSHA model is described in detail in Ordaz et al. (2024). For PSHA computations we considered the GMPEs of Arroyo et al. (2010) for interface events, García et al (2005) for intraslab events, and Abrahamson and Silva (1997) for crustal events.
The three (PGA) exceedance curves for OXLC based on (1) 25-years of observed values, (2) 124 years of partly observed and partly estimated values, and (3) standard PSHA, are in reasonable agreement with each other. As mentioned earlier, (1) is based on only 25-year data. Even though a catalog of 124 years of significant events is considered for (2), the errors in location of older events and the estimated values from GMPEs affect the exceedance curve. The PSHA curve suffers some of the same shortcomings as (2); additionally, it is based on assumptions, such as the validity of seismicity models and the ergodic assumption of GMPEs, which may not hold good. In these circumstances, we give greater credence to (2) for the hazard levels of interest.
As mentioned earlier, damage at Monte Albán seems to occur when (PGA)H at OXLC exceeds 70 cm/s² (or, equivalently, ~120cm/s² at the base of Monte Albán if we take an amplification factor of 1.72 corresponding to intraslab events, Table 6). From Figure 8, this level of (PGA)H exceeds about every 20 yrs.
Similarly, (PGA)H at OXLC exceeds 100 cm/s² and 250 cm/s² (equivalently 172 cm/s² and 430 cm/s² at the base of Monte Albán) every 62 and 116 yrs, respectively. An extrapolation in Figure 8 suggests that (PGA)H of 560 cm/s² at OXLC (963 cm/s² at the base of Monte Albán) is exceeded ~ 1000 yrs. This may have happened during the great, interface, Oaxaca earthquake of 1787 (Suárez and Albini, 2009). Needless to emphasize that extrapolation of 124 yrs of data to infer return period of very high acceleration is a highly speculative exercise.
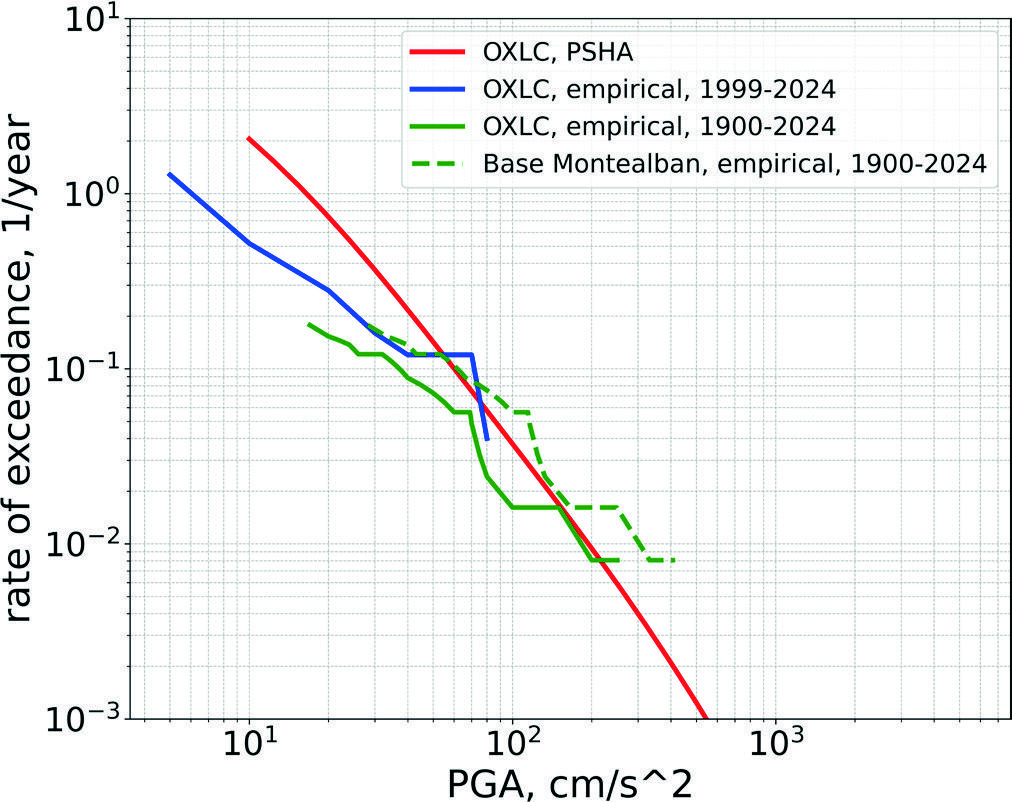
Figure 8 Exceedance rate curves of (PGA)H. Blue: from recorded data 1999-2014 at OXLC. Green: based on data 1900-2024 (recorded at OXLC: 1999-2024, estimated: 1900-1998). Green dash: curve for the base of MAPN (green curve shifted by a factor of 1.66 to account for amplification assuming intraslab events).
Table 7 List of events during 1900-2024 which produced PGA* > 15 cm/s² at OXLC (17.060N, 96.700W).
| Event No. | Date | Lat °N | Long °W | Depth km | M | R km | (PGA)*, cm/s² at OXLC |
|---|---|---|---|---|---|---|---|
| 1 | 10/02/1928 | 18.26 | 97.99 | 84 | 6.5 | 209 | (17) |
| 2 | 22/03/1928 | 16.02 | 96.30 | 20 | 7.5 | 125 | (47) |
| 3 | 17/06/1928 | 15.93 | 96.76 | 20 | 7.6 | 127 | (53) |
| 4 | 04/08/1928 | 16.07 | 98.02 | 20 | 7.4 | 179 | (17) |
| 5 | 09/10/1928 | 16.53 | 97.34 | 20 | 7.6 | 92 | (107) |
| 6 | 15/01/1931 | 16.34 | 96.87 | 40 | 7.8 | 91 | (279) |
| 7 | 26/07/1937 | 18.48 | 96.0 | 85 | 7.3 | 194 | (72) |
| 8 | 11/10/1945 | 18.32 | 97.65 | 95 | 6.5 | 196 | (24) |
| 9 | 24/05/1959 | 17.72 | 97.72 | 80 | 6.8 | 153 | (55) |
| 10 | 23/08/1965 | 16.08 | 95.87 | 20 | 7.5 | 141 | (36) |
| 11 | 02/08/1968 | 16.52 | 97.74 | 20 | 7.3 | 127 | (34) |
| 12 | 28/08/1973 | 18.30 | 96.53 | 82 | 7.0 | 161 | (69) |
| 13 | 29/11/1978 | 15.76 | 96.80 | 20 | 7.6 | 145 | (39) |
| 14 | 24/10/1980 | 18.03 | 98.27 | 65 | 7.0 | 209 | (25) |
| 15 | 15/06/1999 | 18.15 | 97.52 | 60 | 6.9 | 159 | 21.1 |
| 16 | 30/09/1999 | 16.00 | 97.02 | 54 | 7.5 | 130 | 72.4 |
| 17 | 23/03/2012 | 16.25 | 98.53 | 20 | 7.5 | 209 | 32.8 |
| 18 | 08/09/2017 | 14.76 | 94.10 | 46 | 8.2 | 383 | 83.4 |
| 19 | 19/09/2017 | 18.41 | 98.71 | 57 | 7.1 | 263 | 22.2 |
| 20 | 16/02/2018 | 16.22 | 98.01 | 20 | 7.2 | 169 | (17) |
| 22 | 23/06/2020 | 15.80 | 96.13 | 17 | 7.4 | 154 | 77.9 |
*(PGA)H = [{(PGA)NS² + (PGA)EW2}/2]1/2. Without parenthesis: recorded values, in parenthesis: estimated from GMPEs. Multiply (PGA)H at OXLC by 1.72 and 1.79 to get (PGA)H at the base of MAPN for intraslab and interface events, respectively.
6. Conclusions
Our estimated peak horizontal ground accelerations, (PGA)H, at the base of North Platform of Monte Albán during the 30/09/1999, 08/09/2017, and 23/06/2020 earthquakes are 137, 129, 105 cm/s², respectively; the corresponding values of (PGV) and (PGD)H are 5.0, 8.4, 9.3 cm/s and 2.4, 12.0, 4.1 cm. Damage to the archaeological site during the first two events is well documented. However, in spite of relatively high peak values during the earthquake of 2020, the report by Robles García et al. (2022) does not mention any damage during this event. Lesser damage during 2020 than in 1999 may have been due to successful recovery and conservation efforts following the earthquakes of 1999 and 2017 which had adequately strengthened the vulnerable structures.
For simplicity we assume that damage at Monte Albán occurs if the (PGA)H at the base of North Platform exceeds 120 cm/s² (70 cm/s² at the reference station OXLC). From Figure 8, we find that such motion, on average, is expected every ~20 to 25 years. This implies that, on average, a (PGA)H value of 120 cm/s² is expected to be exceeded once every 20 to 25 years. Based on a Poisson probability model, the likelihood of exceeding this threshold within a 25 years observation period is estimated to be around 67%. Thus, since 500 BC when Monte Albán was constructed, the archaeological site has been subjected to such (PGA)H more than 100 times. The estimated ground motion of 480 cm/s² during 1931 earthquake is exceeded every 100 years, which implies ~ 25 such events in the life span of the site. It is not possible to check the veracity of these estimations as there is no report of damage at the abandoned ruin of Monte Albán until 1928. First reports of damage come from the earthquake sequence of 1928, and the event of 1931 (Table 7) when the walls restored by Batres (1902) at the corner of the sculptures of Dancers (Danzantes) fell down (Robles García et al., 2004).
Alfonso Caso was highly critical of the restoration work carried out by Batres, especially because the restoration did not withstand the 1931 earthquake. Considering the devastation that the earthquake caused to the adjacent City of Oaxaca and the high estimated (PGA)H during the earthquake at Monte Albán, it may seem puzzling that the damage to the monument was not much greater in 1931 than in 1999 and 2017. In fact, in 1931 Alfonso Caso had just begun the explorations. Except for a small area restored by Batres, the rest of Monte Albán was a mountain of rubble. Alfonso Caso does not mention extensive damage because there was little which could be damaged (Nelly Robles García, personal communication, 2025).
In view of the cultural, social, historical, and touristic importance of this World Heritage Archaeological Site, it is of vital importance to install and operate seismic sensors in the zone. In the meantime, the recordings at the nearby site of OXLC may be gainfully used since velocity and displacement at Monte Albán and OXLC are very similar. The acceleration, which differs, may be roughly estimated from OXLC recording and the known spectral ratios through the application of random vibration theory. The results of this paper may be useful in making decision on how to adequately strengthen the monument against damage during future earthquakes.
The importance of periodic geotechnical, geodetic, and geophysical monitoring of the monument can hardly be overemphasized. These methods were successfully used in the recovery and restoration efforts following the 2017 earthquake (Robles García et al., 2022).
7. Acknowledgement
We are greatly indebted to Nelly Robles García and Salvador Aceves for their generous help and orientation; authors of this paper, with little knowledge of archaeology, would have made many more errors without their guidance. In 2004 Roberto Meli brought to our attention the damage at Monte Albán during the 1999 Puerto Escondido earthquake and to the accelerometric network which had begun operating at the site. For some reason, now forgotten, the research was abandoned by us after an initial exploration. The interest was revived during a recent visit to the monument by one of the authors as a tourist.
Acquisition of the Monte Albán accelerographic network was funded by the Government of Japan. Maintenance, partially funded by INAH, was carried out by Instituto de Ingeniería (II), UNAM. OXLC is an II station. We thank Leonardo Ramirez Guzmán, Citlali Perez Yañez, M. del Rosario Delgado Diance and Ana Laura Ruiz Gordillo for making the accelerograms recorded at Monte Albán available to us. Thanks to the Instrumentation Group of II; in particular to Juan Manuel Velasco Miranda, Mauricio Ayala Hernández, Israel Molina Ávila, Luis Alberto Aguilar Calderón, Ricardo Vázquez Larquet, Alejandro Mora Contreras, Héctor Sandoval Gómez, Marco Antonio Macías Castillo, and Gerardo Castro Parra.
The research was partially supported by DGAPA UNAM Project IN114426.

