


 nueva página del texto (beta)
 Inglés (pdf)
 Artículo en XML
 Referencias del artículo
 Enviar artículo por email
 Citado por SciELO
  Similares en
SciELO
Similares en
SciELO 
 Permalink
1. Introduction
The "Las Sierras" Aquifer comprises the western, central and eastern sub-basins of Managua city, capital of Nicaragua. This aquifer is exploited by numerous wells to supply drinking water to Managua (Japan International Cooperation Agendy, 1993). It is estimated that it reaches a depth of more than 500 m (Castillo et al., 2006) in the areas close to the Managua Lake. The lithostratigraphic succession of the Pacific is benefited by the presence of a large groundwater volume, the main source for human consumption. Nevertheless, the expansion of the capital city in the last decade led to an increment in the demand for safe water extraction, both in quantity and quality (Hirata, 1993a, 1994b).
The most pessimistic scenario according to Pérez (2009) suggests that by 2050, the base flow reflected as output of the aquifer will be four times smaller than in 2022. By the year 2100 it would represent only 10 % of the current one. It is necessary to ensure that the quality of drinking water meets the standards established through a water resources conservation plan (Planes de Gestión Integrada del Recurso Hídrico-Manual de Capacitación y Guía Operacional, 2005). Therefore, there is a special interest in developing projects aligned with the SDG (Sustainable Development Goals, also known as Global Goals), adopted by the United Nations in 2015. Goal 6 seeks to ensure universal, safe and affordable drinking water to improve the accessibility and safety of services for the population (Catalyst 2030, 2024c). In this framework, the Mayor's Office of Managua has developed and promoted social interest projects under the "Bismarck Martinez Projects" program, with the objective of guaranteeing 1,200 new homes for low-income families. In order to provide access to drinking water for these housing projects (scattered across the city), water resource management that involves a balance of social, economic and environmental sustainability is necessary (Proceso Regional de las Américas VI Foro Mundial del Agua, 2012).
In this context, geophysical studies, particularly electrical resistivity tomography (ERT) and information obtained from drilling logs in a target area, emerge as essential resources to advance the development of an hydrogeophysical conceptual model. These methods facilitate the construction of a comprehensive representation of the underground water flow system, consolidating the available geological and hydrogeological information in the study area (Anderson and Woessner, 1992; Belle et al., 2018).
Similarly, the field of hydrogeophysics has played a pioneering role in introducing efficient and non-invasive subsurface data acquisition methods. These methods have proven to be crucial tools for identifying heterogeneities in the geological characteristics of underground rock formations. Moreover, they have demonstrated particular effectiveness in delineating areas with significant potential for high water yield, as highlighted in previous studies (Dutta et al., 2006; Ramalho et al., 2012).
The relevance of this study lies in the combination of geological data from wells and geo-electric profiles, which has allowed for a more accurate representation of a previously unknown underlying valley and the substrate that forms the aquifer in question. A significant result of the research is the revelation of the Tertiary El Salto formation as the possible basement of the main aquifer under study. This detailed knowledge serves as a key tool for informed decision-making regarding the sustainable exploitation of water resources, ensuring their long-term availability, and thus contributing to the sustainable development of the region.
1.1 Geology and hydrogeology of the area
The research focuses on the study area located within the geological structure known as the "Airport Graben or Trench," a region of significant geological interest documented by several researchers (Kuang, 1971; Garayar, 1977; Cowan, 2022; Frischbutter, 2002; Girard et al., 2005). The graben provides great interest for a detailed analysis of hydrogeophysical processes in the region.
The aquifer under consideration covers an extensive portion of the graben and the capital city of Managua, spanning an impressive area of approximately 1,040 km2, as indicated by the report from the Japan International Cooperation Agency (JICA) in 1993. This vast expanse reflects the hydrological importance of the region and its crucial role in supplying water to the local population.
The precise geographical location of the study area is situated between 592690-1343985-Zone16N (Figure 1). The climatic conditions, with temperatures ranging between 26.9-30 °C and highs of 35 °C, add a distinctive atmospheric component that influences hydrogeophysical processes in the area (Ruiz et al., 2021; Gómez et al., 2021).
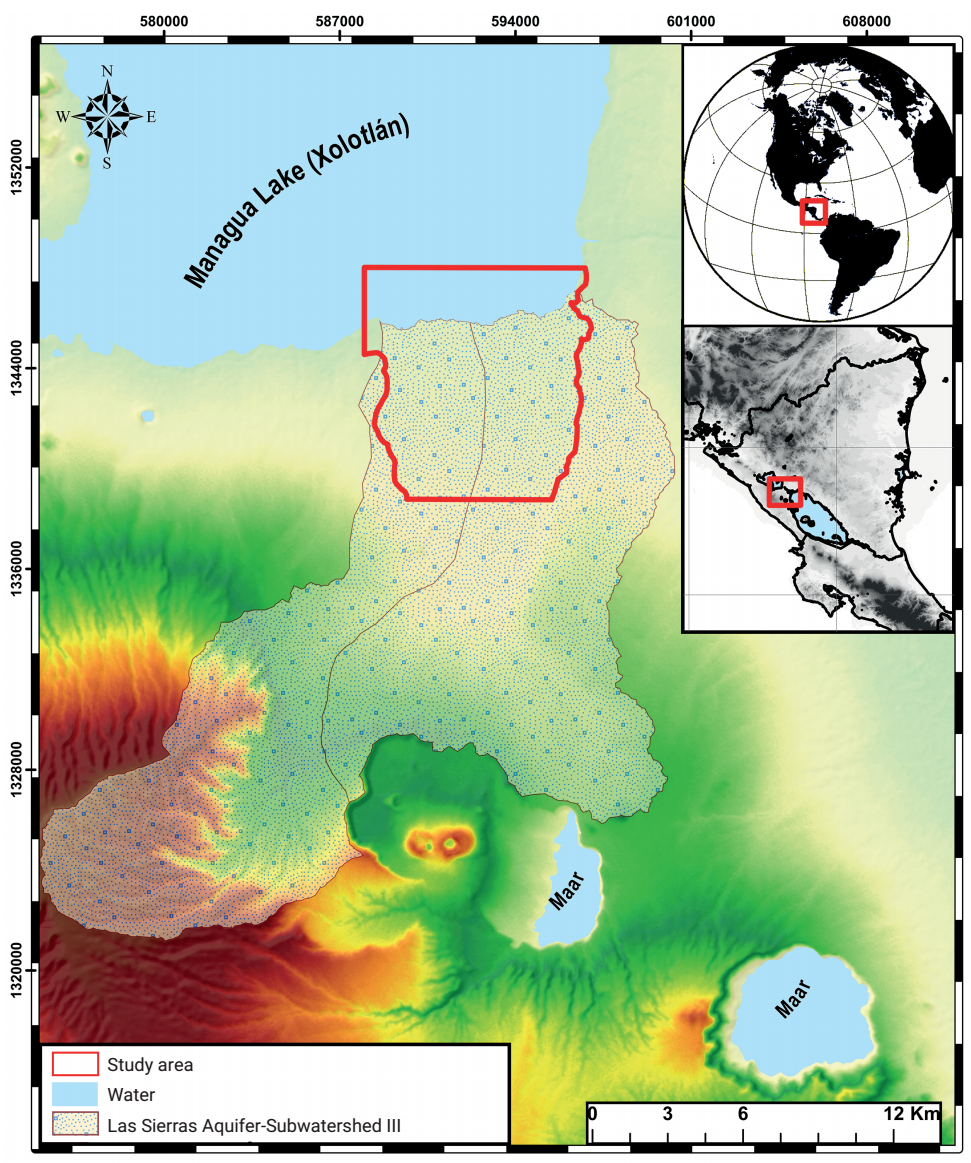
From a geological perspective, the region exhibits notable complexity, as detailed by (INETER- BGR, 2007) Alluvial and lacustrine sediments are part of the environment, identified as alluvial deposits (Qal), while pyroclastic materials, composed of volcanic ash, sand, and volcanic tuff (QvM), are also prominent in the area. The saturated layer, acting as the main aquifer, is characterized by permeable deposits of pyroclastic flows belonging to the "Las Sierras" middle group (TQpS-M) of the Pleistocene (Figure 2).
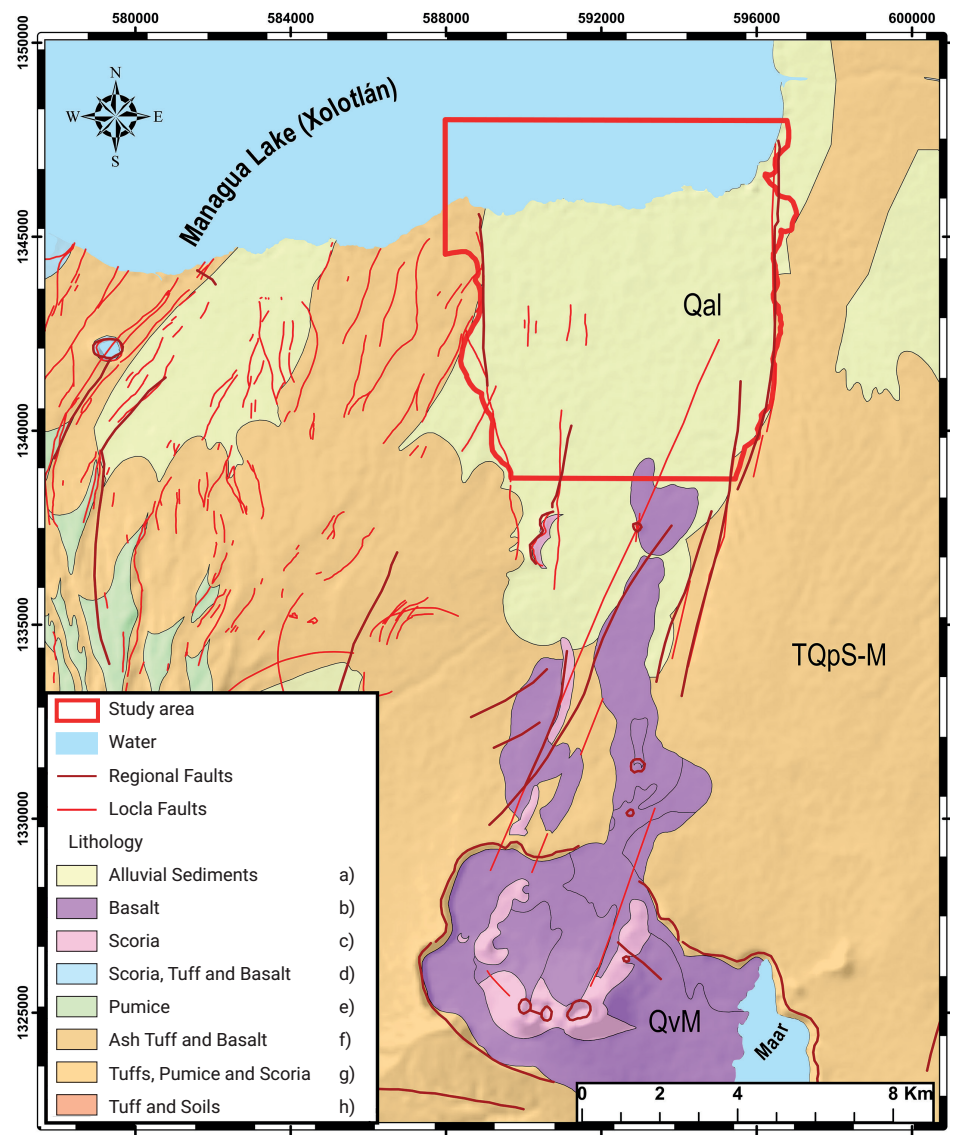
Figure 2 The lithological description updated in 2006 by the Nicaraguan Institute of Territorial Studies (INETER) and the Federal Institute of Geosciences and Natural Resources (BGR) is constituted as follows: a) Composed of sandy, silty, and clayey materials with intercalations of coarse gravel and sand (Quaternary Unit). b) Basaltic lava composition (Masaya Volcanic Group QvM). c) Loose, angular, and vesicular fragments, dark in dacitic composition (Managua Group). d) Intercalations of cineritic tuffs, with scoria and lavas of basaltic and andesitic composition (Managua Group). e) Loose, angular, and vesicular fragments, light in dacitic composition (Managua Group). f) Tuffs with fragments of pumice and a layer of lapilli. g) Intercalations of cineritic tuffs of basaltic composition, layers of fine pumice, and scoria (Managua Group). h) Unconsolidated lithic tuffs with fragments of scoriaceous basaltic pumice and intercalations of fossil soils (Las Sierras Middle Group TQpS).
Previous studies conducted by Kutterolf et al. (2007), Pardo et al. (2008), and Avellán (2009) have provided valuable insights into lithostratigraphic entities from the Quaternary to the Tertiary (Neogene). Specifically, studies by JICA (1993) offer a detailed description of materials extracted through drilling (wells), comprising gravel, gravel with sand, sand, sand with clay, clay, coffee-colored clay, and rock (boulders).
Consequently, two lithological units (Qal and SF) and two lithostratigraphic groups (QvM and TQpS-M) were defined. In Figure 3, a decrease in thickness is observed toward Managua Lake for both the Masaya Volcanic Group (QvM) and the Las Sierras Middle Group (TQpS-M). Additionally, intercalations of fossil soils (SF) with thicknesses ranging from 5 to 15 m are identified between these lithological groups (Reyna & Quiroz, 2020).
Alluvial Lithological Unit (Qal):
This unit is mainly composed of sand and clay sediments, along with pyroclastic material. Additionally, debris and ash deposits, as well as pyroclastic flow surges, are identified. The thickness of this unit varies between 5 and 10 m, suggesting a heterogeneous mixture of materials transported by fluvial and volcanic processes.
Masaya Volcanic Group (QvM):
The lithology of this unit is characterized by basaltic lavas, both porous and autobrecciated. Lava flows and fall deposits of pyroclastic material are also found, with thicknesses reaching approximately 30 m. These volcanic rocks provide valuable information about past eruptive activity and the geological evolution of the region.
Fossil Soil (SF):
Las Sierras Middle Group (TQpS-M):
This lithological unit stands out for its considerable thickness, exceeding 80 m. It is composed of a variety of rocks, including basaltic-andesitic conglomerates, tuff breccias, tuff, pyroclastic flows, and volcanic origin sands. The diversity of these rocks suggests considerable geological complexity in the region, with volcanic and sedimentary events leaving their mark over time.
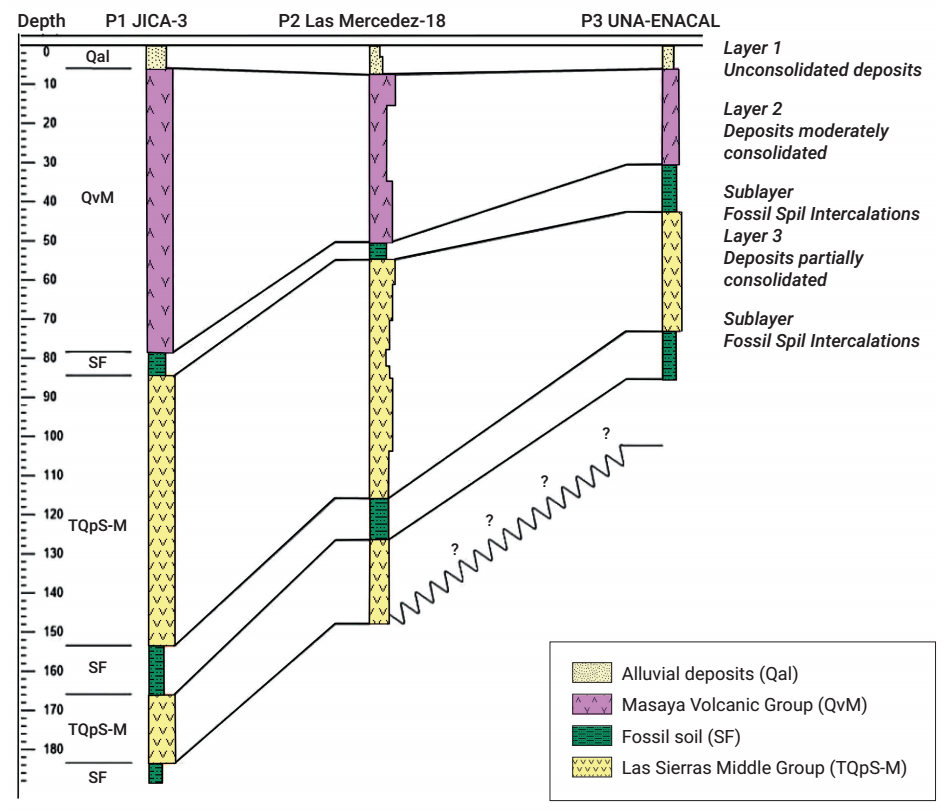
Figure 3 The lithology of the wells is defined through the correlation of lithostratigraphy and hydrogeological units identified in the area. Unit 1: Unconsolidated Materials (Qal). This unit is composed of unconsolidated materials, including clays, silts, gravels, and sandy soils. These are alluvial deposits identified as part of the lithology in the region. These materials are typical of fluvial environments and can influence subsurface permeability. The second unit consists of moderately consolidated materials, such as gravel with sand, sand with clay, and sand. These materials are associated with the Masaya Volcanic Group. The moderate consolidation of these materials can impact water transmission capacity and well stability. The third unit is composed of partially consolidated materials, including rock or boulders, gravel with sand, and sand. These materials are associated with the Las Sierras Middle Group. It is important to note that fossil soils act as the upper limit or roof for the materials of the Las Sierras Middle.
The piezometry measured with reference to mean sea level shows variations between 40 and 50 meters. Subtracting the topography, it is estimated that the water table could have a depth between 10 and 25 meters. It is important to note that the lowest point of this surface corresponds to the elevation of Managua Lake, extending towards the underground flow lines, as illustrated in Figure 4 a). This configuration suggests a significant connection between the groundwater surface and the underground system that feeds the lake. Additionally, a basement or underlying stratum to the main aquifer formation has been identified. This stratum extends to depths ranging from -280 to -60 meters (ZDRH2), as shown in Figure 4 b). Furthermore, there is a variation in the depth of this stratum, ranging between -320 and -200 meters (ZDRH2).
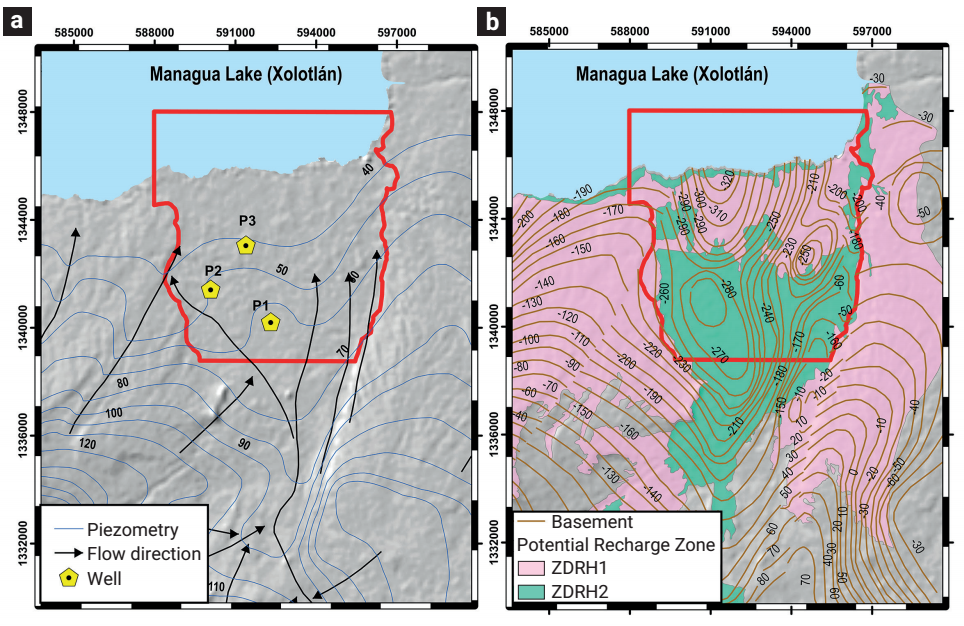
Figure 4 In the left panel Figure 4 a), Piezometry map respect to the sea level; values between 40 and 50 meters (Piezometry) from the water table surface are observed, along with the well locations and the flow direction. In the right panel Figure 4 b), the basement depth and potential zones are displayed.
The delineation of these groundwater and basement depth levels contributes to evaluating the interconnection of the main aquifer with other sources of groundwater, as documented by JICA in 1993, such as the Las Sierras aquifer.
2. Materials and methods
2.1 The resistivity method
The Electrical Resistivity Tomography (ERT) method involves passing an electrical current through a multiple-electrode acquisition system, while voltage is recorded by another potential electrode system. Data acquisition is performed using the ABEM Terrameter LS Resistivity Meter (Dahlin, 2001).
The setup consists of four cables, each 200 m long, with 21 plugs, capable of achieving a maximum spacing of 10 m. The configuration reaches a maximum length of 800 m with a probing depth of 160 m, employing 81 electrodes simultaneously. Naturally, they can be moved in a 'roll-along' fashion (Loke et al., 2002) to cover larger distances. The 'gradient array' geometric configuration for multiple electrodes was selected to generate 2D and 3D images, taking into account lateral and vertical homogeneity in subsurface layers (Dahlin & Zhou, 2004; Bentley & Gharibi, 2004).
2.2 Multi-electrode gradient surveying
Multielectrode electrical prospecting through gradient methods involves the injection of current at a separation distance. This process includes injecting current at a distance of (s+2)a, as per Equation 1, and measuring potential differences between electrodes spaced at a distance of a. In this context, the separation factor, denoted as 's,' represents an integer and signifies the maximum number of potential readings for a given current injection. The factor 'n' is defined as the relative spacing between the potential dipole and the nearest current electrode.
Furthermore, the midpoint factor 'm' is characterized as the position of the midpoint of the potential electrode dipole in relation to the midpoint between the two current electrodes. This definition was established by Dahlin & Zhou (2005).
where XA, XB, XM, XN are the positions of the current and potential electrodes (XB > XA, XN > XM), and XAB, XMN are the midpoints of the respective dipoles. Therefore, n and m are negative or positive integers.
This array is a hybrid between Wenner and Schlumberger configurations (Pazdirek and Blaha 1996); the mathematical expression for apparent resistivity (ρa) is:
Where n is the separation dipole and a is the dipole length, ∆V is the potential difference in volts (V) measured between the potential electrodes, and I is the applied current intensity in amperes (A).
2.3 Location of geophysical profiles
Two relevant sites were selected focused to provide water access for two house complex inside the study area, determined by the Interest Social Program "Bismarck Martinez Projects. For the first one, four geo-electric profiles were conducted in 2020 (ERT A). Two of them were oriented in a North-South direction, and the other two were oriented in an East-West direction. In 2021, for the second site (ERT B), two profiles were conducted in the North-South direction, and another in the East-West direction (Figure 5). Table 1 provides the details of these profiles. Electrode spacings in the lines were set at 6.5, 7.5, and 10 m, with the depth varying based on this parameter. The position of each electrode was recorded using a handheld GPS device. The injected current was standardized at 200 mA.
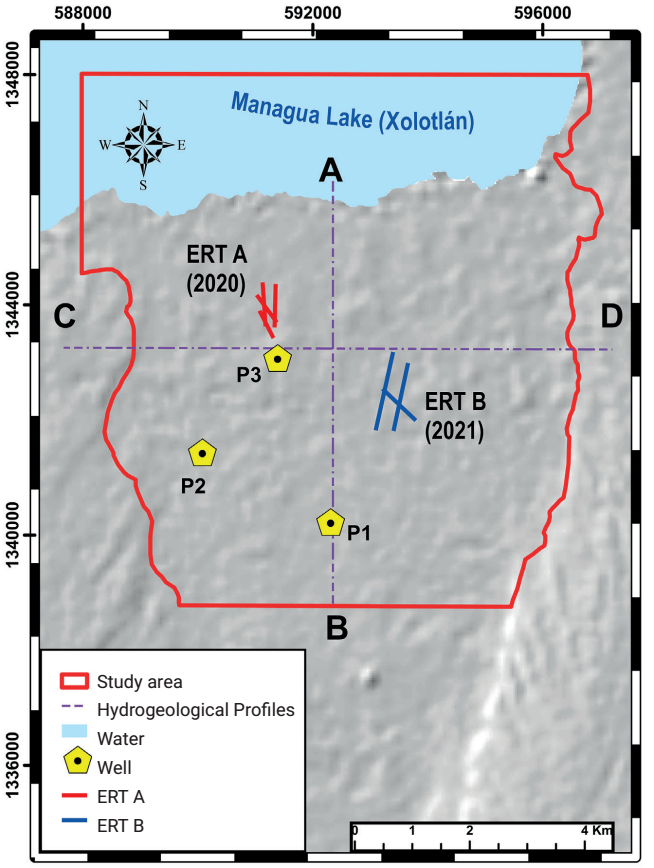
Figure 5 Geoelectric profiles (ERT) location, nearby wells, and location of the propose hydrogeological profiles (AB and CD).
Table 1 Electrical Profiles.
| ID | UTM coordinates (Start) | UTM Coordinates (End) | Length (m) |
Electrode spacing (m) |
Depth (m) |
||
|---|---|---|---|---|---|---|---|
| ERT A (2020) | |||||||
| ERT1 | 591350 | 1344366 | 591335 | 1343617 | 800 | 10 | 150 |
| ERT2 | 591121 | 1344398 | 591177 | 1343655 | 800 | 10 | 150 |
| ERT3 | 591020 | 1344177 | 591377 | 1343704 | 600 | 7.5 | 120 |
| ERT4 | 591071 | 1343899 | 591308 | 1343431 | 500 | 6.5 | 100 |
| ERT B (2021) | |||||||
| ERT5 | 593392 | 1343196 | 593089 | 1341832 | 1400 | 10 | 150 |
| ERT6 | 593649 | 1342994 | 593402 | 1341822 | 1200 | 10 | 150 |
| ERT7 | 593203 | 1342547 | 593784 | 1342000 | 800 | 10 | 150 |
2.4 Data processing and inversion
The Res2Dinv program was employed to conduct an inversion process, utilizing a finite element numerical method iteratively until a refined model was achieved (Loke and Dahlin, 2003; Loke, 2000). By solving a differential equation of the direct model, a theoretical inversion model is derived, forming a matrix that is discretized into cells (Loke and Barker, 1995; Sasaki 1992). The inversion statistic selected for iteration is the root mean square (RMS) between 2 and 5%, and the results are exported in xyz models for graphical representation with appropriate scaling in the R programming environment.
The disparity between the model's response and the measured data is expressed through Equation 3. This difference is quantified in terms of a root mean square (RMS) error value.
where N represents the total number of measurements, x data,i denotes field data, x model,i represents simulated data.
3. Results and discussion
3.1 Geophysical interpretation of ERT data
Electrical Resistivity Tomography (ERT) data unveils three distinct geo-electric strata characterized by low, medium, and high resistivity levels (refer to Figure 6). The shallowest layer reaches a depth of 10 meters and exhibits low resistivities ranging between 10.0- and 25.8-Ohm m. These values indicate the presence of extremely shallow water levels and are associated with alluvial deposits (Qal).
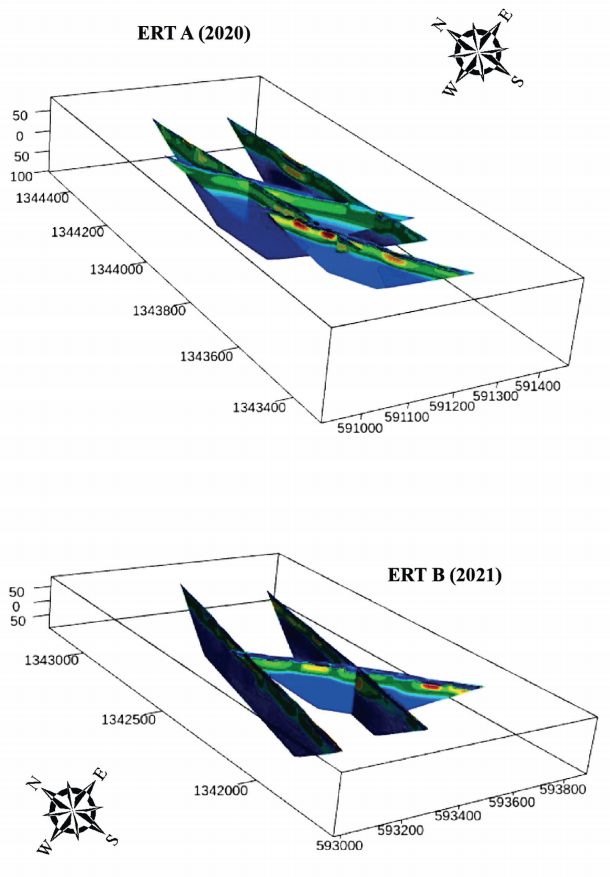
Figure 6 Electrical Resistivity Tomography Models (Figure a) ERT A (2020) and Figure b) ERT B (2021).
Conversely, intermediate resistivities ranging from 29.6 to 100 Ohm m signal the presence of materials from the Masaya Volcanic Group (QvM). These materials are estimated to be situated at a depth of approximately 30 meters. Finally, resistivities in the range of 15 to 26 Ohm m are linked to the Las Sierras Middle Group and Fossil Soils (SF), located at depths exceeding 80 meters. It is possible that this layer extends beyond the 160 m depth of the ERT probing.
These characteristics align with a prospecting study conducted by the Japan International Cooperation Agency (JICA) in 1993 using Vertical Electrical Sounding, which reached a maximum depth of 750 meters. According to our results, the initial layers identified in that study correspond to Qal, QvM, and TQPs-M with SF, having resistivities of 8.0-25.0 Ohm m, 10-200 Ohm m, and 10-80 Ohm m for saturated soils, respectively. The resistivity trend observed in our investigation correlates with the findings of that study, as detailed in Table 2.
Tabla 2 Correlation between resistivity and lithology of the study area.
| Information | Lithology | Resistivities in this study (Ohm m) |
JICA Resistivities (1993) (Ohm m) |
Thickness of the layers in the tomographies (m) |
|---|---|---|---|---|
| Alluvial deposits | Clayey layers | 10 - 26 | 8 - 25 | 10-15 |
| Sandy layers | ||||
| Gravel layers | ||||
| Masaya Volcanic Group | Pyroclastic deposits | 30 -100 | 10 - 200 | 30-60 |
| Basaltic lavas (porous and self-brocked) | ||||
| Lava flows and pyroclastic fall deposits | ||||
| Alluvial sand and clayey materials | ||||
| Las Sierras Middle Group | Basaltic-andesitic agglomerate, tuffaceous breccia, tuff, pyroclastic flow, volcanic sands y fossil soil. | 15-26 | 10 - 80 | 80-100 |
The shallows alluvial deposits and the Las Sierras Middle Group behave similar in terms of resistivities. To estimate the differences between them and the Masaya Volcanic Group, we stacked the resistivities of ERT A in Site 1, and tested the resistivities using histogram and violin diagram (Figure 7a), right panels). We proceed in the same way with the ERT B data in site 2 (Figure 7b, left panels). We analyzed ERT A and ERT B by separate cause they were taken at different annual periods, so weather conditions and (therefore) soil humidity could affect the results.
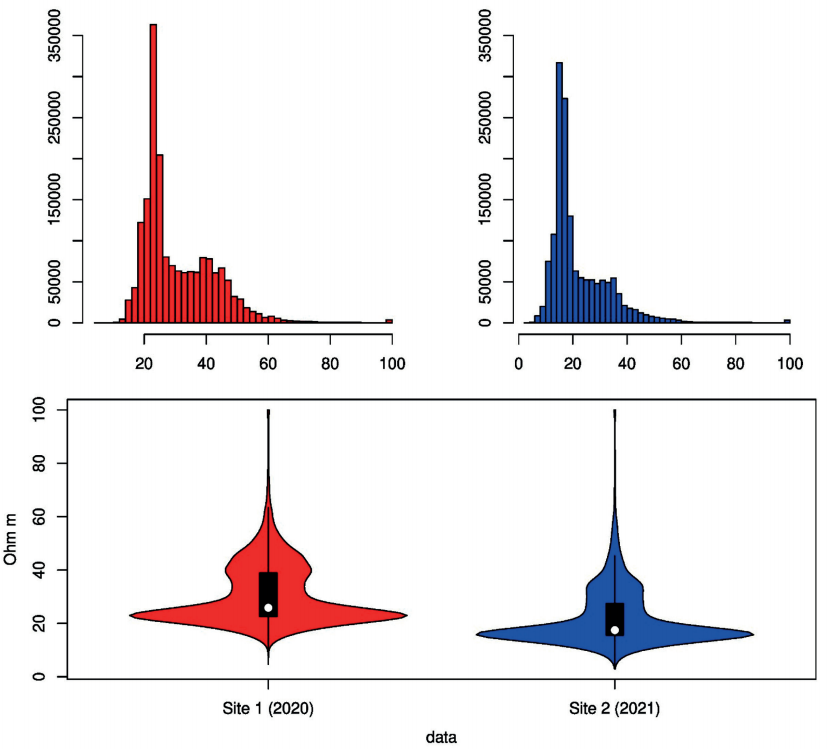
Figure 7 Upper panel: View of the distribution as a function of frequency for each of the sites. Lower panel: Violin plots showing the probability densities taking the samples. Figure a) ERT A (2020) at right and Figure b) ERT B (2021) at left.
However, we can see that resistivity values are pretty similar, both in values as well as in the distribution tendency. The global resistivity median of ERT A is 25.9 Ohm m and the one of ERT B is 17.5 Ohm m. Such difference is likely explained by the different levels of humidity due to the weather conditions at the date of the record of the data. Although the median is affected by this bias, the standard deviation remains similar in ~11.0 Ohm m for both.
Both histogram and violin show bimodal behaviors. Violins are used to highlight the differences of populations on a distribution, where the width of the violin is proportional to the frequency of a value in such range. We can observe the secondary maximum between 30 and 40-Ohm m, with higher resistivities associated to resistivities of the Masaya Group, while the primary and most important maximum is at 20-Ohm m, majoritarian associated to Las Sierras Middle Group but also to the shallow alluvial deposits.
3.2 Hidrogeophysical interpretation of TRE data and litology of the nearly wells
A conceptual model illustrating hydrogeological units grouped by resistivity distribution and their corresponding lithological indicators is presented in Figures 8 and 9. These units were delineated based on hydrogeological characteristics derived from well data, considering the electrical resistivity values associated with permeability.
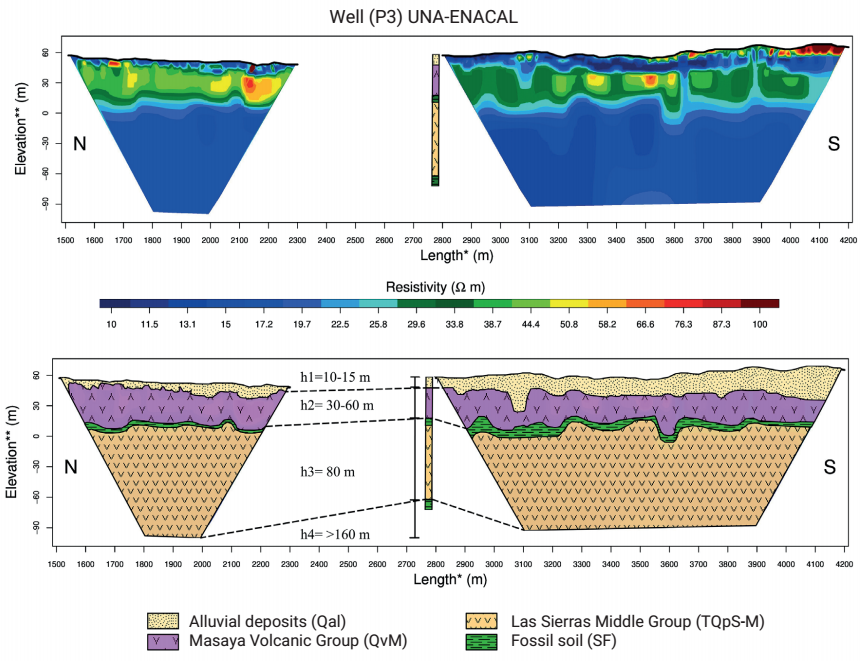
Figure 8 The correlation between geo-electric layers and geology is presented, where the first thin layer is associated with alluvial deposits (Qal) with a thickness of 10-15 meters, followed by the Masaya Volcanic Group (QvM) with a thickness of 30 meters, and the Las Sierras Middle Group (TQpS-M), bounded by Fossil Soil, with an accumulated thickness of 80 meters. Below this depth, it is likely to find Fossil Soils (SF) again, continuing with the layer of the Las Sierras Middle Group, as evidenced in the deepest well, JICA-3.
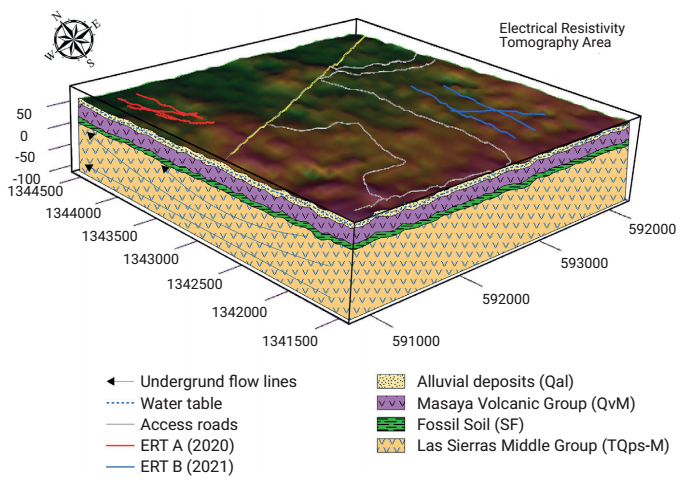
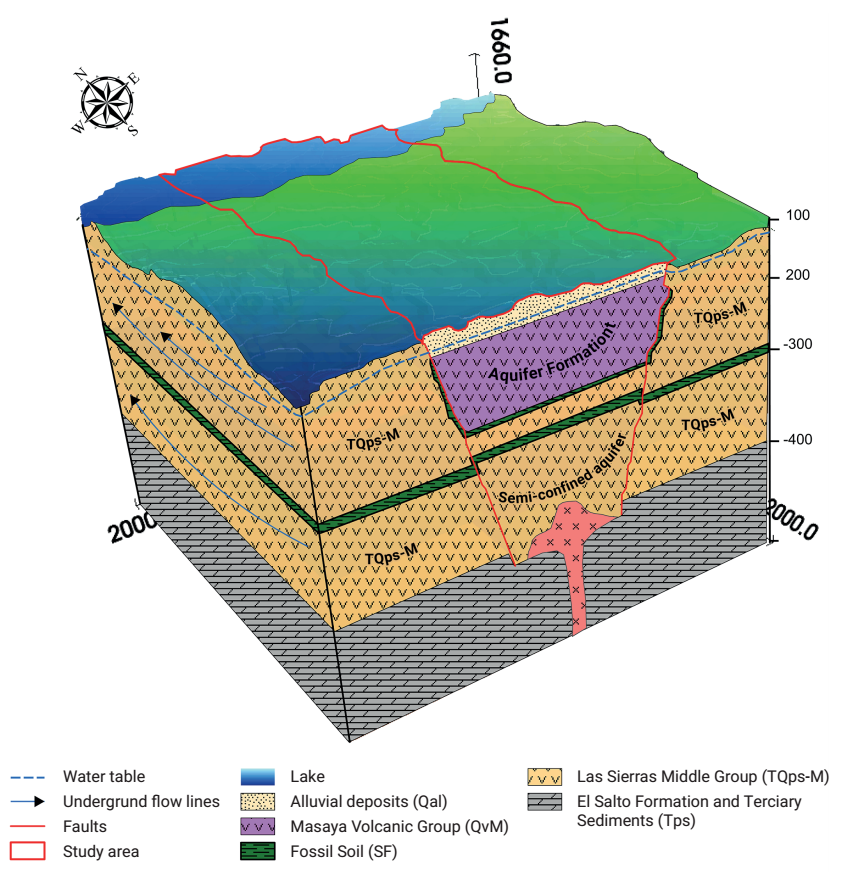
Figure 9 3D hydrogeophysical conceptual model delimited in the area where the geoelectric profiles are located.
The Hydrogeological Unit of alluvial deposits (Qal) is distinctive for its semi-permeable and saturated, as well as unconsolidated nature. Comprising various layers, including coarse sand, pumice, and scoria, this geological composition reveals the presence of volcanic materials, specifically linked to the Masaya Volcanic Group. The Quaternary pyroclastic deposits of this group consist of volcanic sand and debris flow accumulations.
In the coastal region of Lake Managua, the Hydrogeological Unit exhibits particular characteristics, notably the presence of fine sand, silty, and clayey materials. Additionally, thin lenticular layers of coarse sand and gravel indicate diversity in the sedimentary composition of the area.
The Masaya Volcanic Group Aquifer Formation (QvM) is characterized by distinctive attributes, marked by the presence of materials from basaltic-andesitic lava flows, which exhibit porosity, fracturing, and autobrecciation. Furthermore, permeable piroclastic deposits contribute to the unique geological configuration of this region, burying an ancient valley and confining the Main Aquifer of the Middle Group of Las Sierras (TQps-M).
The Semiconfined Aquifer belonging to the Middle Sierras Group TQps-M exhibits a complex geological composition, primarily composed of piroclastic flow materials, rock fragments, weathered zones with fossilized soils, basaltic-andesitic agglomerates, and volcanic tuffs. The aquifer's composition reveals a multi-layered structure. Semiconfinement is defined by a permeable or semi-permeable upper zone (QvM materials) and a less permeable lower zone (Tertiary Formation El Salto (Tps).
The hydrogeological system is characterized by the presence of a first semipermeable layer composed of alluvial deposits (Qal), which is in equilibrium with the highly permeable Masaya Group Formation (QvM). The latter facilitates groundwater flow, showing less saturation compared to the initial layer of alluvial deposits.
The Middle Sierras Aquifer (TQps) experiences hydrostatic pressure from the Qal and QvM layers. This phenomenon results from the confinement exerted by the Masaya Volcanic Group Formation (QvM), acting as a barrier contributing to maintaining pressure in the system. The interaction between these layers imparts a unique dynamic to the aquifer, where permeability and hydrostatic pressure play crucial roles in the hydrogeological balance of the region.
A second conceptual model has been formulated, building upon the findings from electrical prospecting surveys carried out by the Japan International Cooperation Agency (JICA) in 1993. The amalgamation of diverse geophysical and geotechnical data sources has facilitated a more thorough and intricate understanding of the subsurface. The identification of the El Salto Tertiary formation, along with the presence of dacitic and ignimbritic materials, implies the existence of distinct geological conditions that warrant consideration in subsequent geoscientific investigations in the region (refer to Figures 10 and 11).
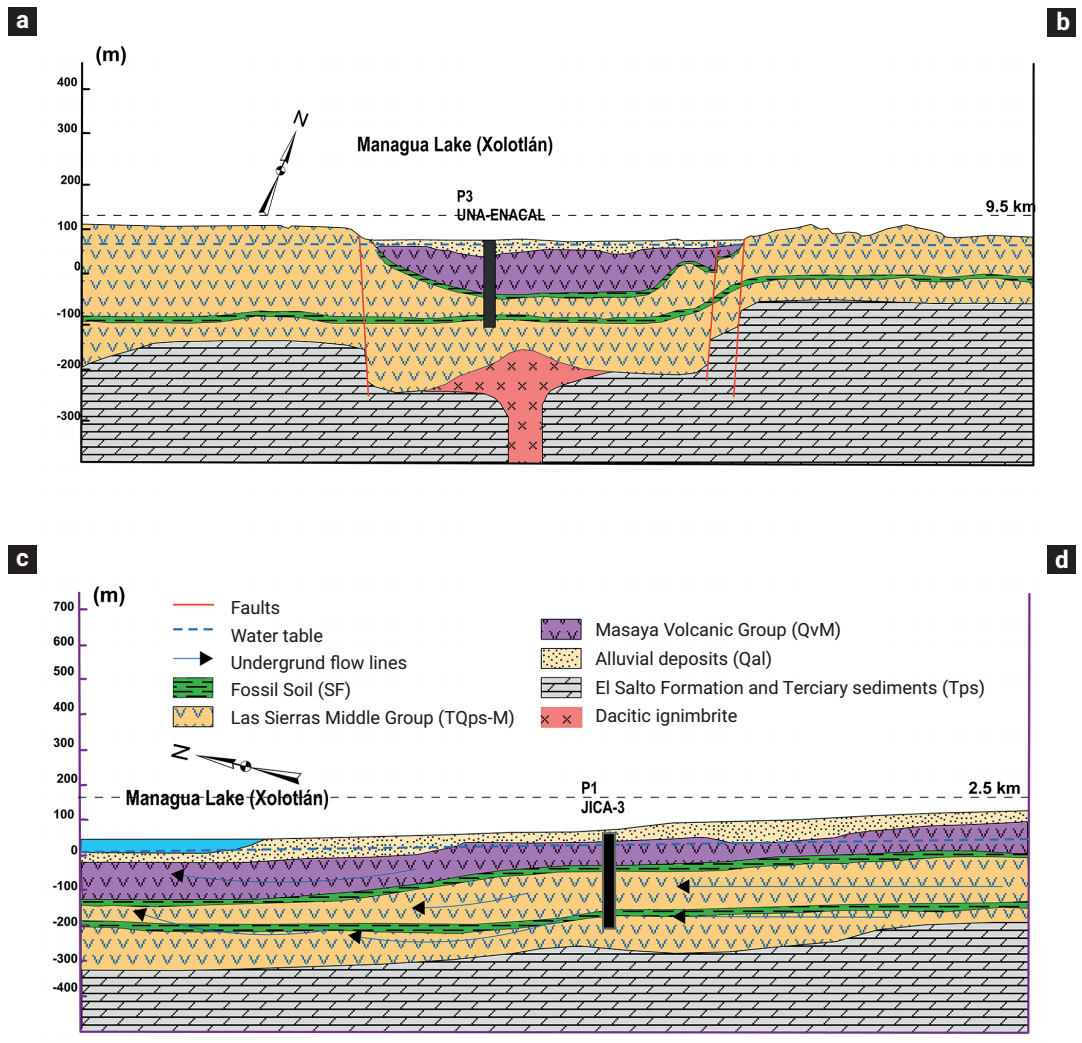
Figure 10 Conceptual Hydrogeological 2D models depict the a-b profile oriented perpendicular to Lake Xolotlán, showcasing a graben-type structure situated on alluvial deposits (Qal). Simultaneously, the c-d profile runs parallel to the lake.
4. Conclusions
The hydrogeological study presents a hydrogeophysical conceptual model of hydrogeological units in the region, grouped according to their resistivity distribution and lithological characteristics. The delineation of these units was based on data retrieved from wells, with electrical resistivity serving as an indicator of permeability. The Hydrogeological Unit of alluvial deposits (Qal) is distinguished by its semipermeable and unconsolidated nature, revealing a geological composition that includes coarse sand, pumice, and scoria. On the other hand, the Aquifer Formation of the Masaya Volcanic Group (QvM) exhibits notable attributes, such as basaltic-andesitic lava flow materials, pyroclastic deposits, and a unique geological configuration.
In the hydrogeological system, the interaction between the semipermeable layer of alluvial deposits (Qal) and the highly permeable Aquifer Formation of the Masaya Volcanic Group (QvM) is fundamental. This unique dynamic is reflected in the groundwater flow, displaying lower saturation in the Masaya Group layer compared to alluvial deposits. Additionally, the Las Sierras Medio aquifer (TQps) experiment hydrostatic pressure generated by the Qal and QvM layers, with the confinement exerted by the Masaya Volcanic Group layer crucial for maintaining pressure in the system. Collectively, permeability and hydrostatic pressure play crucial roles in the hydrogeological balance of the region.
In social terms, detailed knowledge of these hydrogeological units is essential for the sustainable management of water resources in the region. Understanding the interaction between the semipermeable layer of alluvial deposits and the highly permeable Aquifer Formation of the Masaya Volcanic Group has direct implications for the responsible exploitation of aquifer resources. Furthermore, recognizing the hydrostatic pressure generated by these layers contributes to proper planning of groundwater extraction, ensuring the long-term preservation of this vital resource.

