


 nueva página del texto (beta)
 Inglés (pdf)
 Artículo en XML
 Referencias del artículo
 Enviar artículo por email
 Citado por SciELO
  Similares en
SciELO
Similares en
SciELO 
 Permalink
1. Introduction
Water is basic for agriculture domestic, industry and construction. The geoelectrical techniques are widely used to detect the aquifer saturated zone. Vertical electrical sounding technique (VES) with Schlumberger configuration is the favorable effective technique for groundwater investigation.
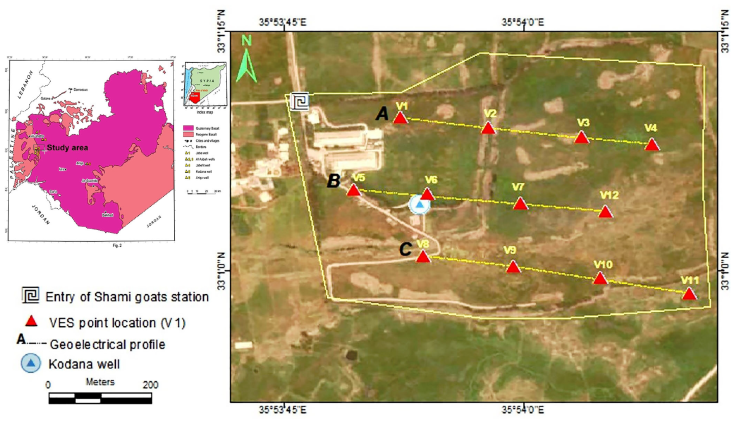
The present paper is a case study to show the application of VES technique for locating and drilling a successful well for groundwater water exploration at Kodana station for the Shami goats in southern Syria. The fat-tail triple purpose Awassi is the local breed in Syria and several neighboring countries in the Middle East. This breed is characterized by high adaptability and tolerance to stressful conditions and harsh environment. The Shami goat is seasonal and is native to Syria and has been introduced into some countries to improve the performance of the local breed. The locating and drilling of a borehole for groundwater in a basaltic environment is not an easy task, and surrounded by a lot of dangers if traditional VES technique is only applied, due to the sharp, rapid and brutal variations of basalt laterally and vertically.
Engineering geophysists in Syria have suffered a lot while groundwater exploration in basaltic environments, where high percentage failures in locating and drilling successful boreholes have been happened when applying only the traditional VES technique.
Internationally, all the geophysical efforts have been already concentrated and oriented towards supporting and combining the VES technique by another available geophysical technique.
Geoelectrical resistivity surveying techniques have been largely applied to determine the resistivity and thickness of layered structure for assessing the groundwater potential and successfully sitting boreholes in fractured unconfined aquifers (Muchingami et al., 2012). This has been traditionally done in benefiting from one-dimensional (1D) vertical electrical sounding surveys. However, the solely use of 1D VES do not furnish with comprehensive information for interpreting the subsurface hydro-geological features in a basaltic environments. The incorporation of two-dimensional (2D) geophysical techniques of electrical resistivity tomography (ERT) and (VES) for groundwater prospecting has been already proposed and often used to provide a more accurate interpretation of the basaltic subsurface hydro-geological features, from which potential successful borehole locations are identified (Muchingami et al., 2012). Muchingami et al., 2012 proposed the combination of 2D ERT with 1D VES to establish a subsurface resistivity model for evaluating the groundwater potential in the basaltic-green-stone formation of the Matsheumhlope well field in Bulawayo, Zimbabwe. Their proposed technique demonstrated its efficacy in comparing with the traditional VES, in providing precise hydro-geophysical model for the study area, by which suitable borehole locations for long term ground-water prospecting were easily identified.
The combination of two geoelectrical techniques of the constant separation traversing (CST) and VES was also proposed and used to determine the occurrence of fractures as most probable borehole sites in the southwestern flank of Mt. Cameroon, under-lained by basalts. An electrical image of the subsurface can be created by such a complementary combination tools of VES and CST, to evaluate groundwater distribution in the aquifer, such as the uncertainties in subsurface exploration are considerably reduced, and the most reliable locations for groundwater exploitation are successfully determined (Lordon et al., 2017).
An integrated combined geophysical approach using geo-electrical VES and gravity survey were recently proposed and practiced to study the effect of basement and hard rock on groundwater prospects in Mount Betung, Indonesia (Rustadi et al., 2022). The presence of the hard rock (andesite and breccias) caused several drilling failures for groundwater extraction, and the misalignment of the groundwater aquifers. Such failures are basically related to the randomly scattered fractures.
Because of the difficulties mentioned and the high level of failure in locating groundwater wells in basaltic environments, we were formally assigned this challenging duty, for which VES technology was adopted by a new proposed integrated methodology and applied in a basaltic environment in the Kodana study area. It is to mention that the same study Kodana area, although being very small (1Km*1Km), has been previously several times surveyed by traditional VES technique, where negative and failure results were unfortunately obtained. The reasons behind such a repeated failure are due to the fractures randomly distributed in the study region.
The research novelty in this paper is therefore not to practice as previously the traditional VES technique, but to use this technique within an integrated interpretative approach, based on Dar-Zarrouk parameters, with imposing and constraining different hydro-geophysical conditions. Such a proposed integrated approach helps largely in reducing considerably the uncertainties in subsurface exploration, and in determining successfully the most suitable location drillings for groundwater exploitation. Using this VES approach, the hydro-geoelectrical model is established as best as possible under each VES point. The importance of the proposed integrated VES technique is related to the fact that some laboratories do not possess a variety of geophysical techniques rather than VES one.
The present study area consists of successive volcanic deposits ranging from fragmented to very hard. The most important characteristic of the lithological section in these areas is the clay levels with the volcanic tuff resulting from basaltic decomposition, which significantly complicates the interpretation of the VES data.
The main objective of this paper is therefore the followings:
To characterize the subsurface basaltic environment in the Kodana station through interpreting twelve VES data points within a proposed integrated approach, based on Dar-Zarrouk (D-Z) parameters of total resistance (TR), transverse resistivity (ρt), total conductance (S), longitudinal resistivity (ρl), and anisotropy (λ).
To determine the hydro-geophysical optimal subsurface conditions to locate and drill a successful borehole for water extraction.
To follow the spatial variations of different resulting hydro-geophysical parameters mentioned above.
2. Material and methods
2.1 Vertical electrical sounding (VES) Technique
Indian resistivity meter model ACR-1 was used to measure the apparent resistivity of twelve VES in the study area with Schlumberger configuration.
The half-current electrode spacing AB/2 varied from 3.0 to 500 m and half-potential electrode spacing MN/2 varied from 0.25 to 20 m.
The apparent resistance (Ra) was first measured in the field, and converted later to apparent resistivity (ρa) for the Schlumberger array by using the following equation (Dobrain 1976):
Where G is the geometric factor formulated as follows:
The vertical electrical sounding curve was thereafter plotted in the next stage for each survey location, and smoothened to remove noisy signatures (Chakravarthi et al., 2007; Ebong et al., 2014).The curve matching technique with master curves were used firstly for interpreting the field resistivity curves to obtain an initial model including resistivities and thicknesses of the corresponding layers (initial model) (Orellana and Mooney,1966). The inversion WINRESIST software program of Velpen, 2004 is thereafter applied and practiced to interpret the parameters of the approximate model to definitely and accurately get the final optimum model, in which a goodness of fit between the field resistivity curve and the final theoretical regenerated curve was arrived (Zohdy, 1989; Zohdy and Bisdorf, 1989).
2.2 Hydro-Geoelectrical model and Dar-Zarrouk parameters
The quantitative 1D interpretation of the VES allows to get the fundamental parameters describing the geoelectrical layers as the real resistivity (ρi) and thickness (hi) values along the study research area; where the subscript “i” refers to the layer position in the geoelectrical depth section. Another geoelectrical parameters can be also established from those basic resistivity and thickness parameters, such as the total transverse resistance (TR) and the total longitudinal conductance (S). Maillet (1947)called TR and S as the Dar-Zarrouk parameters, which are mathematically derived as apparent parameters:
A unit square cross-section area cut out of a group of n-layers of infinite lateral extent is taken into consideration to obtain the hydro-geoelectrical parameters.
The total transverse unit resistance TR is expressed by the equation:
The total longitudinal conductance S is expressed by the equation:
Where h i and ρ i are the layer thickness and resistivity of i th layer in the depth section respectively.
TR and S of Equations (3 and 4) allow to get directly the transverse resistivity (ρt) and longitudinal resistivity (ρl) respectively as indicated by Equations (5 and 6).
The Dar-Zarrouk parameters are an efficient tool while interpreting the geoelectrical VES data oriented for groundwater exploration survey (Zohdy et al., 1974).
Generally, the longitudinal resistivity (ρl) is less than the transverse resistivity (ρt) unless the medium is uniform (Flathe 1955). Keller (1988) suggested also that the more conductive layers dominate the distribution of (ρl) (in the present case study, clay and weathered/basalts even if a small fraction of resistive layers are present).
The anisotropy parameter (λ) can be also derived by the combination of Equations (4 and 5) as expressed by Equation (7):
The (D-Z) parameters are developed in the present paper in order to characterize as precisely as possible both the geo-electrical section and the pyroclastic basaltic Neogene aquifer in the Kodana station, Southern Syria. Those parameters help largely in reducing the uncertainty (Maillet 1947), during interpreting and analyzing the subsurface lithological and structural characteristics.
The anisotropy parameter plays in addition a significant role in aquifer groundwater assessment.
3. Results and discussion
The study region is related to an active volcanic area. Geologically, a distinct period of active volcanism was prevailing over most Syria territories through Miocene to Holocene times. The younger volcanic commenced with sub-aerial flood basalts in the early Miocene, mostly 20-16 Ma, and extended over most of Southern Syria, Jordan, and Saudi Arabia (Ponikarov 1966).
Twelve field VES points were carried out in the study area (station of Shami goats), and interpreted by using a comprehensive computer inversion program (WinResist) for characterizing the subsurface formations and identifying the water bearing one. Those twelve VES data are distributed on three profiles (A, B, and C) as indicated in Figure 1.
The quantitative interpretations in term of 1D structure of those twelve VES measurements allow to get the real thicknesses and resistivities of the corresponding subsurface layers. Different geoelectrical layered models of five, six, and seven layers are shown in the study area as indicated in Table 1, and represented by different geoelectrical curves, due to the non uniformity of the study area.
Table 1 Interpretative results related to twelve VES points at Kodana station of Shami goats, Southern Syria.
| VES | No. layers | Resistivity of layers ρ (Ωm) | Thickness of layers h (m) | RMS | Curve type | |||||||||||
|---|---|---|---|---|---|---|---|---|---|---|---|---|---|---|---|---|
| ρ 1 | ρ 2 | ρ 3 | ρ 4 | ρ 5 | ρ 6 | ρ 7 | h 1 | h 2 | h 3 | h 4 | h 5 | h 6 | (%) | |||
| V1 | 5 | 30 | 128 | 46 | 159 | 175 | -- | 1.4 | 4 | 19 | 120 | -- | -- | 3 | KHA | |
| V2 | 5 | 182 | 23 | 131 | 191 | 114 | -- | 1.5 | 4 | 106 | 148 | -- | -- | 2.8 | HAK | |
| V3 | 5 | 98 | 34 | 90 | 269 | 121 | -- | 3.6 | 4.5 | 76 | 159 | -- | -- | 3.6 | HAK | |
| V4 | 6 | 102 | 51 | 151 | 206 | 241 | 175 | 5.5 | 4 | 95 | 145 | 100 | -- | 4 | HAAK | |
| V5 | 5 | 354 | 287 | 48 | 85 | 241 | 175 | 1.5 | 6.5 | 8 | 45 | 100 | 2 | HAK | ||
| V6 | 5 | 61 | 106 | 63 | 227 | 136 | 1.6 | 5.6 | 60 | 217 | -- | 2.1 | KHK | |||
| V7 | 5 | 31 | 81 | 102 | 229 | 108 | 1.6 | 5 | 50 | 161 | == | 2.6 | AAK | |||
| V8 | 5 | 556 | 60 | 110 | 306 | 204 | 5 | 2.3 | 181 | 191 | == | -- | 4.4 | HAK | ||
| V9 | 5 | 498 | 37 | 108 | 228 | 116 | -- | 3.4 | 3.5 | 90 | 152 | -- | -- | 2.6 | HAK | |
| V10 | 5 | 474 | 28 | 186 | 274 | 89 | -- | 4.2 | 4 | 78 | 137 | -- | -- | 3.2 | HAK | |
| V11 | 7 | 241 | 432 | 59. | 293 | 82 | 350 | 83 | 1.7 | 1.5 | 6 | 9 | 54 | 143 | 2 | KHKH |
| V12 | 6 | 674 | 62 | 159 | 90 | 208 | 102 | 3 | 11 | 28 | 41 | 187 | 6.2 | HAK | ||
*: Resistivity and thickness in bold represent the Neogene pyroclastic basalt aquifer.
Figure 2 shows the 1D quantitative graphic results of the twelve VES distributed along the three profiles A, B, and C.
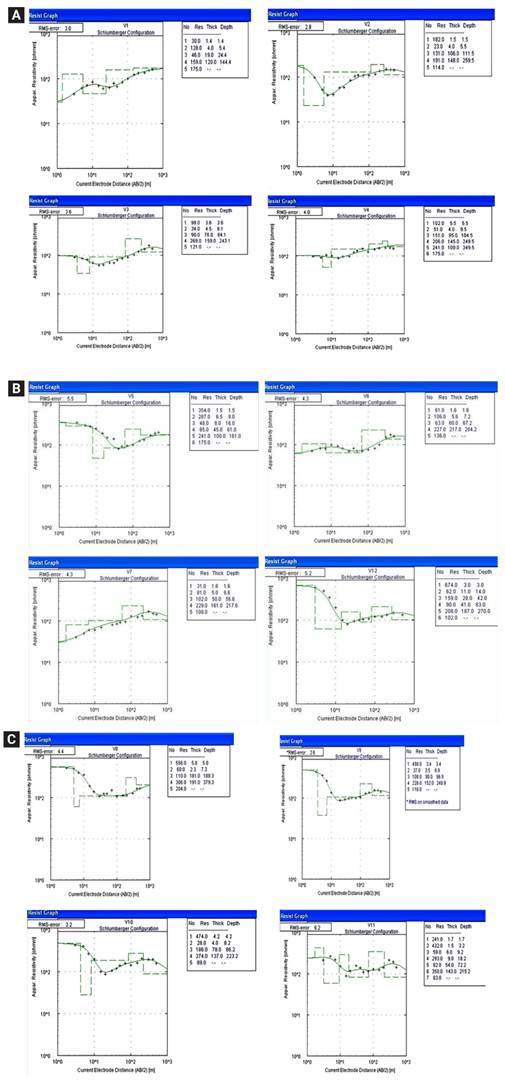
Figure 2 Twelve field VES measurements distributed on the three profiles (A, B, and C), their 1D inversion quantitative interpretations, and models.
The 1D quantitative interpretation results for those twelve VES sounding points using the inversion software of Velpen, 2004 are shown in Table 1.
The average value to the deepest interface (DI) in the 12 stratified models is about 250 m. DI varies between a minimum of 144.4m at V1 and a maximum of 379.3m at V8. The careful examination of the fits between the measured apparent resistivities and those calculated from the inverted 12 models indicates that this DI is warranted by the field geoelectrical data.
The real thicknesses and resistivities of the corresponding subsurface layers shown in Table 1 will be the base of the proposed integrated approach aimed at establishing the Dar-Zarrouk (D-Z) parameters as presented in Table 2.
Table 2 Resulting (D-Z) geoelectrical data of the 12 VES points.
| Location | E | N | h (m) | ρ (Ω.m) | S (Ω -1 ) | ρ l ( Ω.m) | TR (Ω.m 2 ) | ρt (Ω.m) | λ | R (Ω.m 2 ) |
|---|---|---|---|---|---|---|---|---|---|---|
| V1 | 35.89785 | 33.01934 | 120 | 159 | 1.240 | 116.45 | 20508 | 142 | 1.10 | 19080 |
| V2 | 35.89939 | 33.01916 | 148 | 191 | 1.750 | 148.3 | 42519 | 163.8 | 1.05 | 28268 |
| V3 | 35.90102 | 33.01900 | 159 | 269 | 1.600 | 151.9 | 50117 | 206 | 1.16 | 42771 |
| V4 | 35.90225 | 33.01887 | 100 | 241 | 1.88 | 186.2 | 69080 | 198 | 1.03 | 24100 |
| V5 | 35.89704 | 33.01808 | 100 | 241 | 0.727 | 83.91 | 6605 | 108 | 1.13 | 24100 |
| V6 | 35.89832 | 33.01800 | 217 | 227 | 1.989 | 142.88 | 53730 | 189 | 1.15 | 49259 |
| V7 | 35.89995 | 33.01784 | 161 | 229 | 1.300 | 167.4 | 42424 | 195 | 1.08 | 36869 |
| V8 | 35.89825 | 33.01692 | 191 | 306 | 2.310 | 164.00 | 81274 | 214 | 1.14 | 58446 |
| V9 | 35.89983 | 33.01674 | 152 | 228 | 1.590 | 156.00 | 46199 | 186 | 1.09 | 34656 |
| V10 | 35.90134 | 33.01654 | 137 | 274 | 1.072 | 208.00 | 54149 | 243 | 1.08 | 37538 |
| V11 | 35.90290 | 33.01627 | 143 | 350 | 1.210 | 178.00 | 58527 | 272 | 1.24 | 50050 |
| V12 | 35.90143 | 33.01770 | 187 | 208 | 1.710 | 158.00 | 49742 | 184 | 1.08 | 38896 |
Table 2 shows consequently the resulting (D-Z) geoelectrical data of those studied VES points.
The results include the GPS coordinates of N and E for those VES points, the different Dar-Zarrouk parameters discussed above, and the thickness (h), resistivity (ρ), and the transverse resistance (R) of the Neogene pyroclastic basalt aquifer.
The total transverse resistance TR (Ωm2) obtained according to Equation (3) varies between a minimum of 6605 Ωm2 at V5 and a maximum of 81274 Ωm2 at V8 (Figure 3).
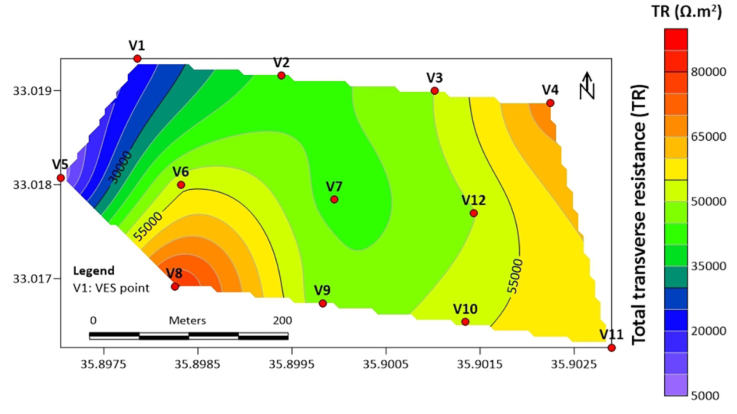
Figure 3 The distribution of the total transverse resistance of the study Kodana area, Southern Syria.
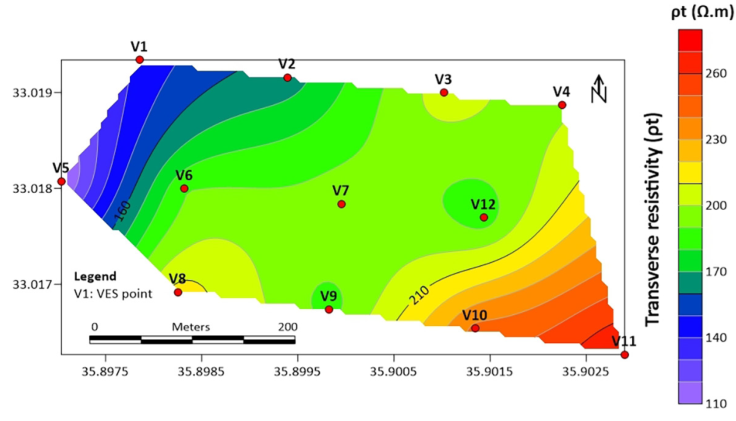
The transverse resistivity ρt obtained according to Equation (5) varies between a minimum of 108 Ωm at V5 and a maximum of 272 Ωm at V11(Figure 4).
The total longitudinal conductance S (Ω-1) obtained according to Equation (4) varies between a minimum of 0.73 Ω-1 at V5 and a maximum of 2.31 Ω-1 at V8 (Figure 5).
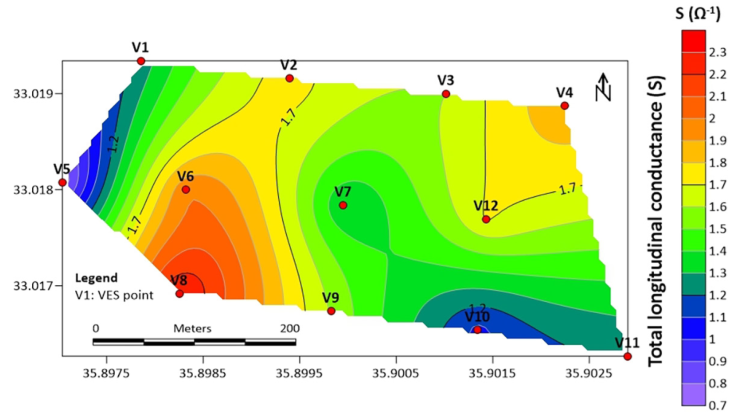
Figure 5 The distribution of the total longitudinal conductance of the study Kodana area, Southern Syria.
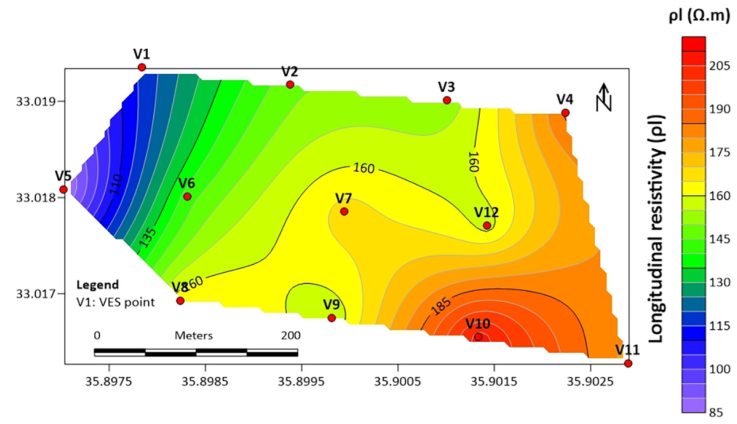
The longitudinal resistivity ρl obtained according to Equation (6) varies between a minimum of 83.9 Ωm at V5 and a maximum of 208 Ωm at V10 (Figure 6).
The anisotropy coefficient λ obtained according to Equation (7) varies between a minimum of 1.03 at V4 and a maximum of 1.24 at V11(Figure 7).
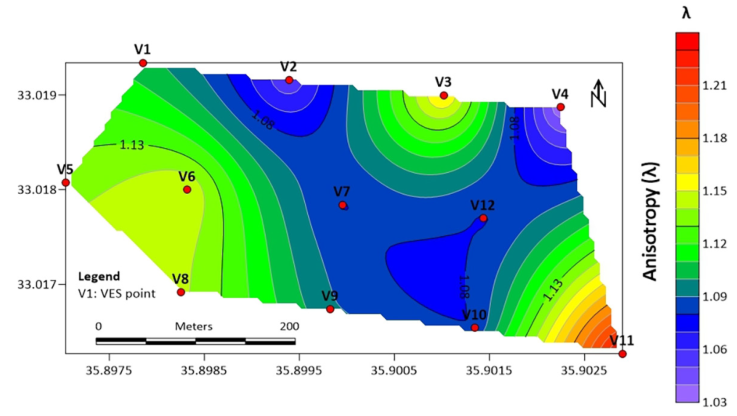
The anisotropy observed in the study region is due to the influence of the weathering, alteration processes and fracturing related to tectonic activities. Similar anisotropy results were obtained while characterizing the Quaternary fractured basalt aquifer (B1Q1) in Deir Al-Adas region, Southern Syria (Asfahani and Al-Fares, 2021). The anisotropy findings in the present case study are also in a good concordance with those obtained by Kumar et al. (2014), who mentioned that the high anisotropy values indicate different degrees of fracturing with better water holding ability in hard basaltic environments.
The Neogene pyroclastic basaltic aquifer in the study area is the fourth or the fifth subsurface layer as indicated in Table 1. Its thickness varies between a minimum of 100 m at (V4 and V5), and a maximum of 217m at V6 (Figure 8).
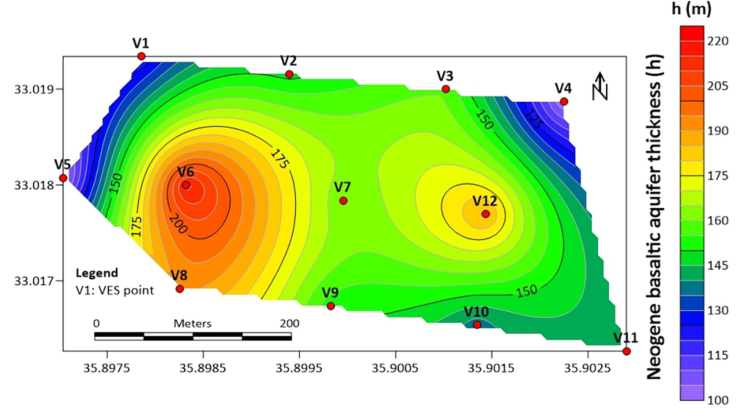
Figure 8 The distribution of the thickness of Neogene pyroclastic basalt aquifer of the study Kodana area, Southern Syria.
Its resistivity varies between a minimum of 159 Ωm at V1 and a maximum of 350 Ωm at V11 (Figure 9).
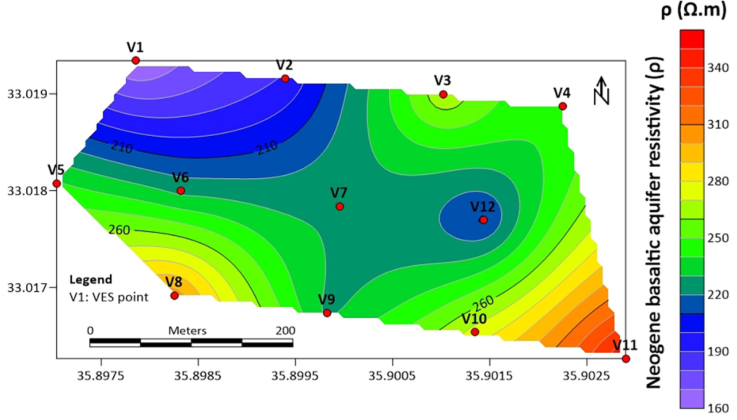
Figure 9 The distribution of the resistivity of Neogene pyroclastic basalt aquifer of the study Kodana area, Southern Syria.
The Dar-Zarrouk (D-Z) transverse resistance parameter of this aquifer R (the product of h and ρ as indicated in Table 2) varies between a minimum of 19080 Ω.m 2 at V1 and a maximum of 58446 Ω.m 2 at V8 (Figure 10).
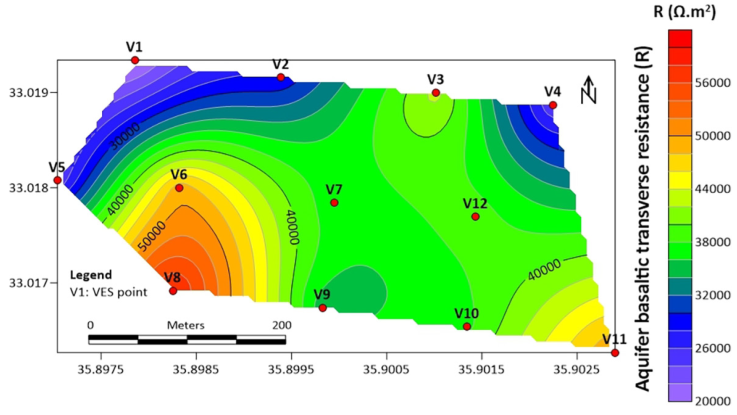
Figure 10 The distribution of the transverse resistance of Neogene pyroclastic basalt aquifer of the study Kodana area, Southern Syria.
Table 3 summarizes all the (D-Z) parameters obtained in the study area. The last layer in all the inverted twelve VES models shown in Figure 2 has a resistivity ranging between 83 Ωm and 204 Ωm. The thickness of this layer is not defined for being the last. This layer is not therefore included in the computation of D-Z parameters discussed above. The resistivities and the thicknesses of the layers above this last one are well determined and defined without any ambiguity and uncertainty, and are only taken into consideration while computing D-Z parameters.
Table 3 Statistical characteristics of the pyroclastic aquifer and its related (D-Z) parameters.
| Parameter | Min | Max | Average | (σ) |
|---|---|---|---|---|
| h (m) | 100 | 217 | 151 | 35.5 |
| ρ (Ω.m) | 159 | 350 | 243 | 51.1 |
| R (Ωm2 ) | 19080 | 58446 | 37002.7 | 11883.6 |
| S (Ω-1 ) | 0.73 | 2.31 | 1.53 | 0.44 |
| ρl (Ωm) | 83.9 | 208 | 155 | 32 |
| TR (Ωm 2 ) | 6605 | 81274 | 47906 | 19712 |
| ρt (Ωm) | 108 | 272 | 192 | 43 |
| λ | 1.03 | 1.24 | 1.11 | 0.06 |
The integrated approach in this paper is based essentially on supporting the VES results with the different D-Z parameters as discussed above. The 1D interpretation of V6 shows the presence of five layers as follows:
The first top surfacial soil layer of a thickness of 1.6 m and a resistivity of 61 Ω.m, the second layer has a thickness of 5.6 m and a resistivity of 106 Ω.m, the third layer has a thickness of 60m and a resistivity of 63 Ω.m, the fourth layer (Noegene pyroclastic basalt aquifer) has a thickness of 217m and a resistivity of 227 Ω.m, and the last fifth layer has a resistivity of 136 Ω.m. The other 11 VES points show similar geoelectrical results as V6.
The VES (V6) point is decided through the proposed geoelectrical approach to be the favorable and best location for drilling a successful borehole for groundwater extraction for the following reasons:
High thickness of Neogene pyroclastic basaltic aquifer (217m),
High Neogene pyroclastic basaltic aquifer resistivity (227Ωm) to have less percentage clay, that prevents hydraulic conductivity connection,
High Neogene basaltic aquifer transverse resistance (49259 Ωm2),
High anisotropy (1.15).
The four mentioned conditions are the base of the proposed integrated approach to determine and locate a suitable location for drilling successfully a groundwater borehole. Those conditions allow to get the optimum hydro-geophysical model under each of the VES points in the study area, and to reduce considerably the failures and uncertainties in locating and drilling a successful borehole.
It is to mention that the aquifer pyroclastic basalt layer is well determined in all the twelve studied VES points. This aquifer layer is located just above the last layer of resistivity changing between 83 Ωm and 204 Ωm.
Figure 11 shows geoelectrical cross section of the W-E profile. B, and the variations of the h, ρ, R, and λ parameters along this profile (Figure 1).
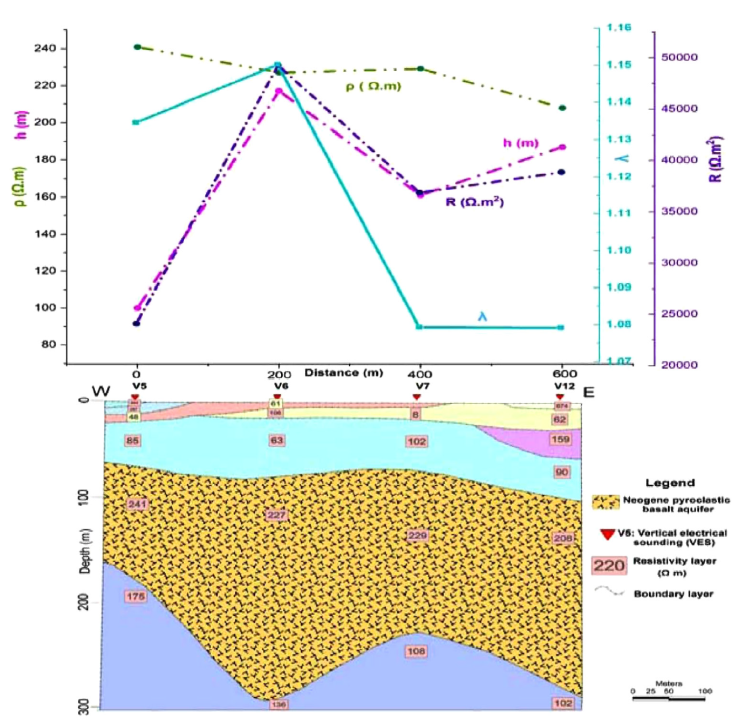
Figure 11 Geoelectrical cross section of the W-E profile (B) and the lateral variations of the h, ρ, R, and λ parameters along this profile.
It is to mention that the ranges of resistivity obtained through this 1D inversion quantitative interpretation are in a good agreement and concordance with those obtained while classifying and characterizing the long normal resistivity data of the Kodana well itself (Asfahani, 2011).
The water level and the contact between the two saturated and non saturated zones were determined in the study region through studying different nuclear neutron-porosity logs, as shown in Figure 12 (Asfahani, 2011).
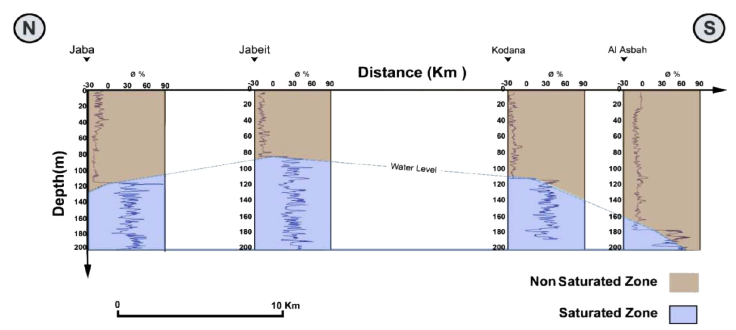
Figure 12 Water level and contact between saturated and non saturated zones in different wells in Southern Syria (particularly Kodana well), (Asfahani, 2011).
Figure 13 (a and b) shows the lithological and hydrological characteristics of the well drilled at V6.
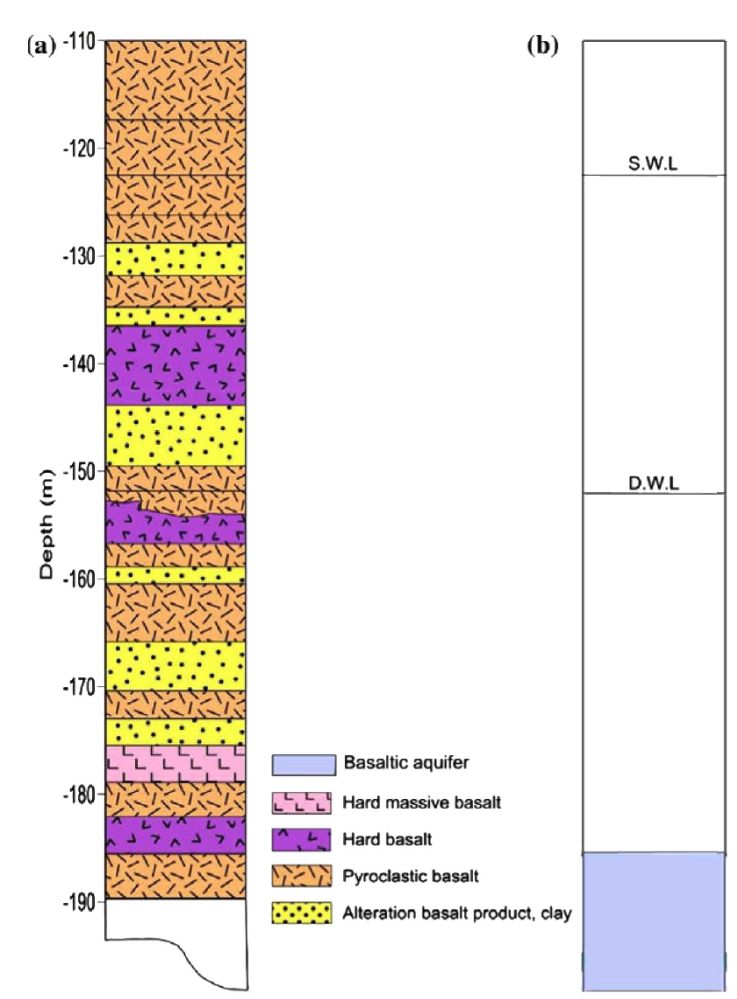
Figure 13 (a) Lithological characteristics of the saturated zone of the Kodana well, (b): Hydro-geological characteristics of the Kodana well (Asfahani 2017-a).
The main confined fractured Neogene pyroclastic basalt aquifer in the drilled Kodana well has a thickness varying between 8 and 10 m, with an average of 5 m, and it is localized at a depth of 186 m. The static water level (S.W.L) is found at a depth of 122 m, whereas the dynamic water level (D.W.L) is found to be at a depth of 153 m (Figure 13). The discharge of 20 m 3 /h corresponds to an hydraulic conductivity of 3.09 m/day, and a transmissivity (T) of 15.46 m 2 /day is obtained for that well, according to the pumping test (Asfahani, 2017-a). Kodana well is of a pressure type, where the drastic descent of the water column is of about 31 m. Another seasonal free water-bearing horizon exists, which is localized at the depth interval of 100-110 m, and depends on the rainy annual periods.
The range of the hydraulic conductivity parameter established for the Kodana well of less or equal 8.8 m/day for the pyroclastic basalt is in an excellent agreement with that obtained (from 1.97 m/day to 8.97 m/day) for the Quaternary basaltic aquifer in Deir Al-Adas area, Yarmouk Basin, Southern Syria, (Asfahani and Al-Fares; 2021).
Asfahani., 2012, 2013 has already developed an alternative VES approach, in which, it has been found a positive empirical relationship between the transverse resistance (R) and the transmissivity (T) for the Quaternary aquifer in the Khanasser valley region, Northern Syria. Asfahani and Al-Fares, 2021 have already also found a similar positive empirical relationship between the hydraulic conductivity (K) and the transverse resistance of the Quaternary fractured basalt aquifer (B1Q1) in Deir Al-Adas region, Southern Syria. Those two mentioned findings justify the reason behind which we were looking for the Neogene pyroclastic basalt aquifer of optimum high transverse resistance (R) as represented for the VES location at V6, where the Kodana well was successfully drilled.
Asfahani, 2017-b has already also classified four types of basalt in the study area by adapting the non linear statistical fractal technique with using the concentration -number model (C-N) and log-log graphs, and applying it on resistivity long normal well logging data as follows (Table 4):
Hard massive basalt is characterized by a resistivity of bigger than 347 Ωm.
Massive basalt is characterized by a resistivity ranged between 204 and 347 Ωm.
Pyroclastic basalt is characterized by a resistivity ranged between 117.5 and 204 Ωm.
Alteration basalt product, and clay are characterized by a resistivity of less than 117.5 Ωm.
Table 4 Basalt characterization by long normal resistivity well logging technique (Asfahani, 2017-b).
| ROCK TIPE | Long Normal Resi (Ωm) | |||
|---|---|---|---|---|
| 200 | 400 | |||
| Hard massive basalt |

|
|||
| Hard basalt |

|
|||
| Pyroclastic basalt |

|
|||
| Alteration basalt product, clay |

|
|||
One can therefore interpret the geoelectrical results obtained in this research study in lithological description term by calibrating the resistivity range values obtained already by WinResist as documented above, with those values obtained by fractal long normal resistivity well logging technique.
Different methodological researches have been already carried out in this successful drilled well at V6 location (Asfahani, 2011, 2014, 2017; Asfahani, 2017-a; Asfahani and Abdul Ghani, 2012; and Asfahani et al., 2015), that concentrated only on the saturated zone in that well (from a depth of 115m).
This paper shows the importance of the surfacial geoelectrical study with the proposed integrated approach, in which the efficacy of the VES technique is increased, and the high failure in locating and drilling a successful groundwater borehole is considerably decreased. It is a successful case study in a hard basaltic environment characterized by sharp lithological variations laterally and vertically, applied widely in Syria, and could be practiced in other worldwide similar basaltic areas.
4. Conclusions
Geoelectrical integrated approach is proposed in this paper to support and increase the application efficacy of the vertical electrical sounding (VES) technique, oriented towards locating and drilling successful groundwater boreholes in basaltic environments. This approach is essentially based on analyzing Dar-Zarrouk (D-Z) parameters with constraining several specific conditions that insure to get the optimum hydro-geophysical model. The advantage of such a VES proposed approach is the possibility to apply it solely in comparing with other geo-physical techniques that require basically the combination of VES technique with another available geophysical technique as documented in this paper.
Schlumberger configuration is adapted while carrying out the VES measurements to locate and drill a successful borehole for groundwater extraction in the Kodana station for the Shami goats, Southern Syria.
The geoelectrical cross section of the basaltic environment and the Neogene pyroclastic basalt aquifer established for profile. B in the study area are well characterized by the use of both the 1D inversion technique and the different Dar-Zarrouk-parameters of transverse resistivity, longitudinal resistivity, and anisotropy. Similar geoelectrical cross sections could be obtained for profiles A and C.
The optimum and favorable conditions for locating and drilling a successful groundwater borehole are well documented and determined in the Kodana station, where the VES point (V6) was decided to be the best location for this purpose.
The 1D geoelectrical results obtained in this paper could be easily transferred to be expressed in lithological description term, through calibrating the resistivity range values obtained already by WinResist with the resistivity values obtained by fractal concentration-number model (C-N), applied on long normal resistivity well logging data at Kodana well (Asfahani, 2017-b).
The different hydro-geophysical parameters of the Neogene pyroclastic basalt aquifer related to Kodana well, drilled at the V6 point were well characterized. Although the study area is too small of (1Km.1Km), however, it was geoelectrically shown the presence of different geoelectrical curve types, indicating the complexity, and the difficulty of such basaltic regions.
The geoelectrical survey presented in this paper is an interesting case study for engineering geophysists to show them how we can deal easily with such difficult basaltic environments, that sharply change laterally and vertically, through proposing an integrated VES approach, establishing and combining integrally the different discussed hydro-geophysical parameters. Such a proceeding reduces the uncertainties and the failures in locating and drilling a successful borehole.
The VES technique within the proposed approach is therefore recommended to be applied worldwide for groundwater investigations, and for determining the suitable favorable locations for drilling successful boreholes in basaltic environments.

