nueva página del texto (beta)
 Inglés (pdf)
 Artículo en XML
 Referencias del artículo
 Enviar artículo por email
 Citado por SciELO
  Similares en
SciELO
Similares en
SciELO 
 Permalink
1. Introduction
Several quantitative approaches have already been undertaken and deeply discussed for interpreting the direct current (DC) earth resistivity measured data (Ghosh, 1971; Zohdy, 1975, 1985; Koefoed, 1979). Each interpretative technique is based on a separate approach and methodology, with its own limitations regarding suitability and accuracy in relation to different subsurface conditions.
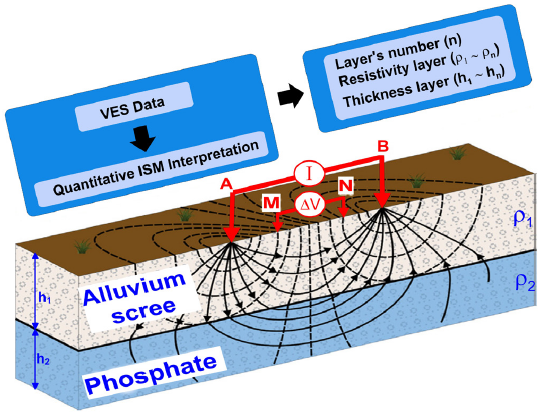
The geoelectrical DC techniques have been introduced and used in different ways in expanded phosphate resource prospecting programs in Syria, and have given acceptable results in terms of evaluating the structural and geological conditions of the subsurface phosphatic environments (Asfahani & Mohammed, 2000; Asfahani, 2010).
Schlumberger configuration was already used to carry out the vertical electrical soundings (VES) field measurements in Al-Sharquieh mine, Syria. An interpretative conventional approach, including the Curve matching method (CMM) was first practiced to interpret those VES data to obtain the initial geoelectrical model. The inversion technique was thereafter used to get the final geoelectrical model (Asfahani &Mohammed, 2000; Velpen, 2004; Asfahani, 2016). The complexity of the lithological section in the study area and the limitations of the interpretative technique itself make the task difficult.
The facies of phosphate deposits in the Al-Sharquieh mine are characterized by very sharp changes in all directions. The resolution of the CMM is quite poor, such that the thin layers buried at depths more than five times their thickness cannot be recognized on the logarithmic plots. The different difficulties encountered during quantitative interpretations of the VES measurements have produced many spurious results.
The same VES data measured in Al-Sharquieh mine were reinterpreted by a new adapted and developed structural approach with the modified geoelectrical Schlumberger configuration (Asfahani, 2010), to enhance the results obtained by CMM. Asfahani's approach (2010) gave acceptable information about the subsurface structure and mentioned the presence of four main electrical horizons, each with a specific resistivity.
The geoelectrical combined sounding-profiling configuration, developed already by Asfahani, in 2019 was also applied to characterize the sedimentary phosphatic environment in the Al-Sharquieh deposit mine in Syria.
The inverse slope method (ISM) designed by Narayan and Ramanujachary (1967) is used to potentially interpret the VES data measured and collected by any geoelectrical configurations unlike traditional interpretation methods (Haby, Senosy, & Abdel Aal, 2013). ISM has evidently several advantages relative to other available interpretative techniques. Thus, the ISM was also recently used to reinterpret the same VES data from Al-Sharquieh mine (Asfahani, 2016). George et al., (2022) used the ISM technique as an efficient tool for exploring groundwater and related resources.
The PHT (1985), the most sophisticated method for characterizing the subsurface tectonic structures has been also used to characterize the phosphatic structural subsurface in the Al-Sharquieh mine (Asfahani, 2010).
Both techniques of ISM and PHT have been widely used for solving different hydrological, tectonic and mining problems in Syria and Arbil Iraq (Asfahani and Mohamed, 2002; Asfahani and Radwan, 2007; Asfahani, 2010; Asfahani et al., 2010; Al-Fares and Asfahani, 2018; Sirwa and Asfahani, 2019; Asfahani et al., 2023). Asfahani and Al-Fares, 2023 have recently calibrated the PHT results above an excavation at the Mehanbel area in the Al-Ghab region, where an exact concordance has also been obtained with the real positions of the recent and Quaternary structures in the study area.
A new semi-quantitative approach based on the fractal modeling technique of the concentration-number (C-N) model, and with adapting the threshold break points concept is recently introduced and proposed to interpret the measurements of vertical electrical sounding (VES) distributed along a given profile, and to readily differentiate between different apparent resistivity populations (Asfahani, 2021; Asfahani and Al-Fares, 2021). This fractal technique allows for two-dimensional (2D) semi-quantitative interpretation and a preliminary geological analysis along the geoelectrical profile under analysis. The fractal (C-N) modeling technique was applied for characterizing the Khanasser valley region in Northern Syria (Asfahani, 2021), and the basaltic formation in the Deir El-Adas region, Yarmouck basin in Southern Syria (Asfahani and Al-Fares, 2021).
The frequent question always posed is related to the reliability of the mentioned interpretative methods in comparing with real subsurface geology. The presence of an excavated ditch is a good occasion to test and examine directly on the field the reliability of those three interpretative geoelectrical techniques. This trench was not excavated specifically for phosphate and uranium prospecting, but was drilled as a rainwater drainage channel to protect the Eastern Al-Sharquieh mine site from the flow of flood waters during periods of torrential formation.
Ten VES measurements distributed along a parallel profile to the mentioned ditch, and carried out with Schlumberger configuration, have been interpreted in this paper by those three mentioned techniques.
It is to be mentioned that this paper is not to explore a ditch, but to confirm the reliability and confidence of the mentioned three interpretative techniques (ISM, PHT, and C-N) in such mining applications, by benefiting from and calibrating their results with well observed ditch lithology.
To achieve the main objective of this paper, the following was done:
Carrying out VES measurements along and parallel to the excavated ditch by using the Schlumberger configuration.
Testing and calibrating the ISM, PHT, and concentration-number fractal (C-N) model.
Studying the electrical resistivity variations as a function of depth (AB/2) by using the fractal (C-N) model.
Carrying out a radioactive geological field survey along the excavated ditch.
Getting knowledge about the distribution of a real lithological sequence, and describing the phosphatic layers through this sequence.
Determining the favorable horizons for uranium occurrences through studying and analyzing the real lithological section along the excavated ditch.
2. Geological setting of the phosphatic region
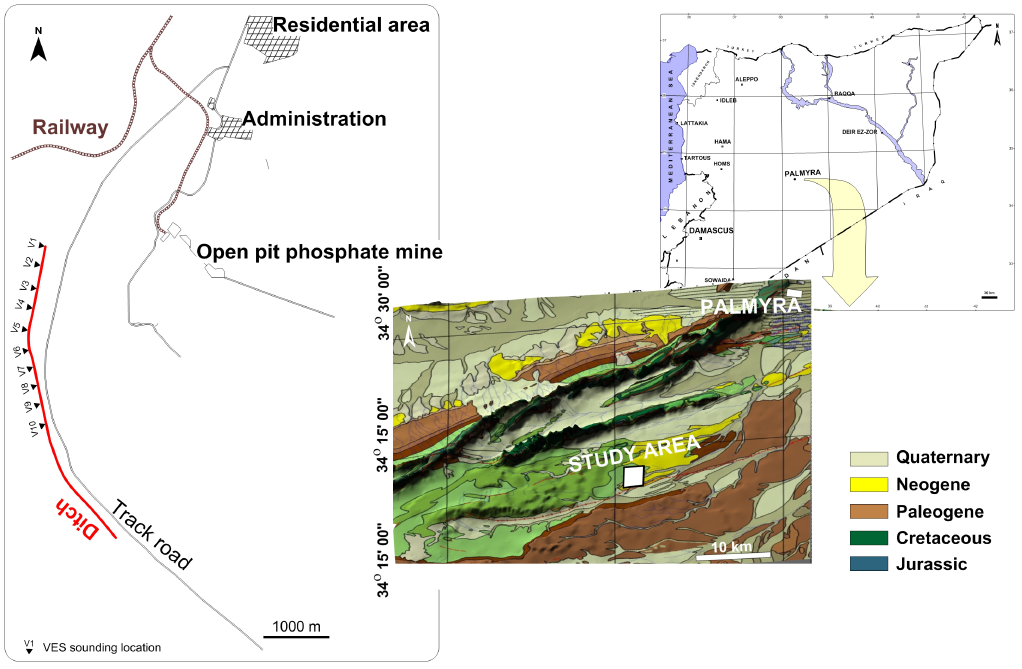
The Palmyrides are located in central Syria and are 350 km long, with an NE-SW elongated ridge (Fig. 1a). An extensive internally-drained basin called a Daww basin filled with Neo-gene-Quaternary deposits separates Northern and Southern Palmyrides.
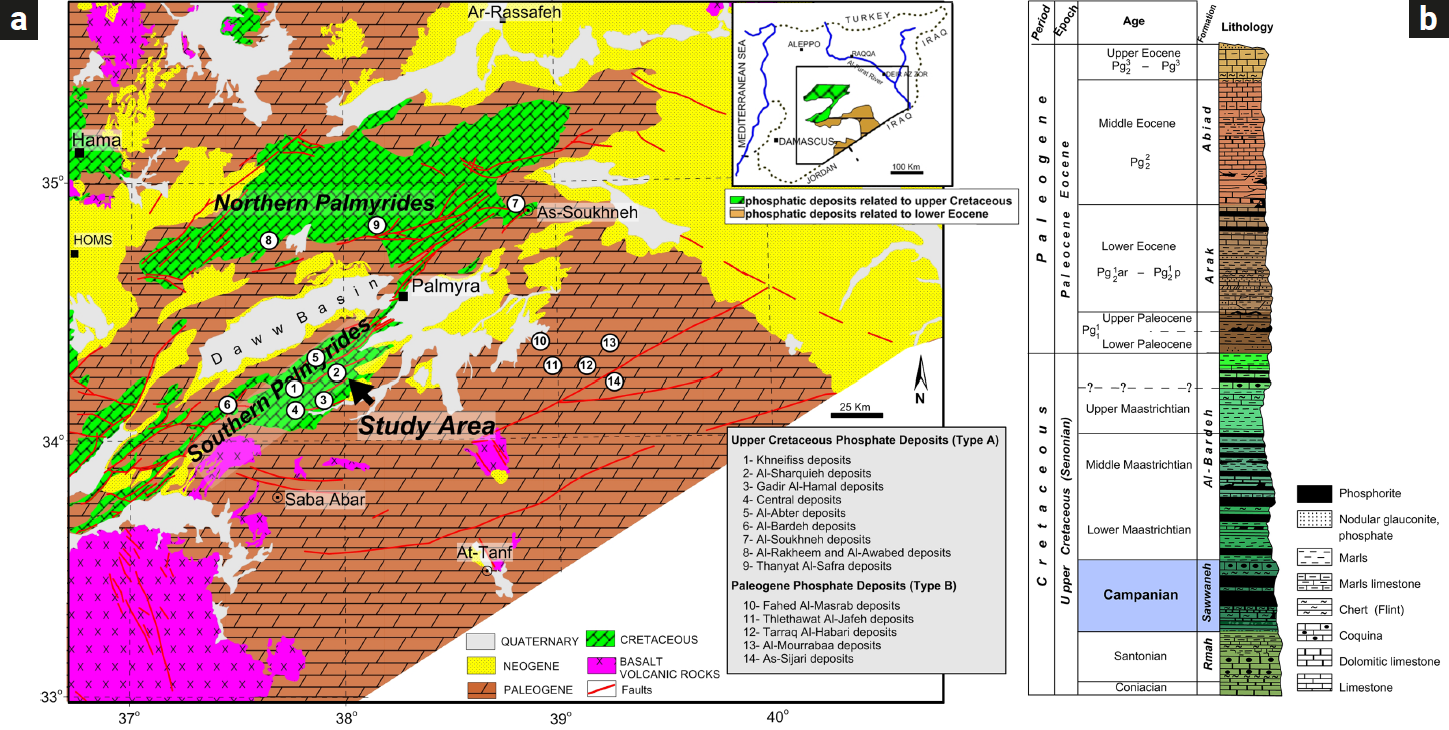
Figure 1 (a): Geological map of the study area showing the main phosphatic deposits, (b): Typical geologic column of the phosphate deposits from central Syria.
A sedimentary sequence consisting of several lithologic units, including the Soukhneh formation is outcropped in the Palmyrides ridge from the upper Triassic to the Neogene. The Soukhneh Formation composed of calcareous and siliceous rocks has significant phosphorite deposits.
The calcareous units are characterized by limestone, marly limestone, limy marl, and marl with characteristic limy balls ranging in size from a few centimeters up to 2 m in diameter. The thin-layered flint horizons or flint lenses and nodules characterize the siliceous rocks.
The phosphatic layers in the central part of the Palmyrides are thick, and become thin eastward. Those layers disappear completely under the marly deposits of the Arak and Tantour formations. Two A and B phosphatic deposits types are distinguished in Syria (Figs. 1a, and 1b). The phosphates of the Late Cretaceous age are related to type A, while the early Eocene Syrian Desert phosphorites are related to type B (Ponikarov 1966).
Al-Sharquieh and Khneiffis are the two main mines in Syria for phosphate's exploitation (Fig. 1). The phosphate layer at Al-Sharquieh mine gradually thickens to the south and southwest, where the layers are approximately horizontal (Abbas, 1987).
The phosphatic deposits are accompanied by primary and secondary uranium mineralizations. The former is associated with phosphate precipitation, while the later fills open cracks and pores, due to surface and subsurface percolation (Abbas, 1987). The geological column shown in Fig. 1b indicates several phosphorite beds ranging in age from Late Cretaceous (Campanian) to Paleogene (Late Eocene; Atfeh, 1967; Jubeli, 1986; Abbas, 1987).
The following lithological facies can be encountered in Al-Sharquieh mine (Asfahani& Mohamad, 2000):
alluvial soil with calcareous rocks;
calcareous clayey rocks accompanied by phosphate;
phosphatic calcareous rocks;
fractured dolomite;
marl with interbedded clay;
phosphatic sand;
cherty layers.
Figure 2 shows the study area with the excavated ditch and the ten VES locations.
3. Geoelectrical VES technique and interpretations
3.1. VES
The vertical electrical resistivity sounding (VES) method is applied to determine the vertical variations in electrical resistivity. A maximum current electrode spacing (AB/2 = 106.6 m) of 106.6 m was chosen for all the VES soundings carried out in this research.
Table 1 shows the current and potential electrode separations AB/2 and MN/2 used in this paper. Those separations are purposely selected in this work to carry out shallow VES measurements, where more detailed ditch lithological information is required.
Table 1 AB/2 and MN/2 used and their corresponding geometrical factor (K)
| AB/2 | MN/2 | K |
|---|---|---|
| 1 | 0.2 | 7.48 |
| 1.3 | 0.2 | 13.08 |
| 1.68 | 0.2 | 21.68 |
| 2.18 | 0.2 | 39.25 |
| 2.82 | 0.2 | 62.8 |
| 3.66 | 1 | 19 |
| 4.74 | 1 | 36.51 |
| 6.15 | 1 | 57 |
| 7.97 | 1 | 95.15 |
| 10.33 | 1 | 165.3 |
| 13.38 | 2.5 | 104.67 |
| 17.35 | 2.5 | 184.7 |
| 22.49 | 2.5 | 314 |
| 29.15 | 2.5 | 523.3 |
| 37.78 | 2.5 | 897.14 |
| 48.87 | 2.5 | 1256 |
| 63.48 | 2.5 | 2616.67 |
| 82.27 | 2.5 | 4186.67 |
| 106.6 | 10 | 1744.4 |
Ten VES soundings were carried out with a Schlumberger array in the study area, where their locations are shown on Fig.2. More details about this VES technique is shown in appendix-1.
3.2. ISM
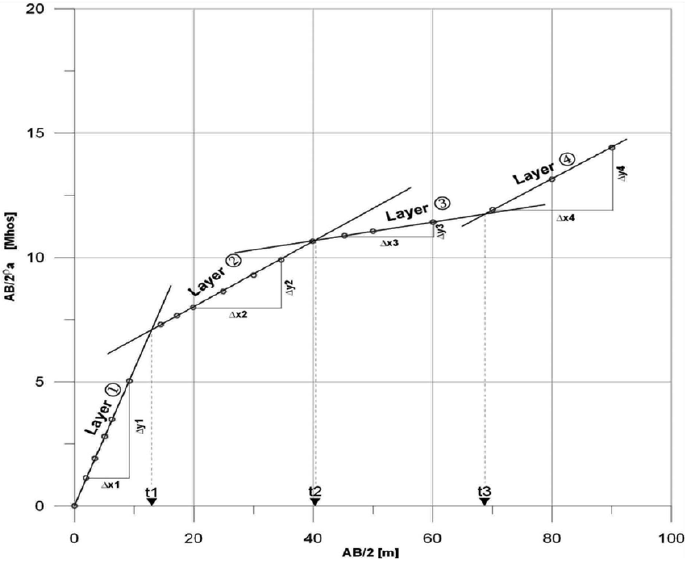
This technique is widely used for estimating the different parameter layers in 1D resistivity surveys (Narayan and Ramanujachary, 1967). A simple linear graph paper is used in ISM to plot the field VES Schlumberger data for producing a straight line segment by joining various points. More details about the ISM technique are in appendix-2.
The applicability and suitability of the ISM were recently tested and proven, while interpreting vertical electrical soundings (VES), carried out in the Adamawa region of Cameroun, Central Africa, for hydro-geophysical and groundwater purposes related to the Pan-African aquifers (PAA) (Asfahani et al., 2022).
This ISM is practiced herein for calibrating and interpreting the ten VES data acquired along the excavated ditch. This calibration is done to know at which degree the concordance exists between the ISM interpretative results and the known and observed lithology ditch.
The ISM technique permits the determination of the real resistivities and thicknesses of the corresponding identified layers. Different complicated geological problems have been recently solved in Syria by applying ISM, where it has proven its high performance in comparison with the traditional curve matching method (CMM) (Asfahani, 2016).
3.3. Pichgin and Habibullaev Technique
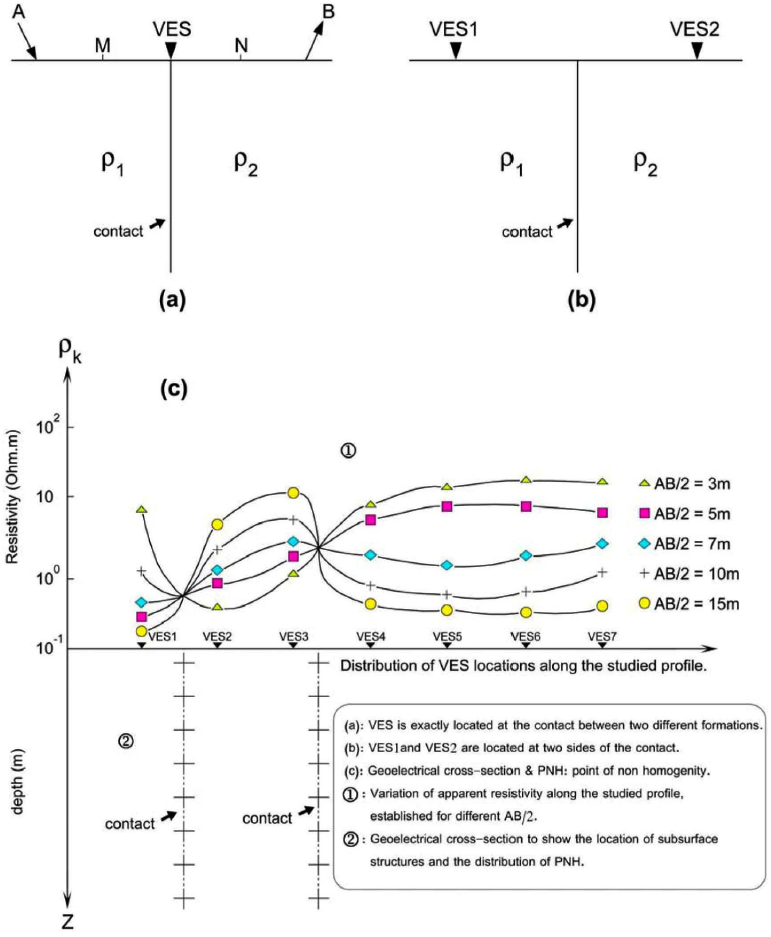
The Pichgin and Habibuleav technique is the most sophisticated for determining subsurface structural features (Asfahani, 2007; Asfahani, 2011). It is used to interpret vertical electrical soundings (VES) carried out along a given profile (Pichgin and Habibullaev, 1985). Appendix-3 provides more details about this technique.
Different assumptions of this technique, shown in appendix-3, have been well calibrated and verified through different field examples and applications in Syria, where this technique has proven its efficacy in dealing with and solving different field mining, hydrogeological, geological and active tectonic problems (Asfahani and Mohamad, 2002; Asfahani and Radwan, 2007; Asfahani et al., 2010; Al-Fares and Asfahani, 2018; and Asfahani and Al-Fares, 2023). This technique is practiced herein to interpret and calibrate the ten VES data acquired along the profile parallel to the excavated ditch (Fig. 2). This calibration is done to know at which degree the concordance exists between the PHT interpretative results and the known and observed lithology ditch.
3.4. Fractal concentration-number (C-N) modeling
The concentration-number (C-N) multifractal model is practiced in this paper as a new application approach with the log-log graph for interpreting the VES measurements distributed along the study ditch profile, and for explaining their apparent resistivity variations with depth through differentiating between different resistivity population ranges. The following equation (Mendelbort, 1983) expresses the fractal concentration-number (C-N) model:
Where ρ denotes the treated apparent resistivity (Ω.m) values. The N(≥ρ) is the cumulative number of the apparent resistivity data (CNρ), with the apparent resistivity values greater than or equal to ρ, F is a constant and D is the scaling exponent or fractal dimension of the distribution of apparent resistivity values. The log-log graph presentation allows for determination of different break points with different straight line segments (SLS). Every SLS corresponds to a defined lithological unit with a specific resistivity range.
This (C-N) technique is applied to interpret and calibrate the ten VES data acquired along the profile parallel to the excavated ditch (Fig. 2) and to distinguish between different apparent resistivity ranges. The aim of this calibration is to know at which degree the concordance exists between the fractal (C-N) interpretative results and the known and observed lithology ditch.
4. Results and Discussion
Geoelectrical and radioactive studies have been carried out on the existing excavated ditch, extended in the north western vicinity of Al-Sharquieh mine locality, with a length of 2.5 km long, 5 m, wide with different depths of up to tens of meters, depending on the topography of the ditch (Fig 2). The litho-sequence traversed by this ditch has been investigated in detailed along the two eastern and western sides of the ditch walls. Geological cross-section and lithological columns corresponding to the locations of the executed VES have also been established.
The scintelometer is used to measure the radioactivity levels of the ditch outcrops in the study region. Such radioactivity measurement procedures have been carried out along the two wall sides of the excavated ditch, in attempt to define the secondary uranium mineralization occurrences, and determine the localities of their distributions and concentrations along the litho-sequence of the ditch walls.
Figure 3 shows the established radioactive cross-section of the Western wall of the ditch, where high readings above 400 cps are encountered.
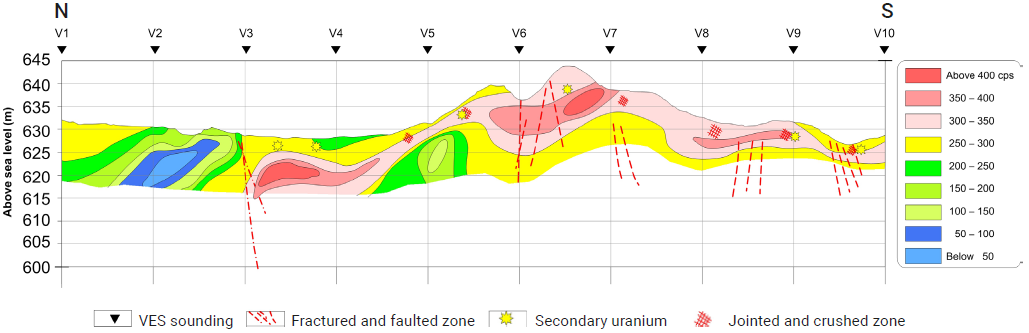
Figure 3 Radiometric cross-section of the Western wall of the ditch in Al-Sharquieh phosphatic mine.
The uranium occurrences are observed along the western side of the wall ditch, where a yellow, canary yellow of uranium vanadate is mostly accumulated in the fissured and crashed zones, along the ditch wall, and concentrated also in detritus and marly mortar zones around the phosphate and flint concretions and nodules. The high relatively radioactive readings are due to secondary uranium occurrences, mostly concentrated along horizons not exceeding 2.5 to 3 meters from the earth surface. secondary uranium occurrences have resulted from vertical leaching movement from the phosphate deposits during the wet periods, with possible lateral contribution supply (Slansky, 1988). This secondary uranium mineralization is finally concentrated in the upper parts of the litho-horizons by the action of the capillary phenomenon under arid conditions during the dry periods.
A geoelectrical profile including ten VES soundings has been performed parallel to the western wall side of the ditch (Fig. 2). Those VES points were interpreted by ISM, where their results are indicated and shown in Table. 2 (Appendix-2). A model of five layers is found for the VES (V1,V3, V5, and V7), while a model of four layers is found for the VES (V2,V4, V6, V8, V9, and V10), as shown in Table. 2. The depth penetration (DP) obtained by ISM for the current electrode spacing of AB/2 of 106.6 varies between 25.3m at VES (V3) and 54.8m at VES (V1), with an average of 44.7m. An acceptable agreement is found between the ISM interpretation results and the established field lithological columns as shown in Fig. 4(a).
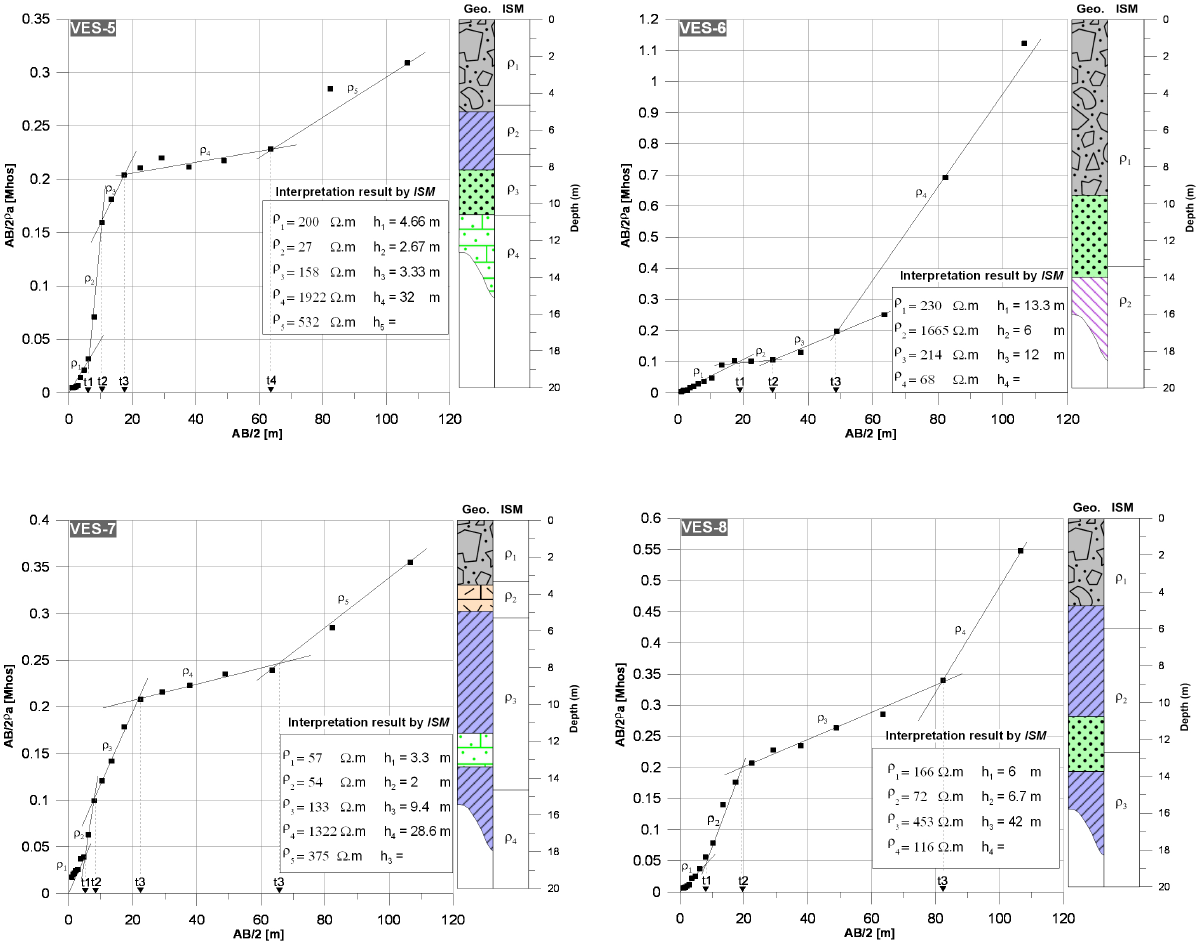
Figure 4(a) Interpretation of VES (V5,V6,V7, and V8) by ISM, with lithological columns for comparison.
This agreement confirms again well the reliability of ISM in interpreting VES measurements in a variable lithological sequence.
The geologic legend is the same as presented in Fig. 5(a). Those ten VES were also interpreted by CMM and inversion technique of Velpen 2004, where acceptable and comparable results are also obtained as shown and indicated in Table 2 (appendix_2). Fig. 4(b) shows the VES results of (V1, V2, V3 and V4), in which the real values of the thicknesses and resistivities of the corresponding layers are represented.
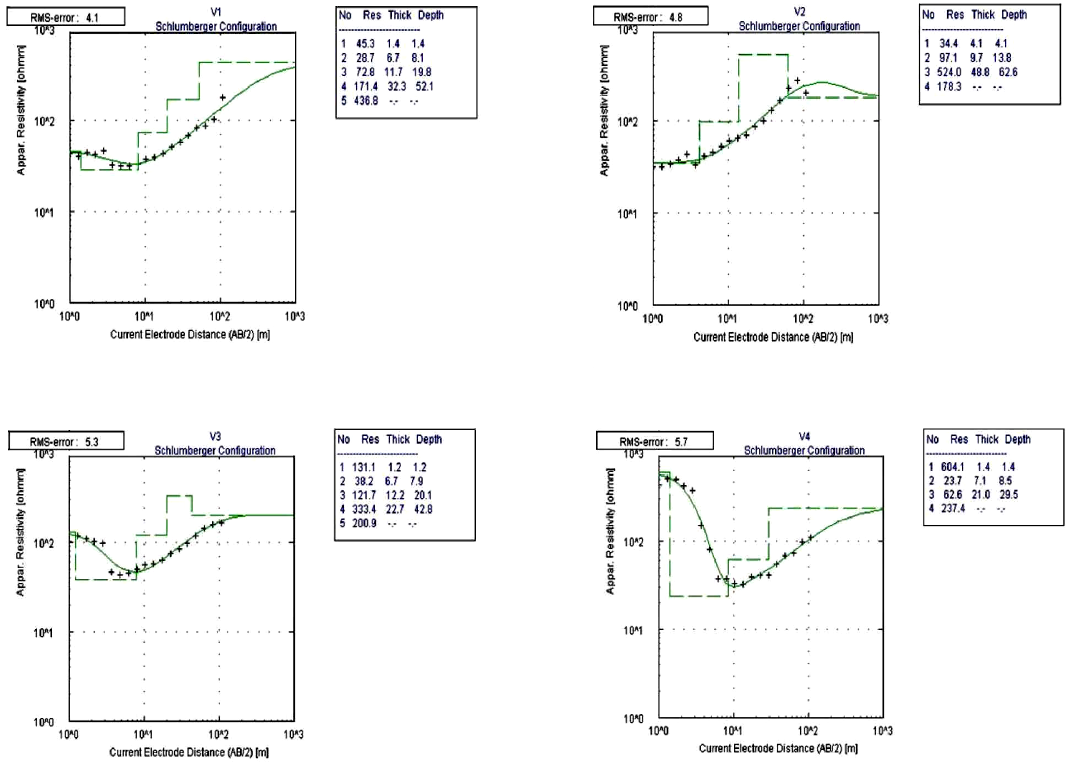
Figure 4(b) Interpretation of VES (V1,V2,V3,and V4)) by CMM and inversion technique of Velpen, 2004.
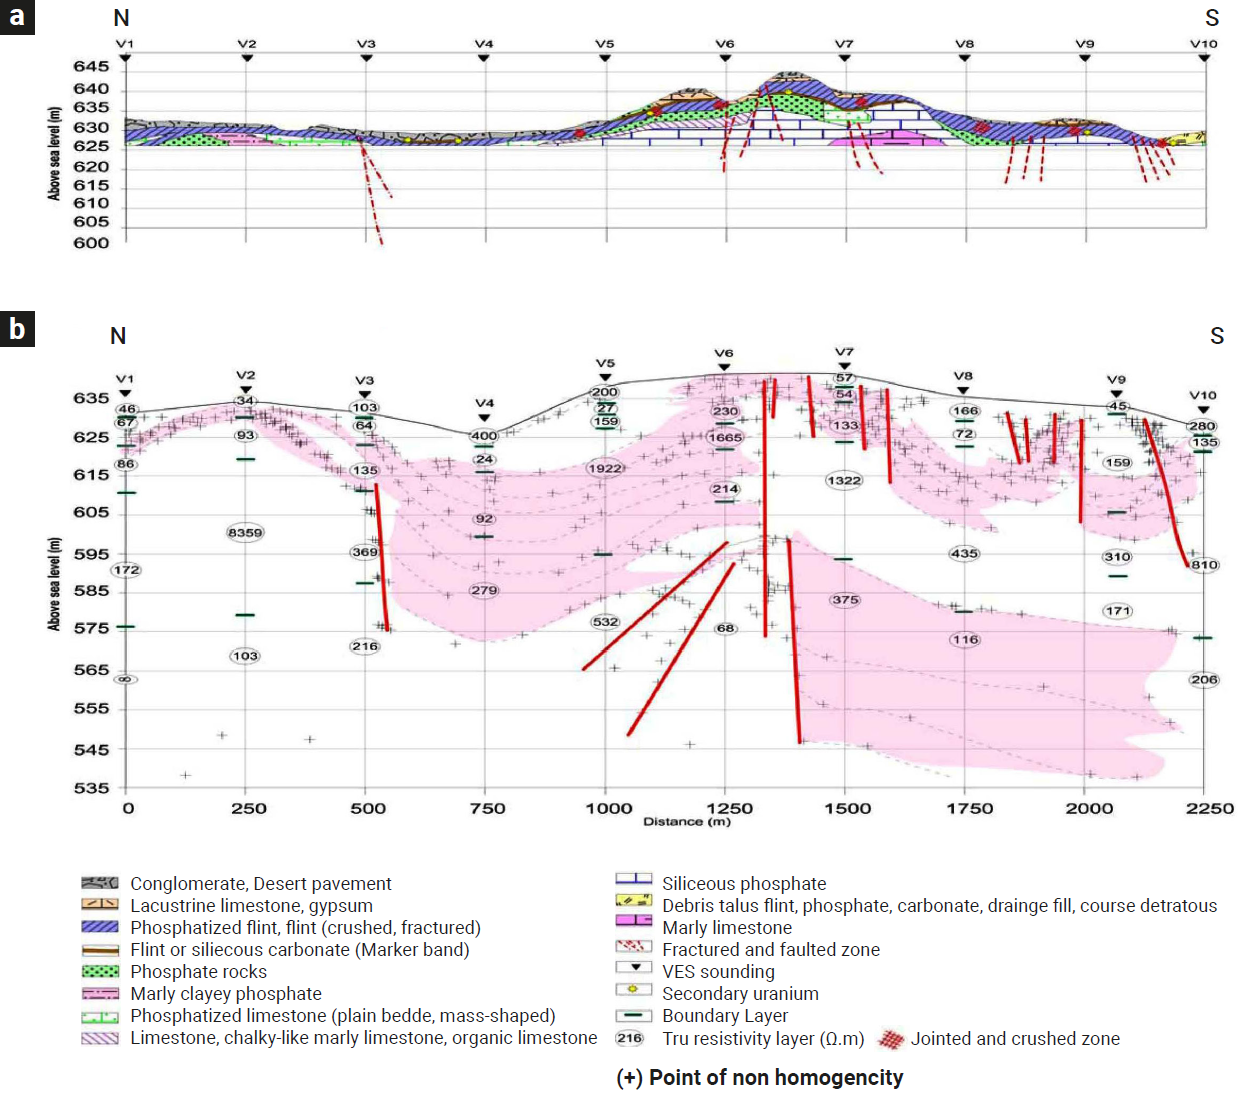
Figure 5 (a). Geological cross-section of the western wall of the ditch in Al-Sharquieh phosphatic mine, (b):Subsurface tectonic structure derived by PHT.
This agreement between ISM and CMM confirms directly in the field the reliability and the efficacy of ISM technique in determining the lithological sequence in a phosphatic environment.
The interpretation of this profile by the PHT method is shown in Fig. 5. The distribution of the non-homogeneity points (NHP) represented by (+) indicates the structural subsurface of the study profile. A deep pelvic structure is shown between V1 and V6, while a shallow pelvic structure is observed between V6 and V10. The PHT technique also indicates the positions of the different faults through the distribution of NHP.
The comparison of the geoelectrical results obtained with the geological cross-sections (Fig. 5a) indicates a very good concordance between them, where the distribution of the layers shows a form of basin between V1 and V5, followed by an uplift structure between V5 and V7, and finally by a basin structure between V7 and V10. Such a concordance between the results of the geological cross-section (Figs. 5a, and 5b) realized in the western wall of the ditch and the geoelectrical ones confirms the reliability of the PHT in providing the phosphatic subsurface structure under a given profile.
The ten VES measured points distributed along the ditch profile of 2250 m are interpreted and analyzed by applying the fractal concentration-number (C-N) model. The log-log plots of CNp shown in Fig.6(a) as a function of the apparent resistivity values show the apparent resistivity scattered data points, which can be fitted by several straight lines (segments) with different slopes based on a least square regression. The selection of the break points as threshold values is an objective decision since apparent resistivity populations are addressed by different line segments in the C-N log-log plots. The intensity of the various populations is depicted by each slope of the line segment in the C-N log-log plots.
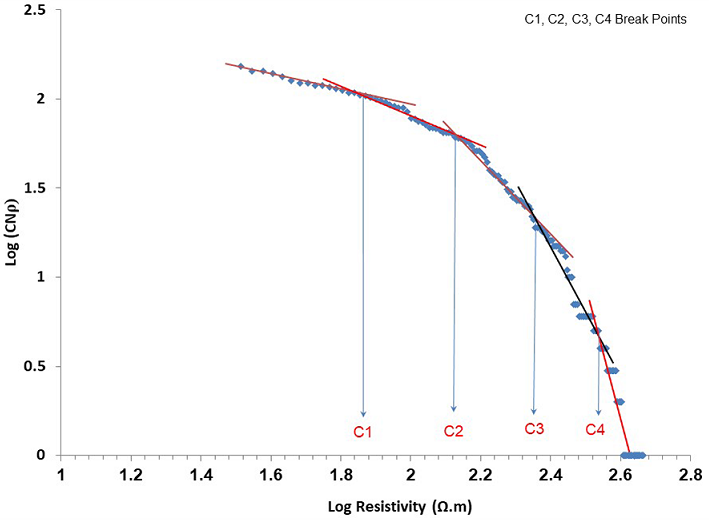
Figure 6(a) Fractal (C-N) log-log plot for the measured apparent resistivity data along the ditch profile.
The locations of the break points allow the determination of the apparent resistivity ranges. The use of those resistivity ranges permits the establishment of the apparent resistivity cross-section. Every resistivity population range is due to a distinct and specific lithology. The boundaries between those resistivity ranges also indirectly emphasize the lithological type distribution along the studied profile.
Based on the C-N log-log plot presented in Fig. 6(a) for the study ditch profile, the apparent resistivity pa for all the AB/2 spacings shows four threshold break points C1, C2, C3 and C4 at the locations of 1.84, 2.12, 2.34 and 2.53 respectively. Those four break points correspond to five apparent resistivity population ranges with their lithological descriptions inferred from the geological cross-section described above (Fig. 5a) as follows:
Less than 69 Ω.m: corresponds to lacustrine limestone, wadi-fill deposits and gypsum.
69-132 Ω.m: corresponds to conglomerates (fissured), detritus and debris.
132-219 Ω.m: corresponds to marly, clayey phosphate, organic limestone and chalk- like marly limestone.
219- 339 Ω.m: corresponds to phosphatic limestone, phosphate rocks of carbonate/silicate cementation and duricrusts (slightly fissured).
More than 339 Ω.m: silicified compacted phosphate rocks, phosphotized flint (sometimes fissured and cracked).
The apparent resistivity cross-section along the ditch profile is established through the use of the mentioned apparent resistivity ranges as shown in Fig. 6(b). The distinction between those five resistivity populations is very clear, where every apparent resistivity population is related to a distinguished lithology. The lithology distribution along the studied profile is also indirectly indicated by the boundaries between those resistivity ranges. The positions of the faults also control those lithological boundaries.
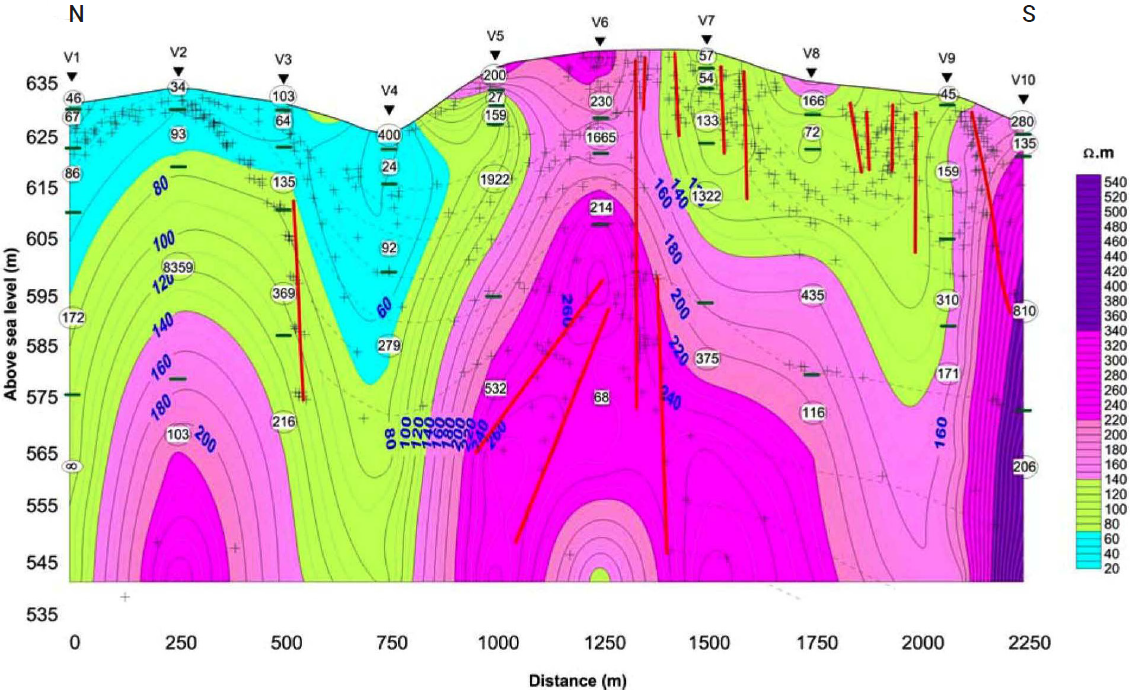
Figure 6(b) Apparent resistivity population ranges according to (C-N) fractal modeling under the excavated ditch.
Fig. 6(b) is a comprenhensive representation of all the interpretative techniques applied in this paper (ISM, PHT, and fractal C-N). It generally summarizes all the geoelectrical results obtained in this paper. The comparison between those different methods and their results is therefore done and discussed.
The joint combination of the radiometric cross-section with the integrated geoelectrical results including the resistivity models shown in Fig. 6b allows for a good correlation between them. The secondary uranium occurrences in the study region are accumulated in the weak, fractured and faulted zones around the phosphatic deposits, determined particularly by the geoelectrical PHT technique. The application of geoelectrical techniques for delineating such interesting radioactive zones constitutes, therefore, an indirect technique for nuclear uranium prospecting.
5. Conclusion
The reliability of the inverse slope method (ISM), Pichgin and Habibuleav technique (PHT), and concentrate-number (C-N) fractal modeling technique, used for interpreting vertical electrical sounding (VES) data is confirmed through the presence of an excavated ditch in the phosphatic Al-Sharquieh mine in Central Syria. The concordance between the different obtained geoelectrical results and the lithology of the ditch is well verified.
The 1D quantitative interpretation of the available ten VES by ISM indicates the presence of four to five geoelectrical layers in the study region. The ISM results discussed and documented are in good agreement with those obtained by CMM and the inversion of Velpen, (2004). This agreement proves and valorizes the ISM technique for such interpretation and mining applications.
The PHT helps in determining the main tectonic subsurface features of study region by analyzing and studying the positions of the non homogeneity points (NHP) and their distributions along a given 2D geoelectrical plan profile.
The non linear fractal C-N modeling technique provides the different apparent resistivity ranges dominating in the study region. The C-N approach deals only with apparent resistivity values measured for different AB/2 spacing's (from 1 to 106.6m) to separate simply different apparent resistivity ranges that differ from area to area. The locations of the break points on the log-log graph in this case study permit the determination of the dominant apparent resistivity ranges, which can be used later for establishing the apparent resistivity cross-section as discussed in this paper. It was shown that every resistivity range is related to a distinct and specific lithology. The boundaries between those different resistivity ranges indirectly indicate the lithological type distribution along the studied profile. It is to mention that the two techniques of C-N and VES inversion are completely different. However, the fractal C-N largely helps in separating the different apparent resistivity ranges, that dominate in the study area, and relating those ranges with geological variations laterally and vertically. While, the VES inversion technique deals with its different approaches to getting the interpretative real thicknesses and resistivities models of the corresponding layers under every studied VES point. The joint integration of the radiometric cross-section (Fig. 3) with the combined geoelectrical results, including the different resistivity models indicated in Fig. 6b permits the correlation between radiometric and geoelectrical results. The secondary uranium occurrences are concentrated in the weak, fractured and faulted zones around the phosphatic deposits, determined in the study area basically by the geoelectrical PHT technique. The useful application of geoelectrical techniques for locating radioactive uranium zones can be regarded advantageously as an indirect approach to uranium prospecting.
The presence of the excavated ditch allows for the formation and distribution of secondary uranium concentrations accompanied with the phosphatic layers. They are characterized by high radioactive readings exceeding four hundred counts per second (cps).
The three geoelectrical approaches of ISM, PHT, and C-N used for VES interpretations can therefore be employed in the domain of phosphate prospecting, mining, environmental research, and civil engineering.
7. Data availability
The datasets related to this research paper are available with the author, however accessing to these data or making them available to others requires special permission from the Syrian Atomic Energy Commission.
8. Declaration of competing interest
The author declares that he has no known competing financial interests or personal relationships that could have appeared to influence the work reported in this paper.